-
Industrial robot costs: robotic economics?
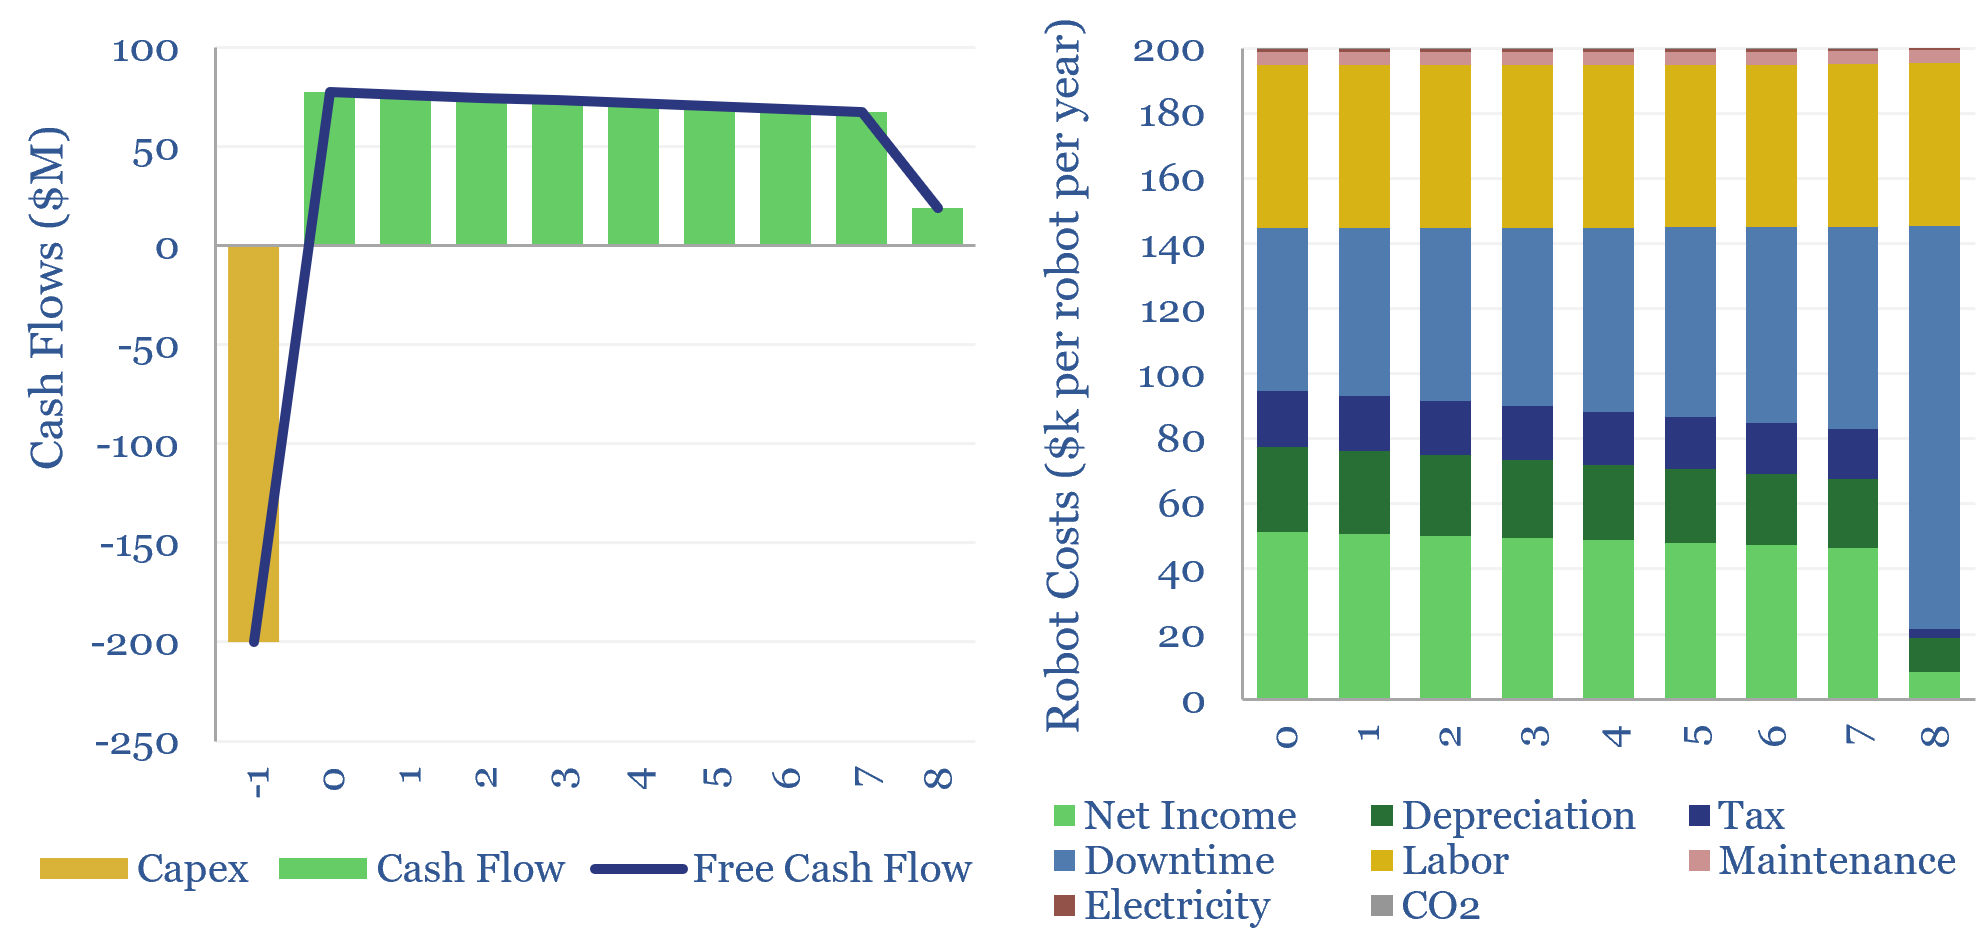
There are 5M industrial robots deployed globally. A typical example costs $130k to install, does incur costs to run, but displaces 1.3 FTE jobs, saves 50% total costs, and thus achieves a payback of 1.5-years and a project-level IRR of 65%. This data-file captures the economics of deploying industrial robots.
-
Rare Earth magnets: building attraction?
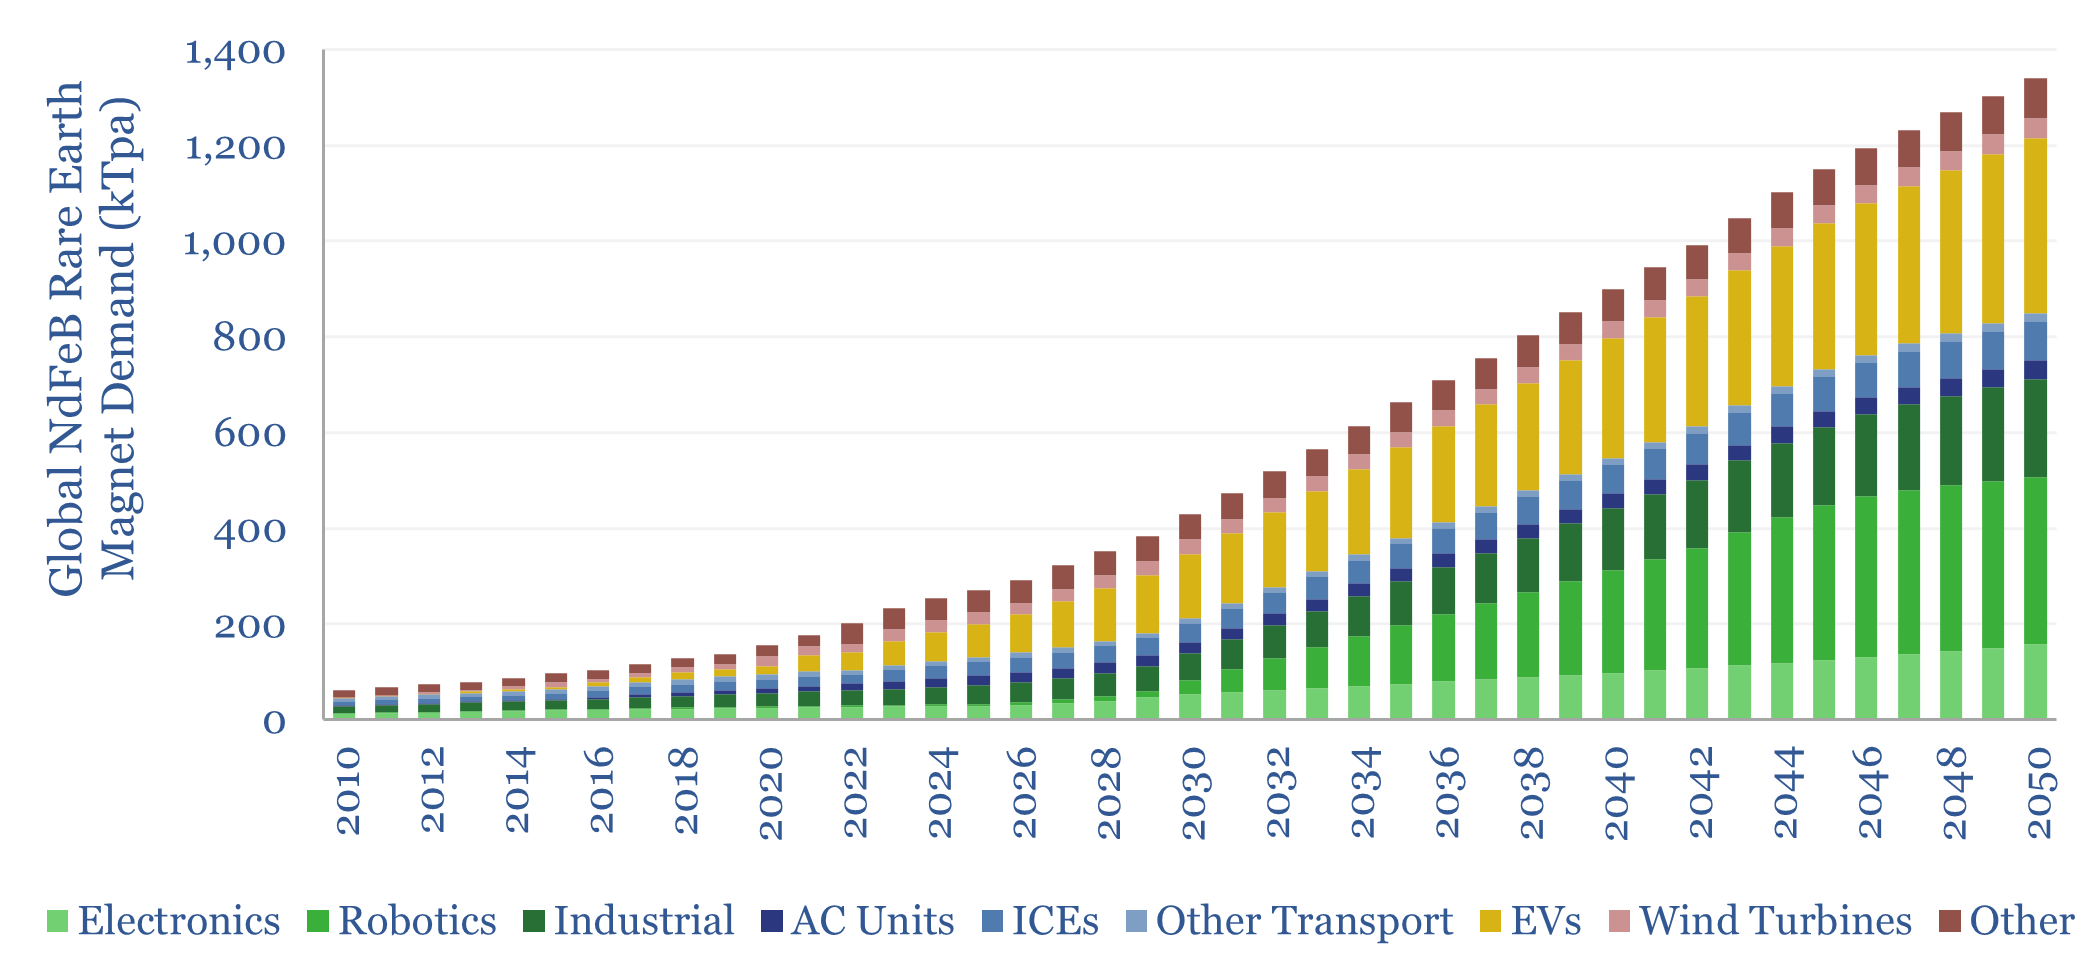
Will Rare Earth magnets shift from being commoditized and mostly Chinese-made, to a higher-value market, sustaining a moat for leading Western companies? Especially as demand inflects in the AI era? Our answers in this 14-page report are based on a site visit to Europe’s first large-scale Rare Earth magnet plant, and subsequent economic modeling.
-
Global Air Conditioning demand by region over time?
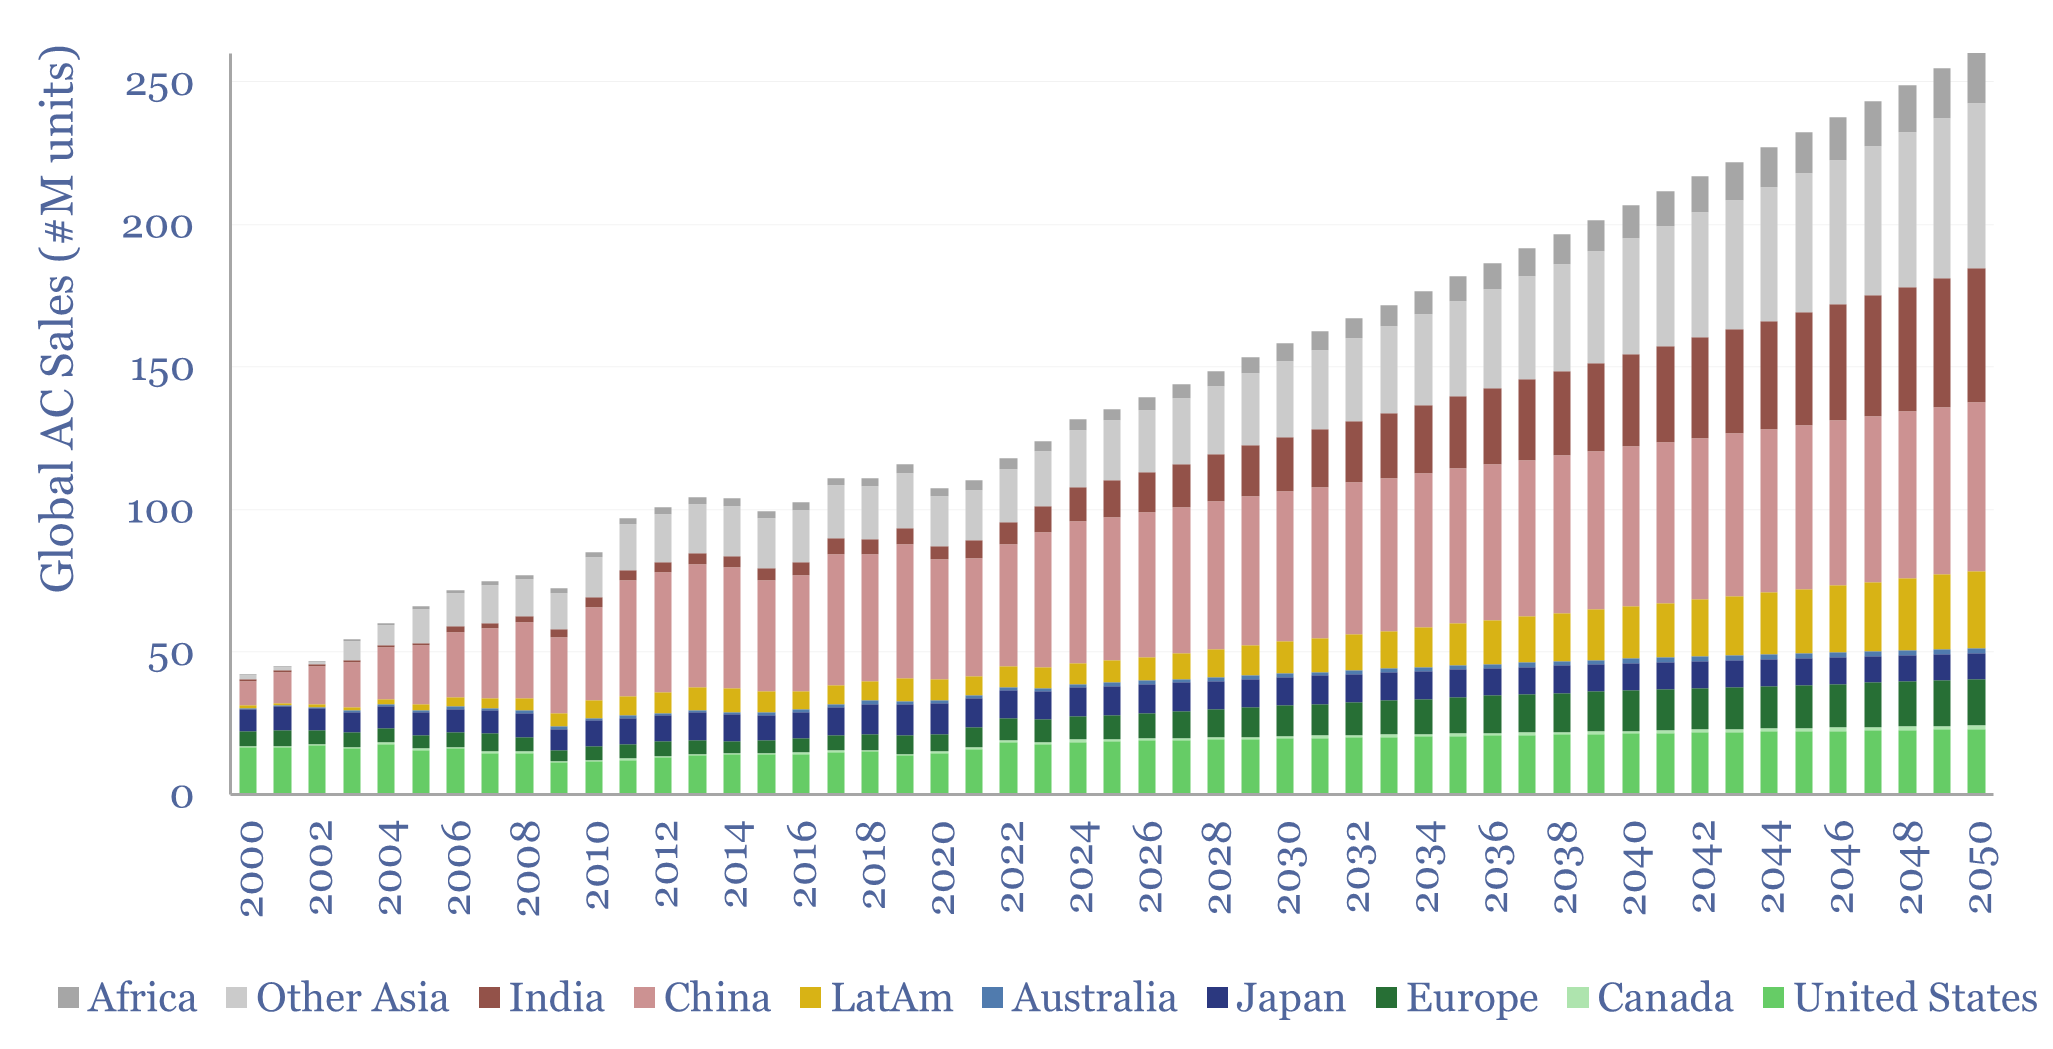
Global air conditioning consumed 2,600 TWH of electricity in 2024, which is 8% of total global electricity demand, and seen rising +3% pa to 6,000 TWH by 2050. This data-file quantifies global AC sales by country, the global AC unit stock by country, and global AC electricity demand by country, to 2050.
-
Global flow-meter market: types, advantages and challenges?

The global flow-meter market was worth $12bn in 2024, across 4M flow-meters, with an average price of $3k per unit, and typical accuracy of 0.5-1%. This data-file disaggregates the market by flow-meter type, highlighting the physics, advantages, challenges, pricing, volumes, market sizing and leading companies involved in each type.
-
Steam generation: capex costs?
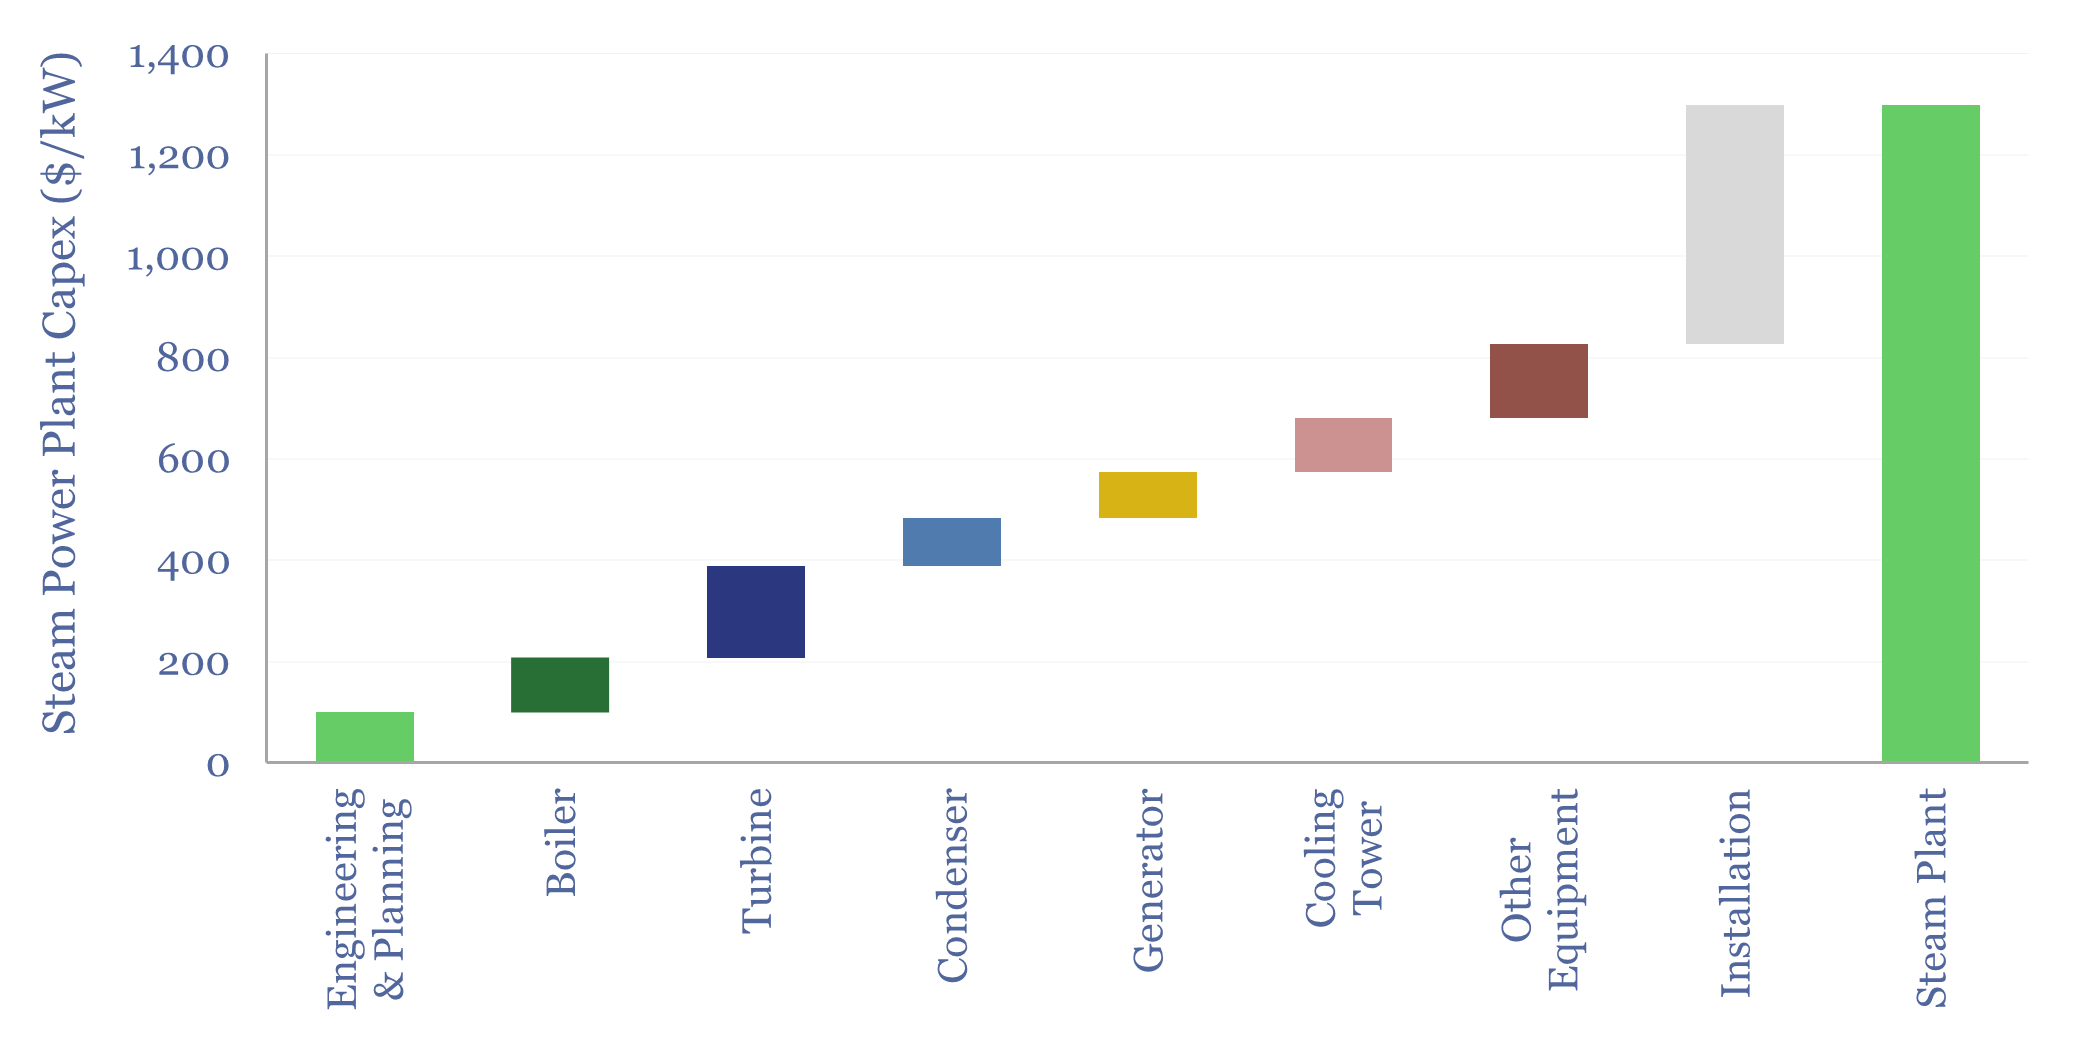
Steam power generation requires boilers, turbines, condensers and generators, which are often integrated into a steam generation “island” at coal, nuclear and CCGT power plants. Steam generation capex costs are estimated at $1,300/kW in this data-file, based on sampling component costs across 35 past projects.
-
Renewables returns: what IRRs for wind and solar?

Core IRRs for 100 renewables projects are calculated in this 15-page report. Past renewables returns have averaged 5% for solar, 6% for wind. But recent solar returns have reached 8-11%, due to cost deflation. Solar growth will therefore continue, even as policy support softens? And could this put pressure on power prices if load growth…
-
Renewable PPAs and strike prices: a database?

This data-file tabulates power purchase agreements, strike prices and contract-for-difference details, across 100 renewables projects (wind and solar) over the past decade. From this, we can also back-calculate project IRRs, using our broader economic models.
-
Rare Earth magnet manufacturing: the economics?
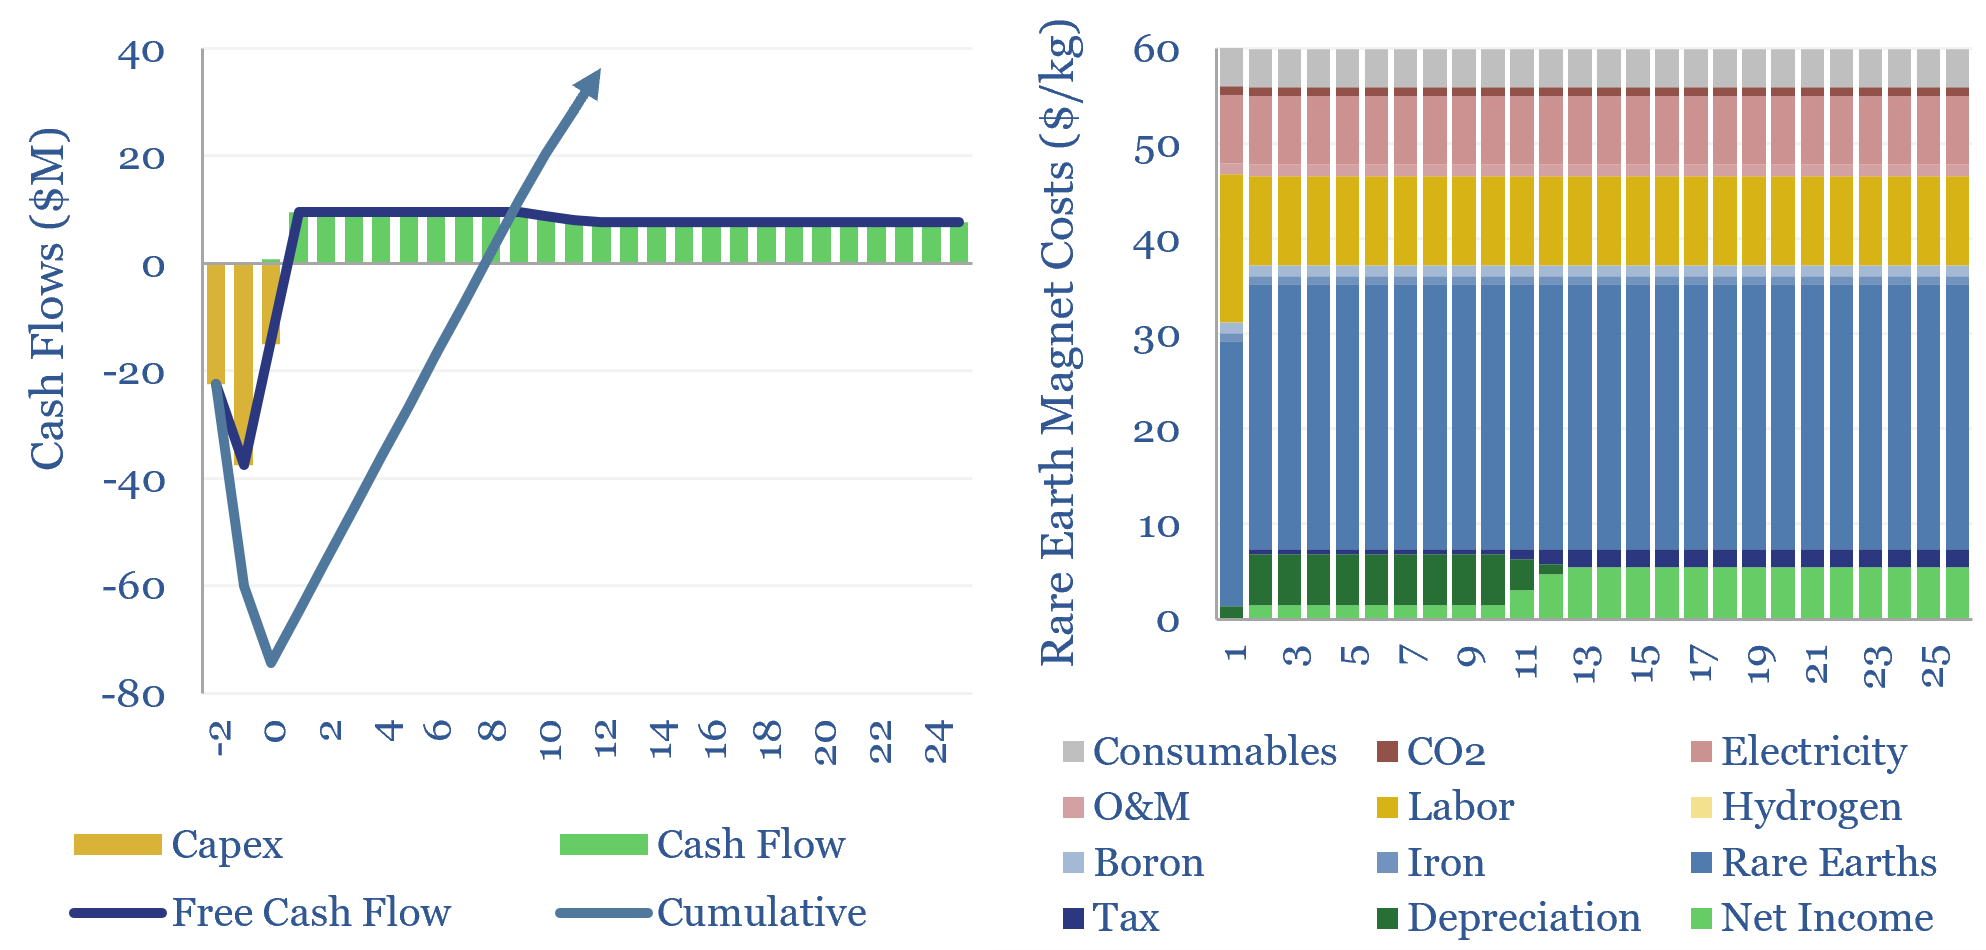
The economics of Rare Earth magnet manufacturing are captured in this data-file. A $60/kg magnet price unlocks a 10% IRR at a new facility converting Rare Earths, steel and ferroboron into sintered NdFeB magnet products, repaying capex and cover other magnet manufacturing costs.
-
The US CPI basket: how much is energy?

Energy is c15% of the US CPI basket, on average, from 2011-24. In other words, if energy prices suddenly doubled, this would ultimately create c15% inflation. c7% of the total is direct energy use and another 8% is energy embedded in other goods and services, as quantified in this look-through analysis.
-
Wi-Fi networks: finding a hotspot?
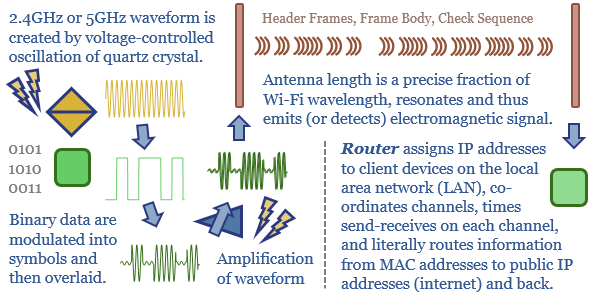
Could the electricity demand of Wi-Fi networks surprise to the upside due to AI, as 100bn future devices relay 1-10Mbps of data, including for machine vision? This 15-page report outlines Wi-Fi energy economics from first principles. Vastly more network traffic can be supported, simply via efficiency gains.
Content by Category
- Batteries (96)
- Biofuels (44)
- Carbon Intensity (48)
- CCS (64)
- CO2 Removals (9)
- Coal (41)
- Commentary (65)
- Company Diligence (105)
- Data Models (924)
- Decarbonization (162)
- Demand (131)
- Digital (87)
- Downstream (47)
- Economic Model (221)
- Energy Efficiency (76)
- Hydrogen (63)
- Industry Data (308)
- LNG (56)
- Materials (86)
- Metals (88)
- Midstream (45)
- Natural Gas (161)
- Nature (76)
- Nuclear (28)
- Oil (176)
- Patents (39)
- Plastics (44)
- Power Grids (156)
- Renewables (153)
- Screen (138)
- Semiconductors (35)
- Shale (58)
- Solar (72)
- Supply-Demand (53)
- Vehicles (94)
- Video (24)
- Wind (47)
- Written Research (407)