-
Global electricity: by source, by use, by region?

Global electricity supply-demand is disaggregated in this data-file, by source, by use, by region, from 1990 to 2050, triangulating across all of our other models in the energy transition, and culminating in over 50 fascinating charts, which can be viewed in this data-file. Global electricity demand rises 3x by 2050 in our outlook.
-
Levelized cost of electricity: stress-testing LCOE?
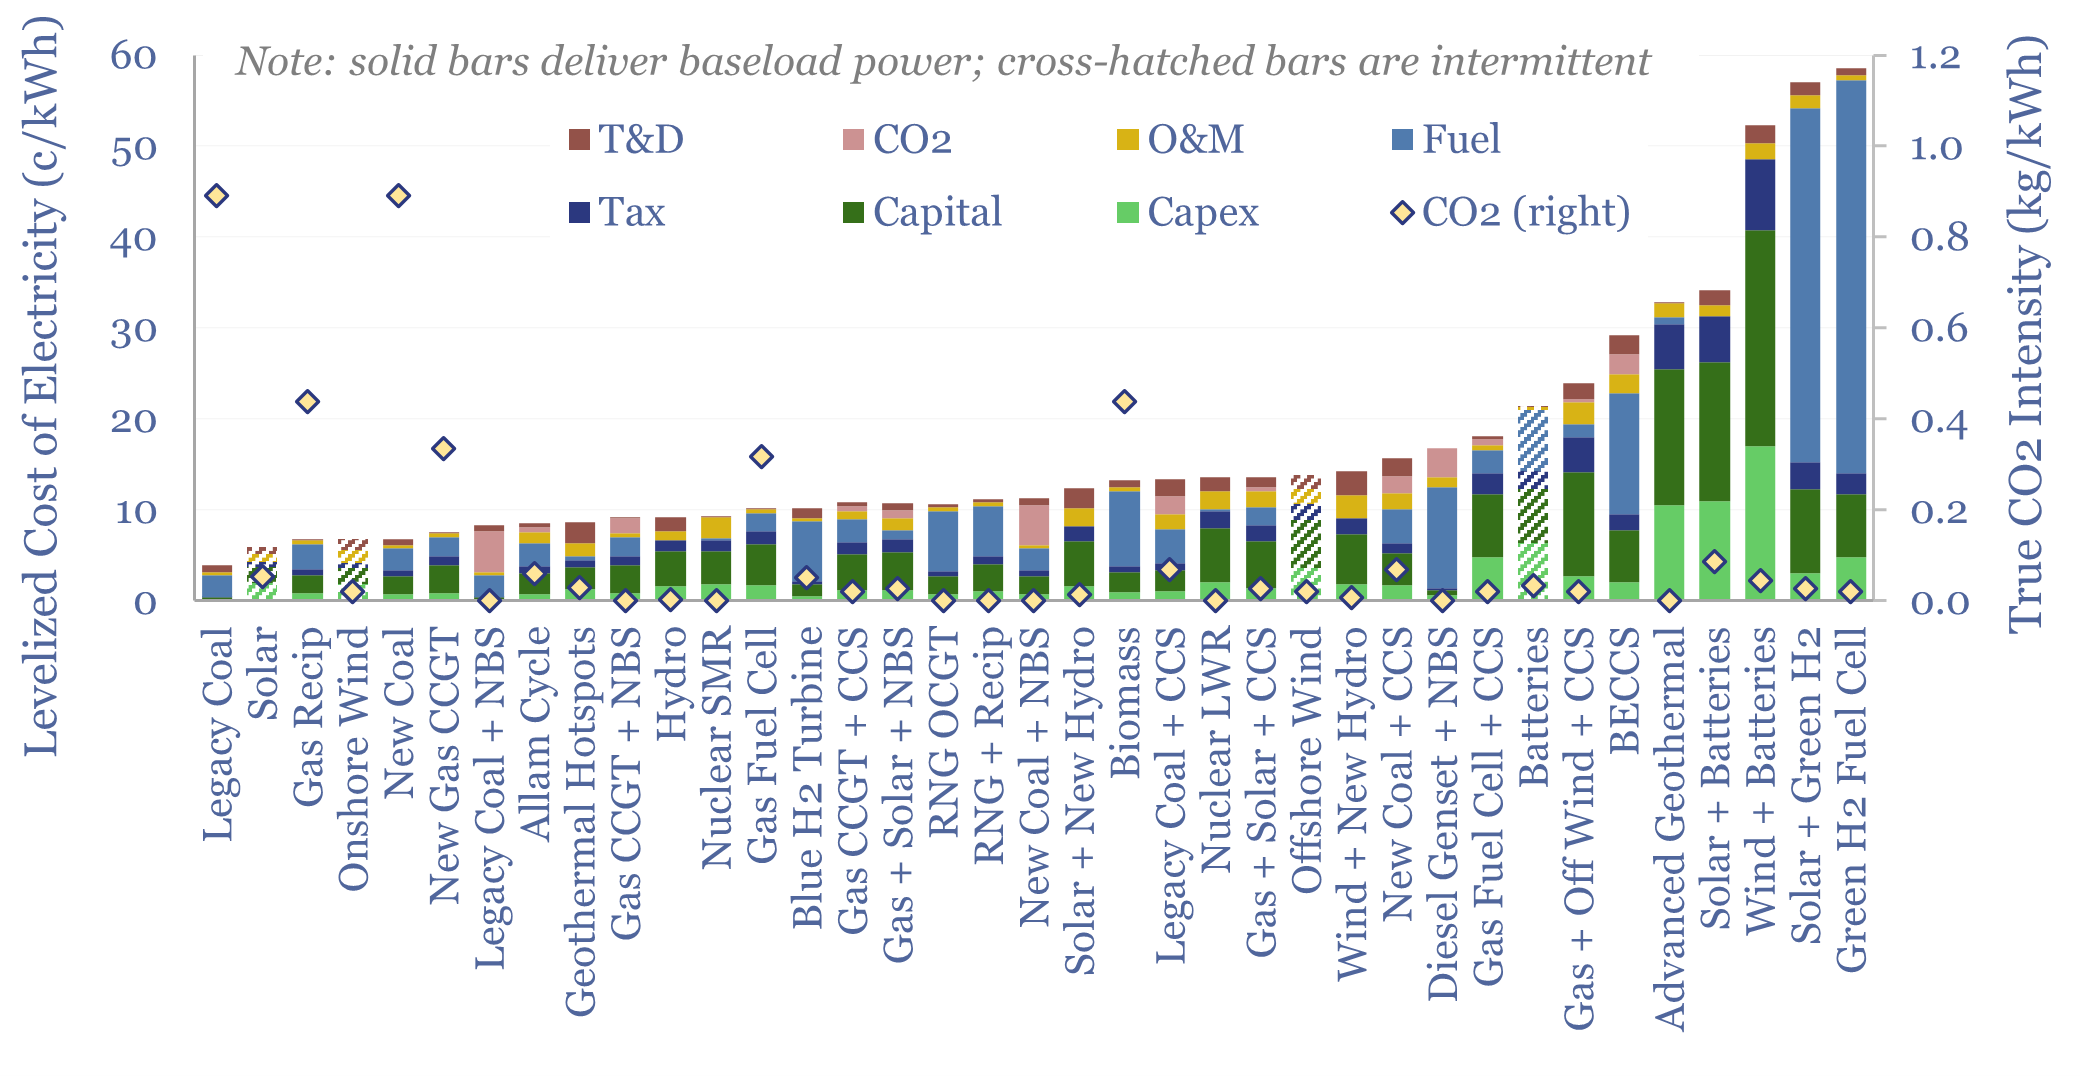
This data-file summarizes the levelized cost of electricity, across 35 different generation sources, covering 20 different data-fields for each source. Costs of generating electricity can vary from 2-200 c/kWh. The is more variability within categories than between them. Numbers can readily be stress-tested in the data-file.
-
Renewables+gas LCOEs versus standalone gas turbines?
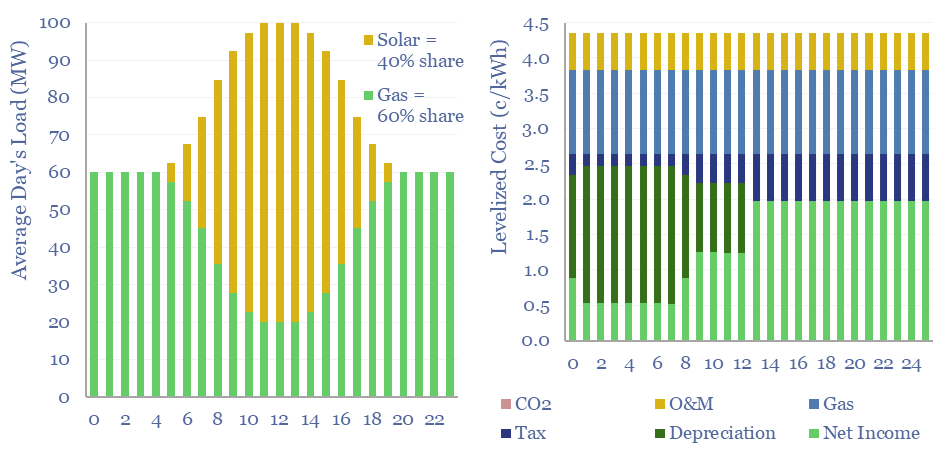
Levelized costs of electricity depend as much on the system being electrified as the energy sources used to electrify it. This data-file captures solar+gas LCOEs (in c/kWh), when meeting different load profiles, as a function of solar capex (in $/kW), gas prices (in $/mcf), and the relative utilization of solar vs gas.
-
European gas and power model: natural gas supply-demand?
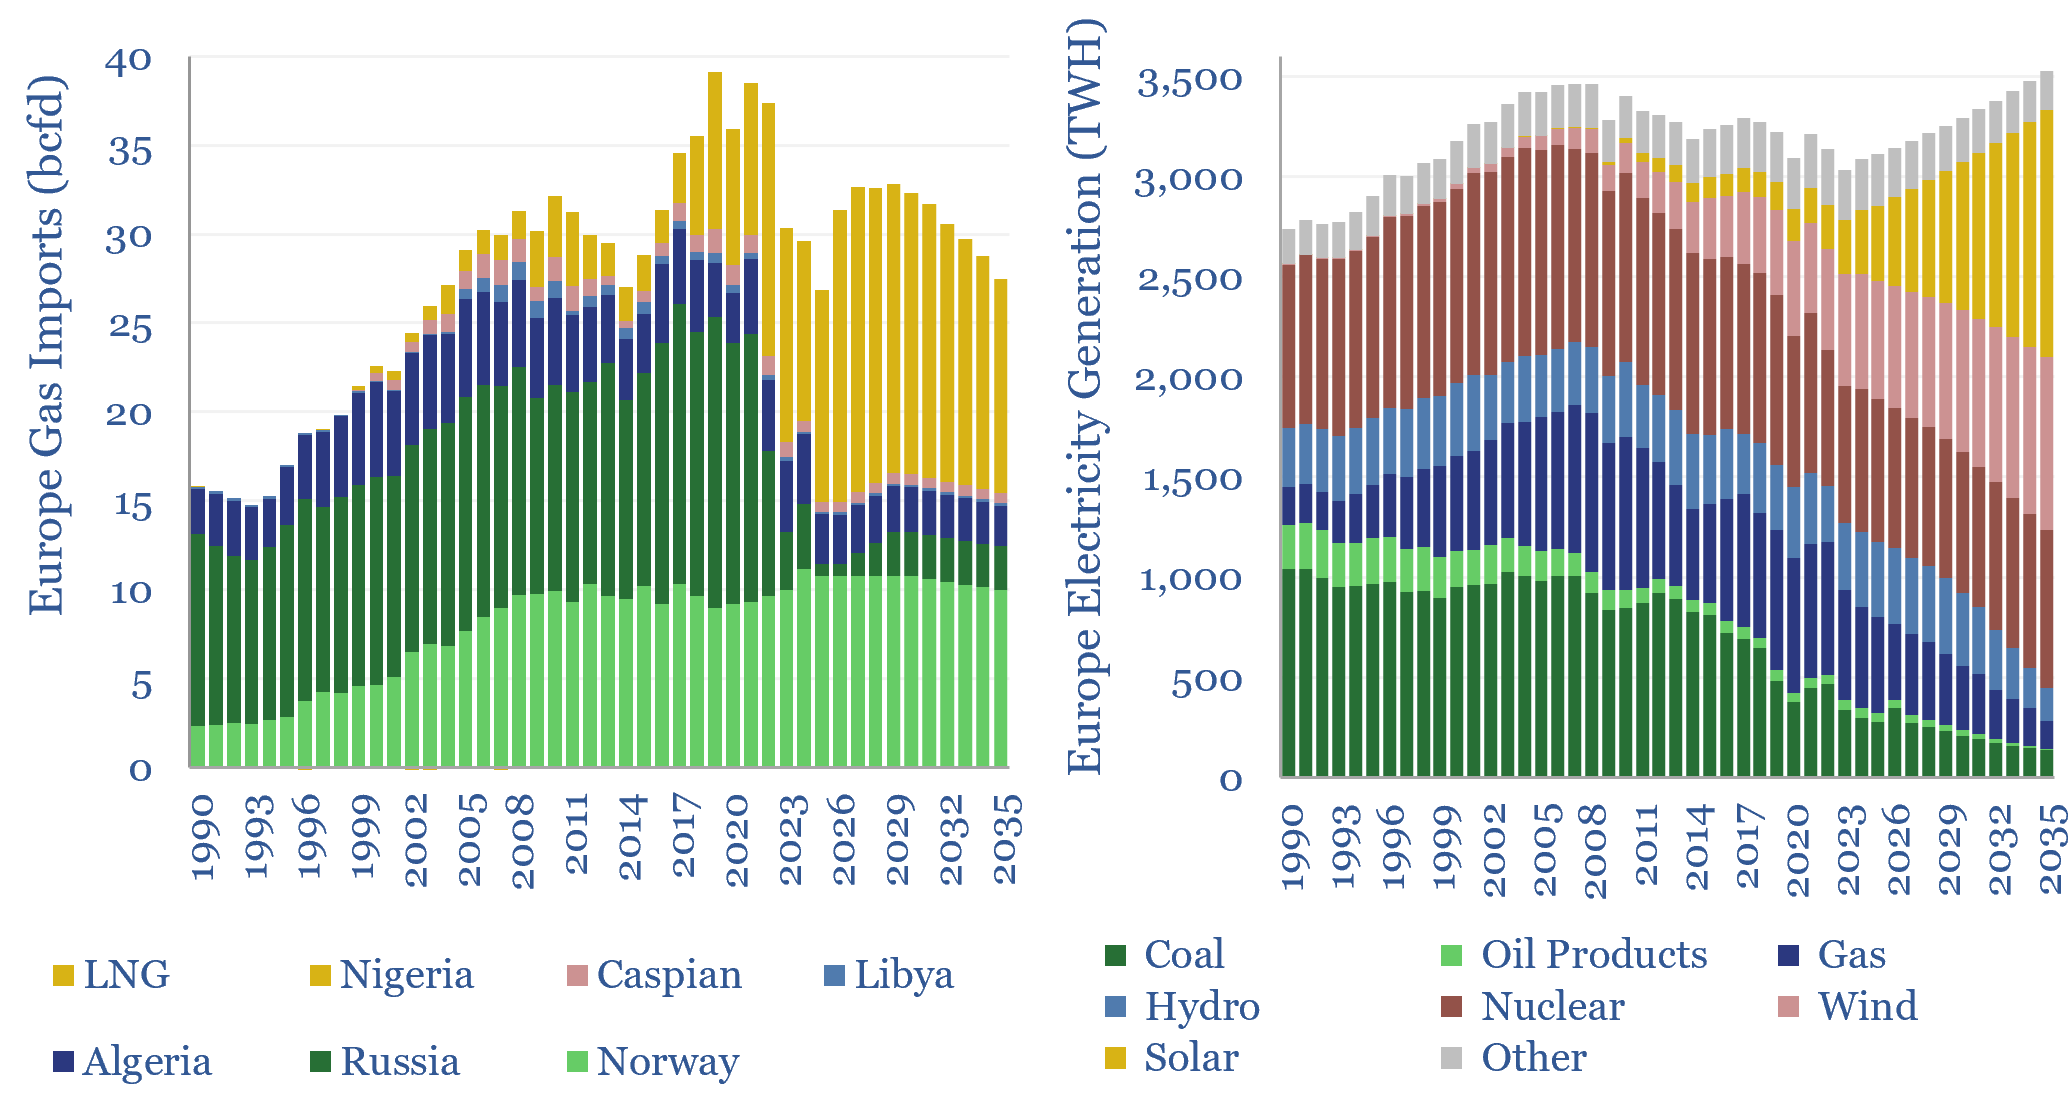
This data-file is our European gas supply-demand model. Balances are assessed in European gas and power markets from 1990 to 2035, reflecting all of our research into Europe’s energy transition. 2024-25 gas markets were supported by inventory draw-downs, but LNG imports step up from 110MTpa to 120MTpa through 2030, before softening again through 2035.
-
Fervo Energy: enhanced geothermal technology?
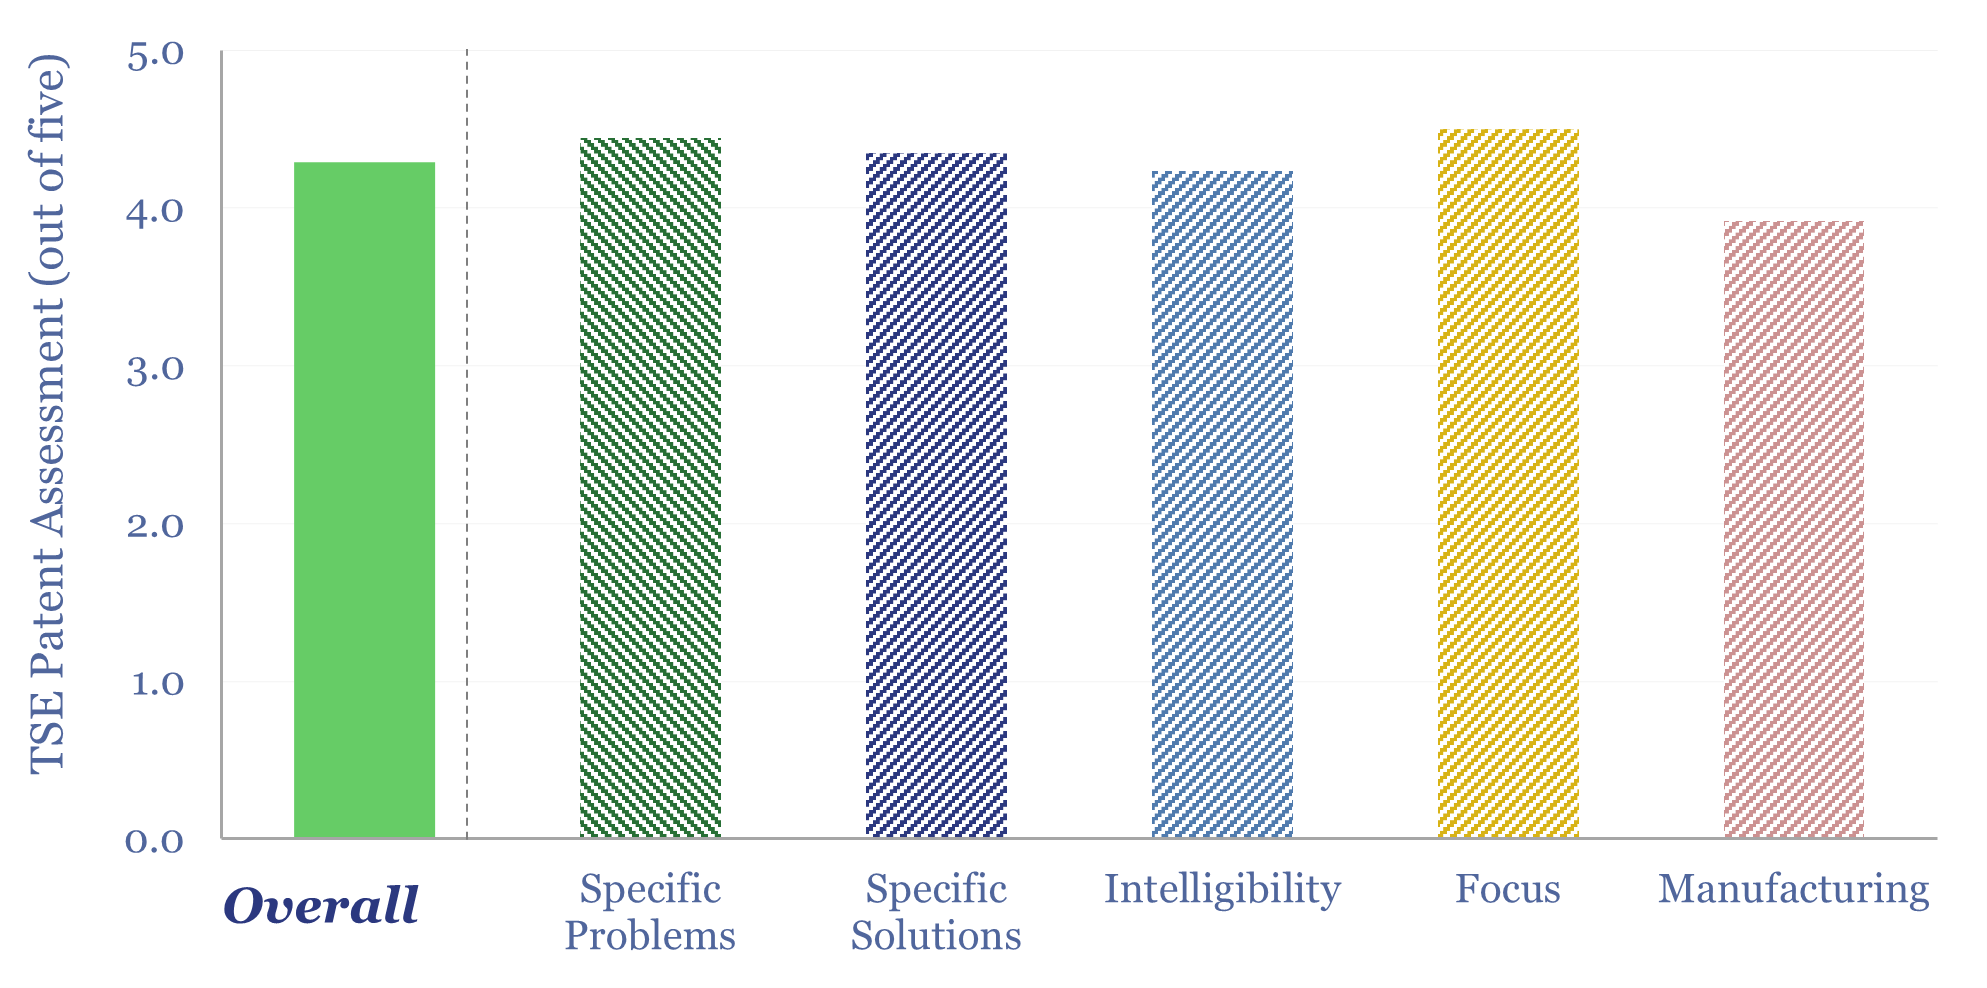
Fervo Energy is a leader in enhanced geothermal systems, harvesting 400°F+ heat from hot, deep rock formations, as fluids flow from fracced horizontal injectors to fracced horizontal producers. This Fervo Energy technology review is based on reviewing a dozen patent families. Fervo draws on fiber optic sensing data to optimize the well completion process and…
-
Electrical appliances: will AI accelerate efficiency gains?
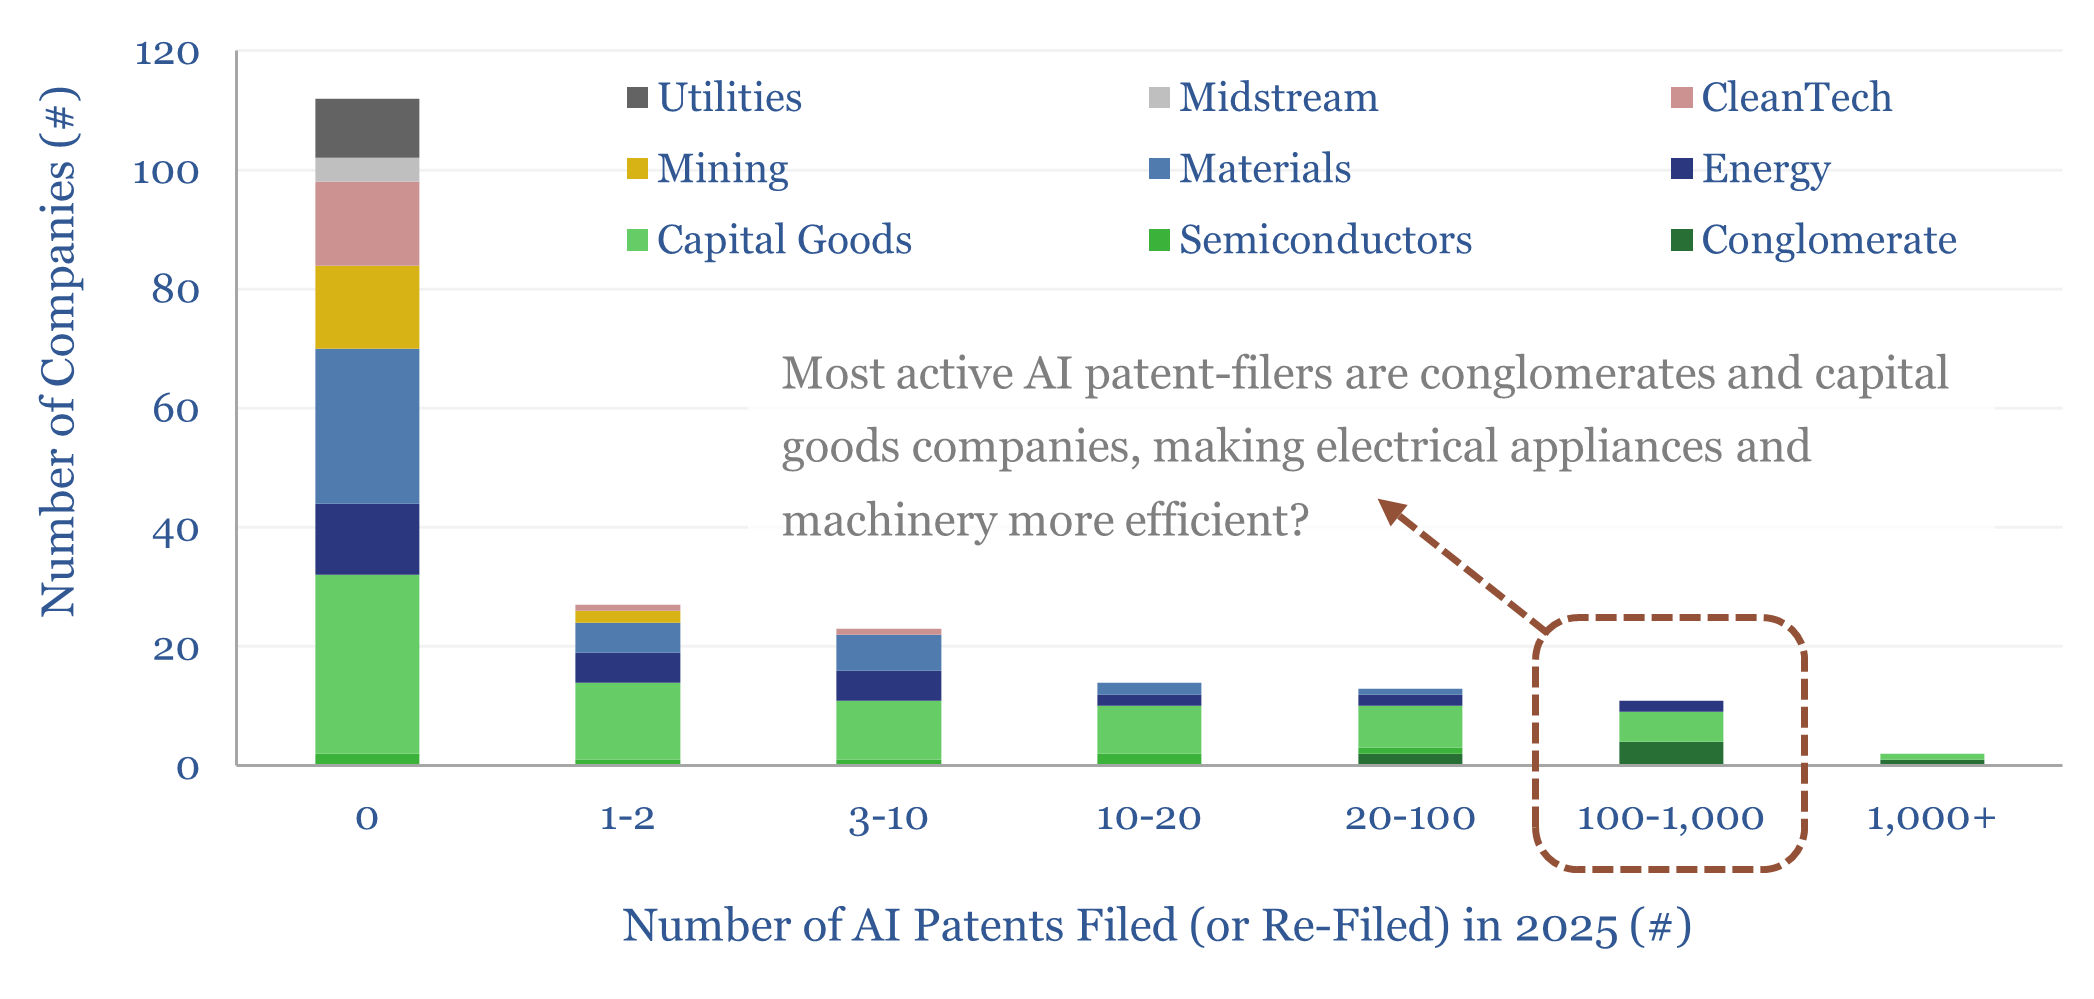
500,000 AI-related patents were filed in 2025. But electrical appliance manufacturers were particularly active. Hence we used AI ourselves, in this 14-page report, to home in on 50 key patents, which will improve efficiency and flexibility of electrical appliances using AI – in HVAC, lighting, refrigerators, TVs, etc. – which make up 50% of the…
-
India: electricity demand and power grid over time?
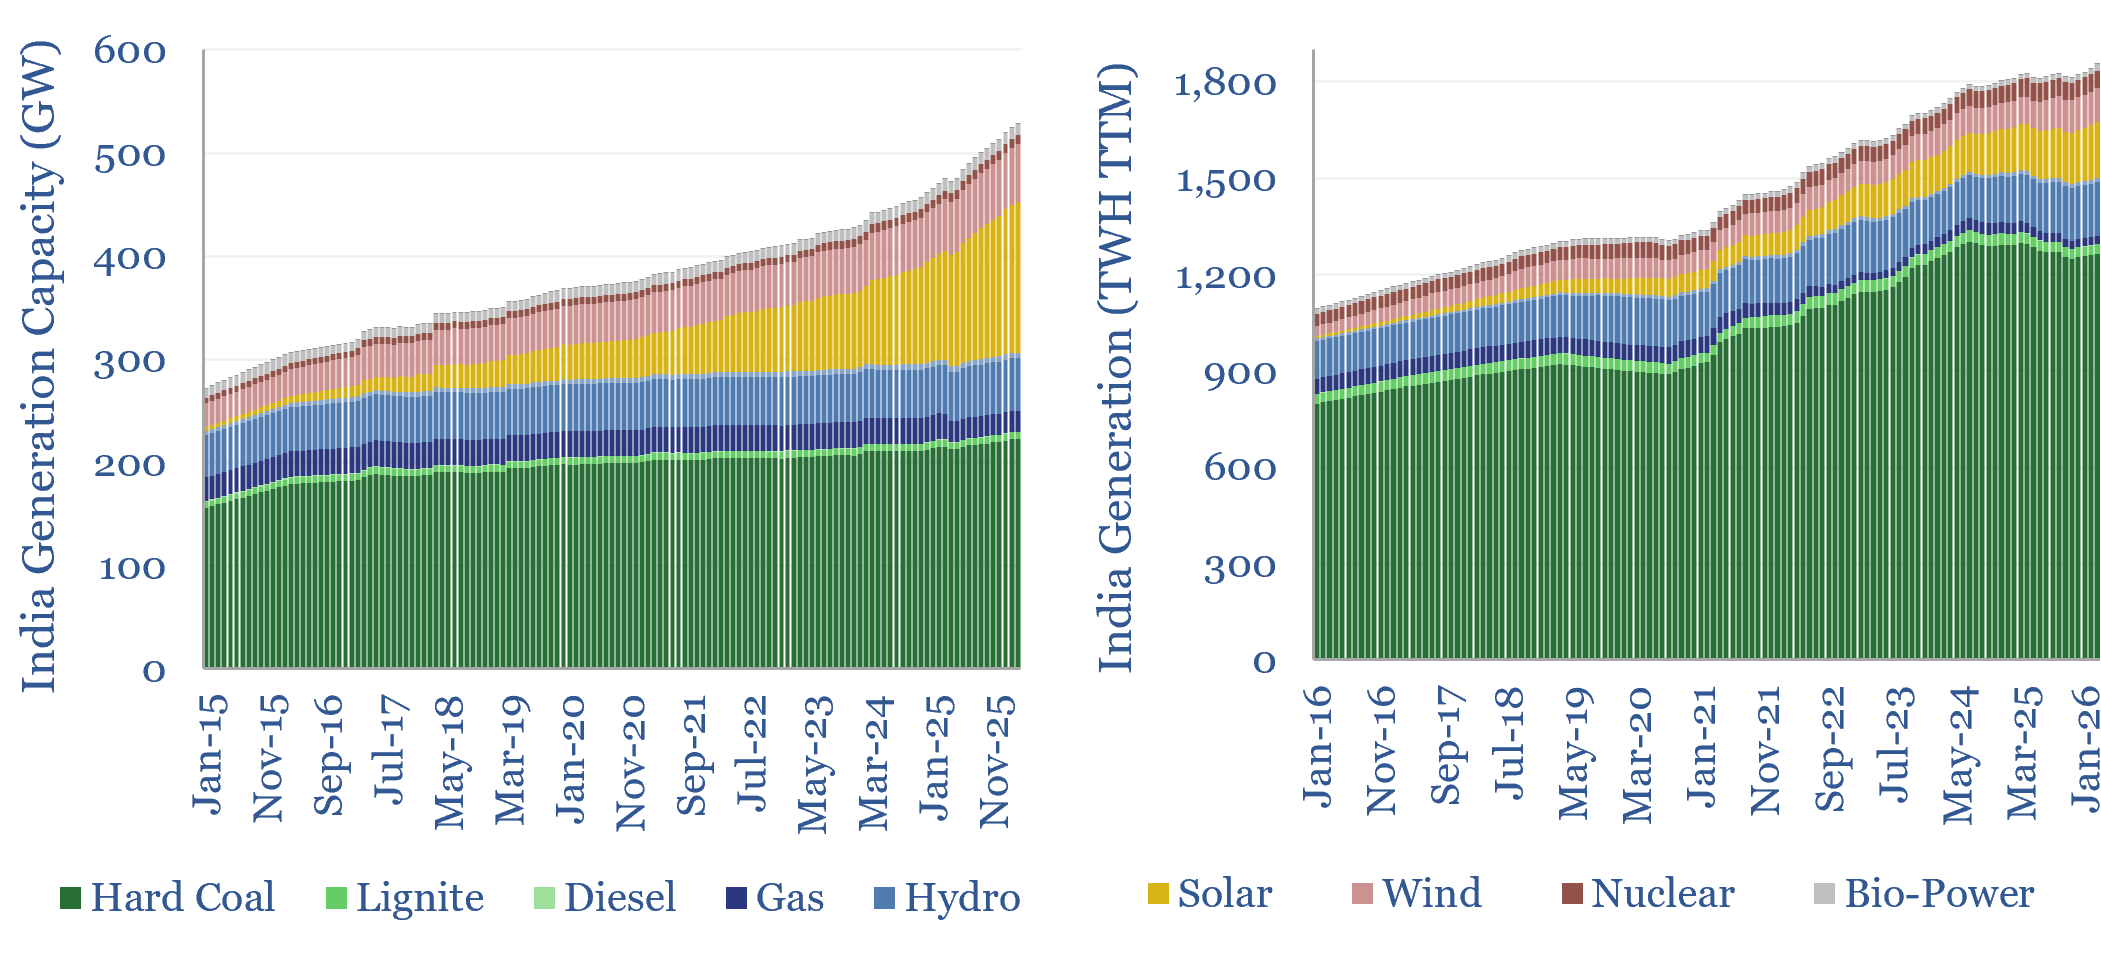
India’s electricity demand is growing by 6-8% (+100-140 TWH) per year, but 75% of the total still comes from coal, which has itself grown at a 6% CAGR in the past half-decade. India seems to be industrializing primarly around coal + solar, in relatively equal proportions?
-
US shale gas: the economics?

US shale gas economics are captured in this data-file, requiring a $2.5/mcf hub-level gas price, for a 10% IRR, on a large, $17M shale gas well in a basin such as the Marcellus. The marginal cost for unlocking c3% pa production growth from key shale basins is likely in a range of $3-4/mcf, but the…
-
China energy supply-demand model?

This data-file is our China Energy Model and China CO2 Model, disaggregating China’s energy demand by industry, across coal, oil, gas, wind, solar, hydro and nuclear, across c200 lines, from 2000-2060, with 20-input variables that can be stress-tested. By 2050, useful energy demand rises by 38%, electricity demand doubles, and CO2 falls back by 40%.
-
Solar trackers: leading companies?
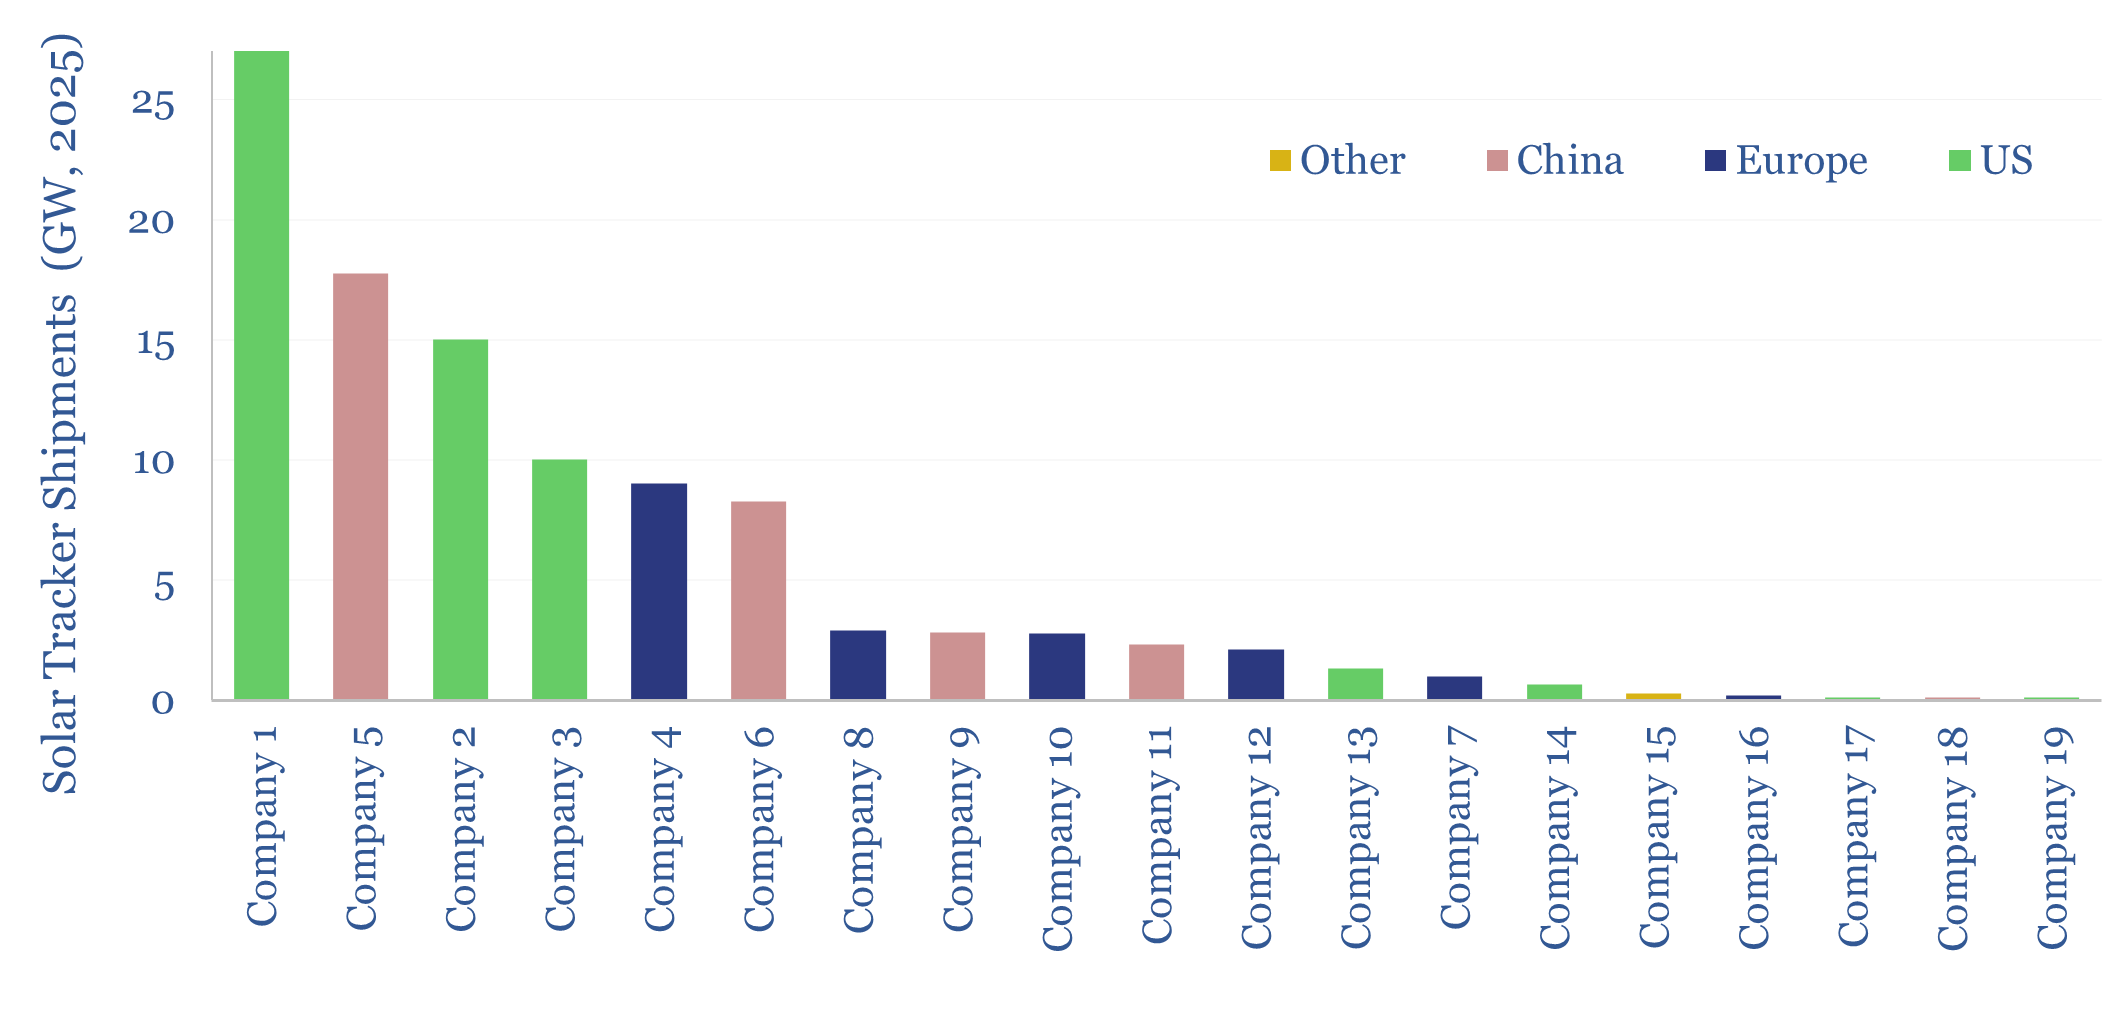
This data-file summarizes the leading companies in solar trackers, their market share, pricing (in $/kW), operating margins (in %), company sizes, sales mixes and recent news flow. Five companies supply 70% of the market, which is worth $10bn pa. But competition is intensifying from East-West dual-tile arrays and within the tracker industry.
Content by Category
- Batteries (96)
- Biofuels (44)
- Carbon Intensity (48)
- CCS (64)
- CO2 Removals (9)
- Coal (41)
- Commentary (65)
- Company Diligence (104)
- Data Models (921)
- Decarbonization (162)
- Demand (129)
- Digital (86)
- Downstream (47)
- Economic Model (220)
- Energy Efficiency (76)
- Hydrogen (63)
- Industry Data (308)
- LNG (56)
- Materials (86)
- Metals (88)
- Midstream (45)
- Natural Gas (161)
- Nature (76)
- Nuclear (28)
- Oil (175)
- Patents (39)
- Plastics (44)
- Power Grids (155)
- Renewables (153)
- Screen (137)
- Semiconductors (35)
- Shale (58)
- Solar (72)
- Supply-Demand (53)
- Vehicles (95)
- Video (24)
- Wind (47)
- Written Research (406)