-
China coal production costs?
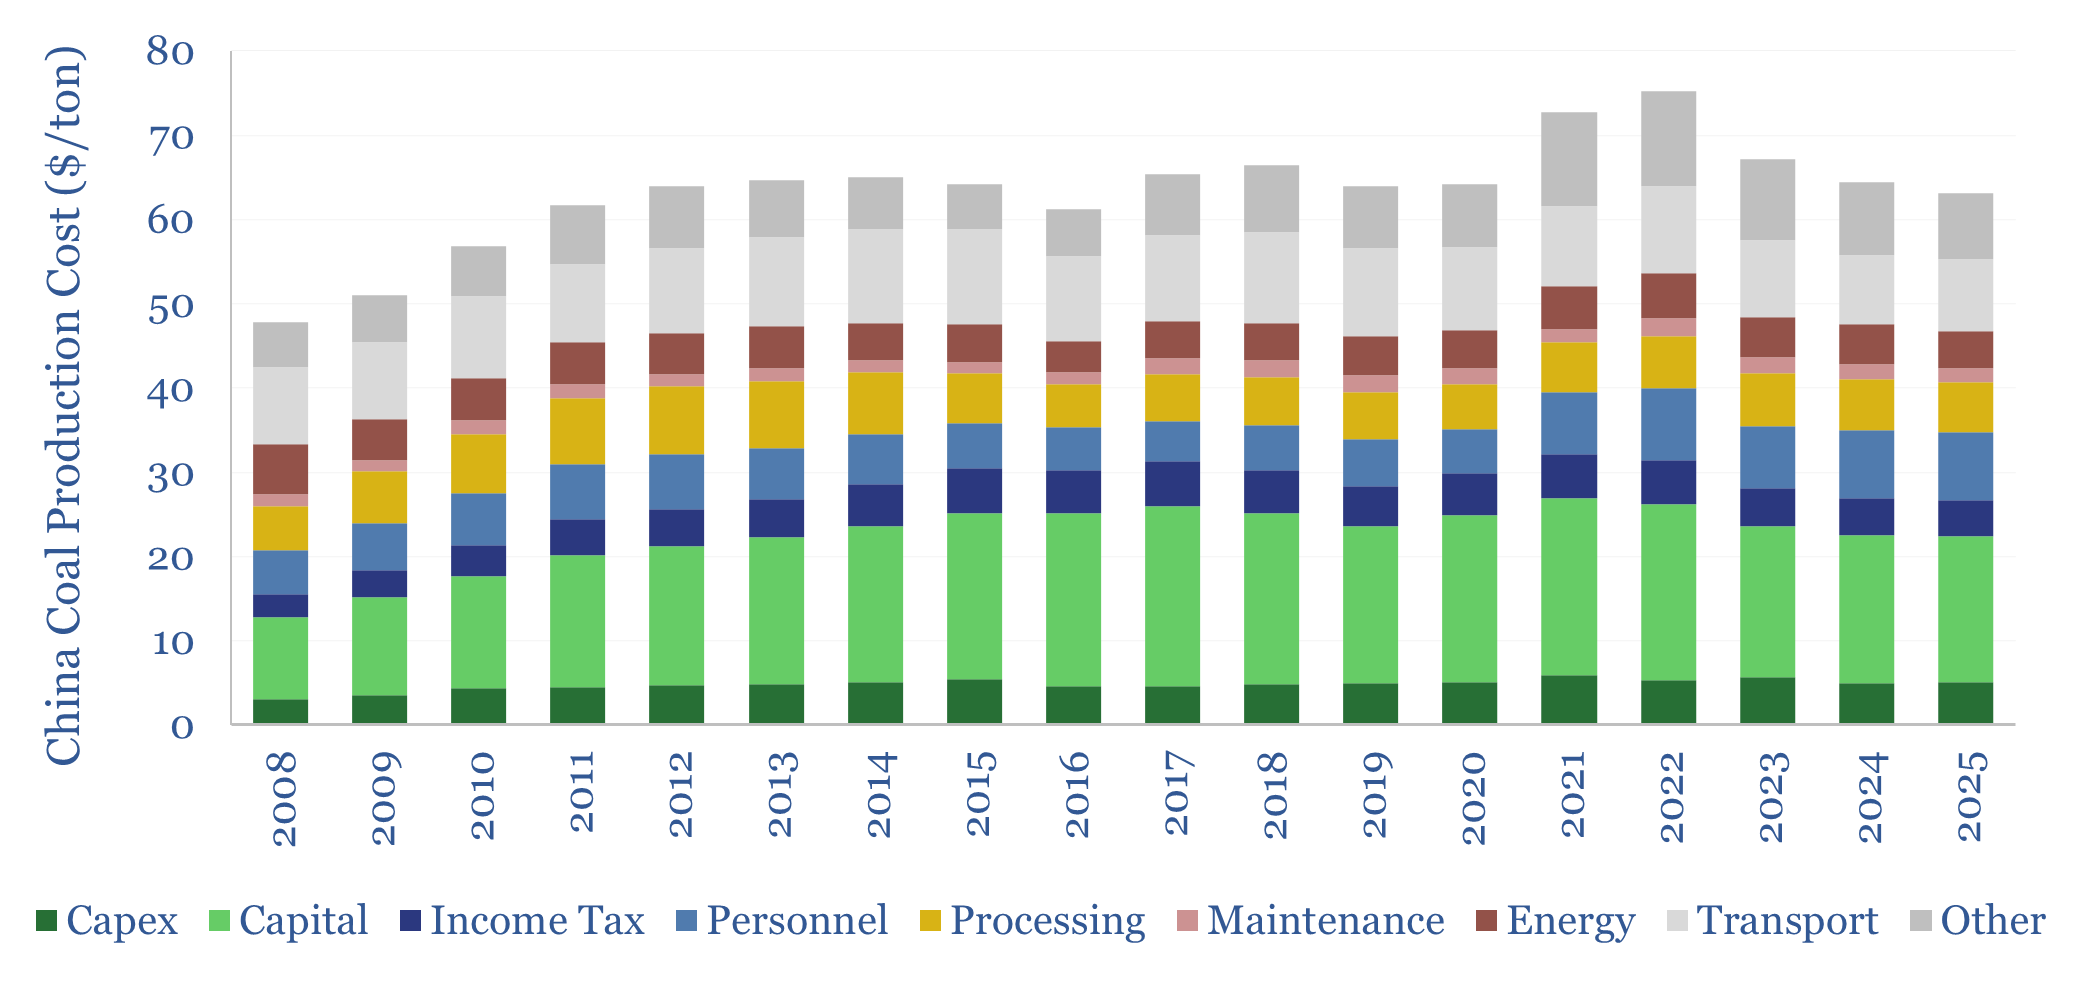
China coal production costs are estimated on a full-cycle basis in this data-file, averaging $65/ton across large, listed miners, with assets in Shanxi, Inner Mongolia and Shaanxi, and 1.5-2x higher again for smaller regional prices. The costs had been increasing at $1.3/ton/year through 2023, but moderated in 2024-25. But could marginal Chinese coal prices hit…
-
Schlumberger: AI and machine learning patents?
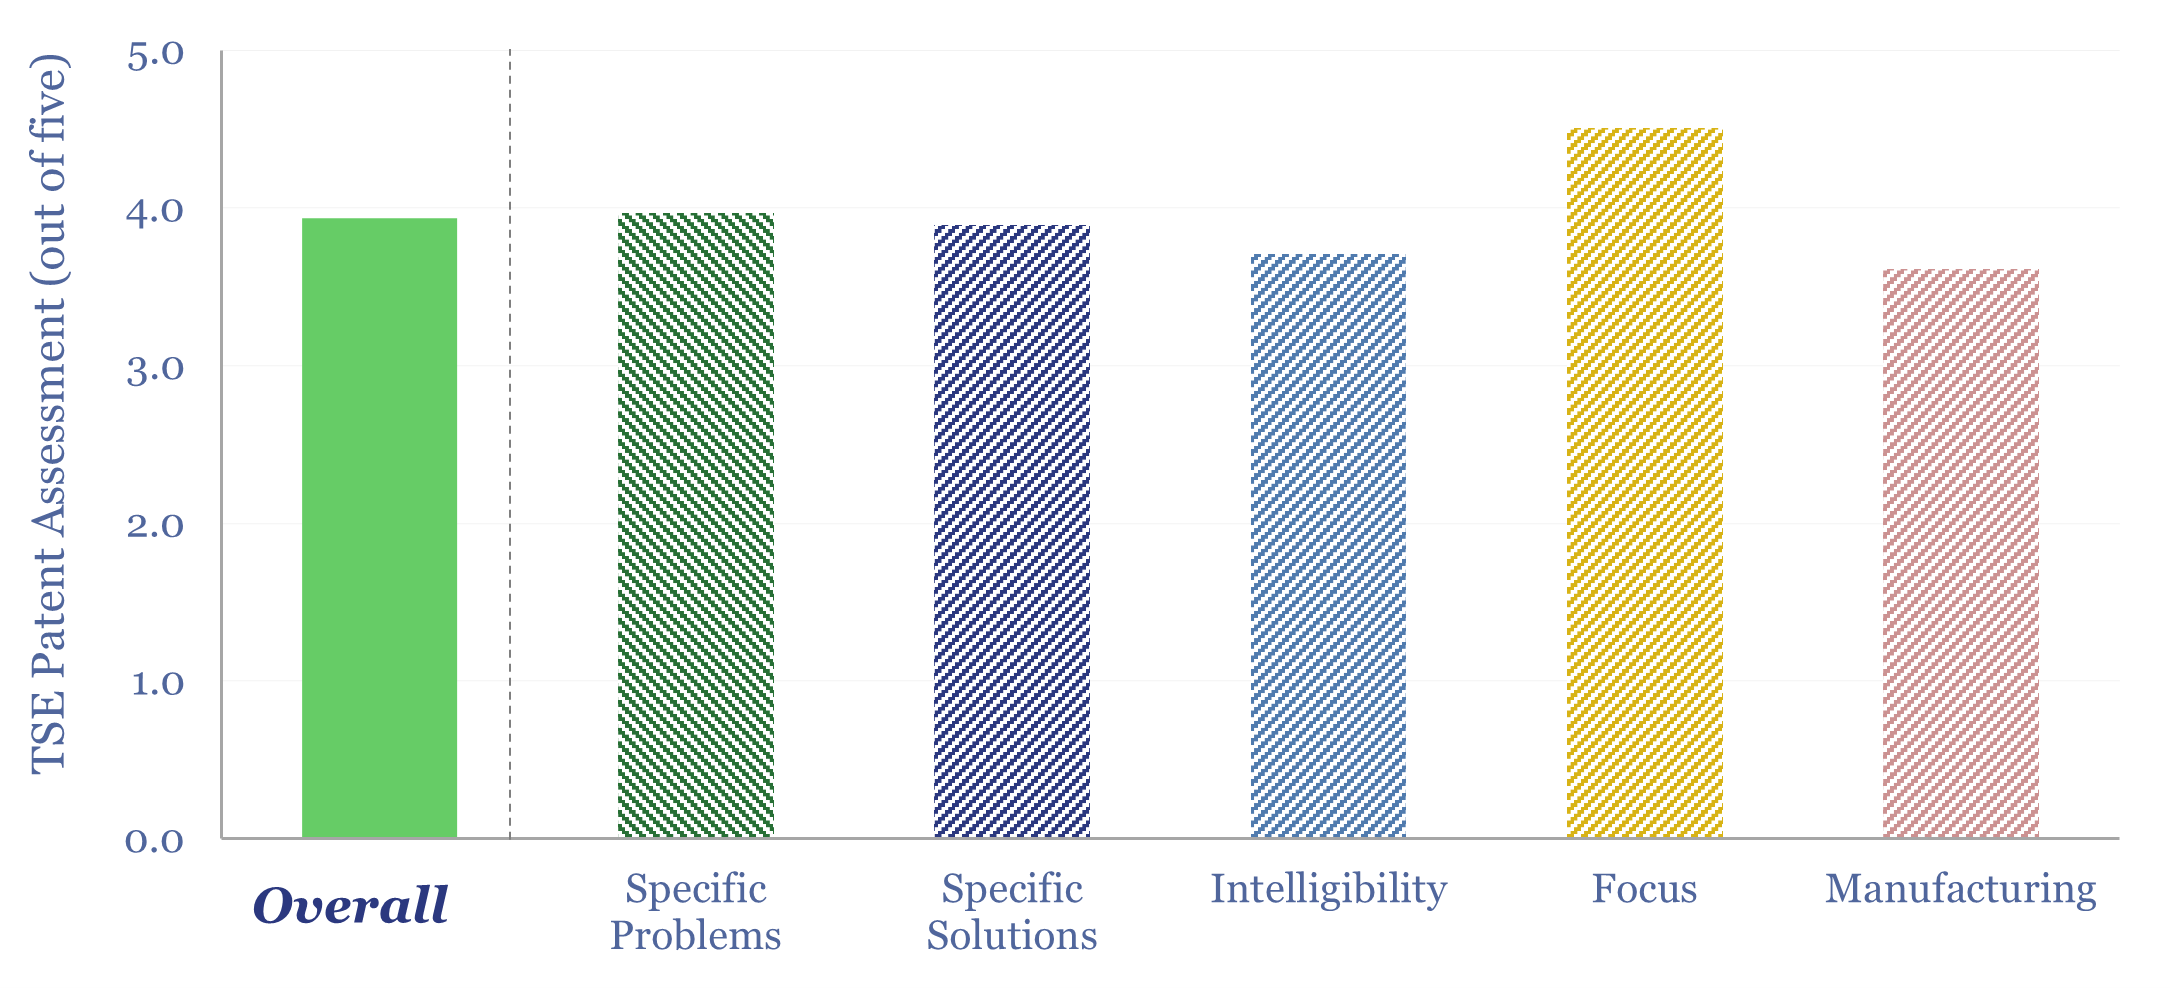
We have screened 65 Schlumberger AI and machine learning patents, filed in 2024-25. This is more than any other energy company. We expect AI to improve shale well productivity, entrench the reliance on Schlumberger tools and services, while also reducing costs, labor, time and net energy use in oil and gas.
-
Oil price elasticity of demand: how high can oil prices go?
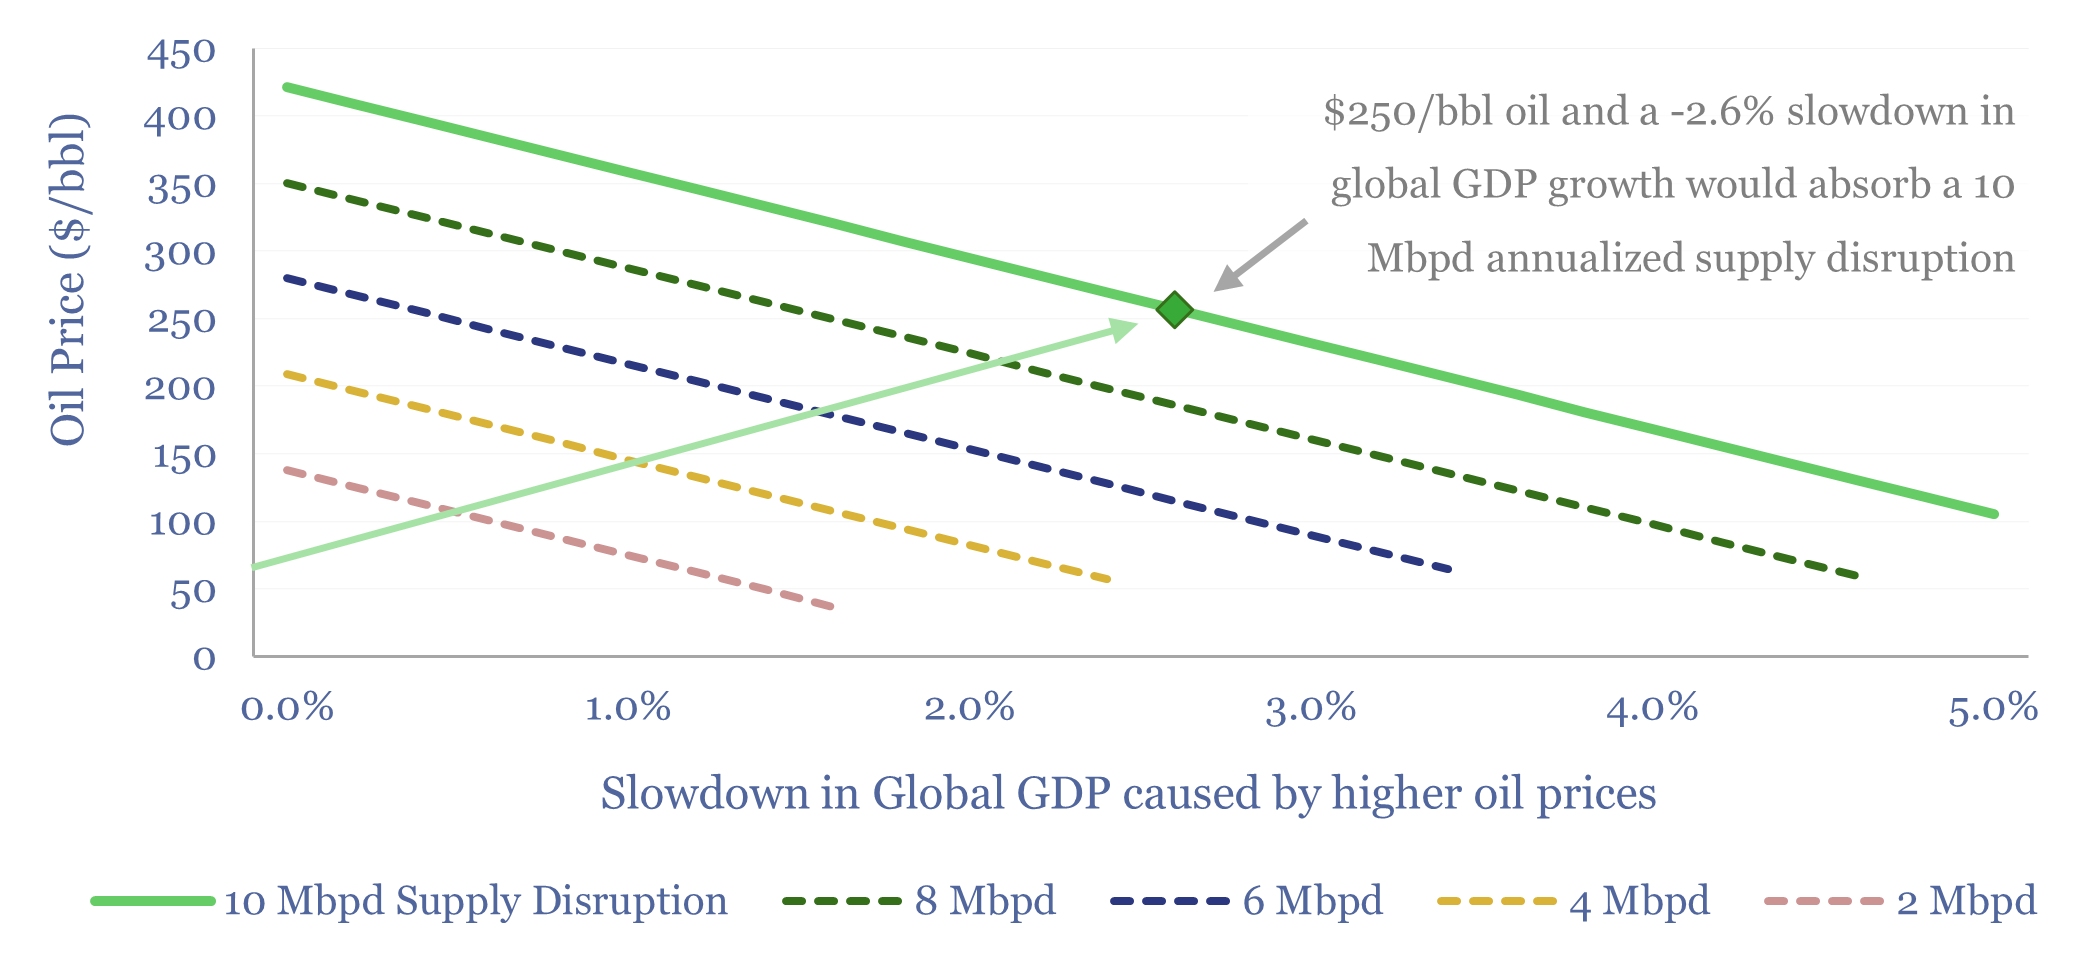
What is the price elasticity of oil demand — globally, by region, and by product? This 11-page report argues that a supply disruption of 10-20Mbpd magnitude, lasting for 6-12 months, pushes oil above $250/bbl, and also zeroes global GDP growth. Rationing and solar/EV substitution may cushion the impact.
-
Exploration capex: long-term spending from Oil Majors?
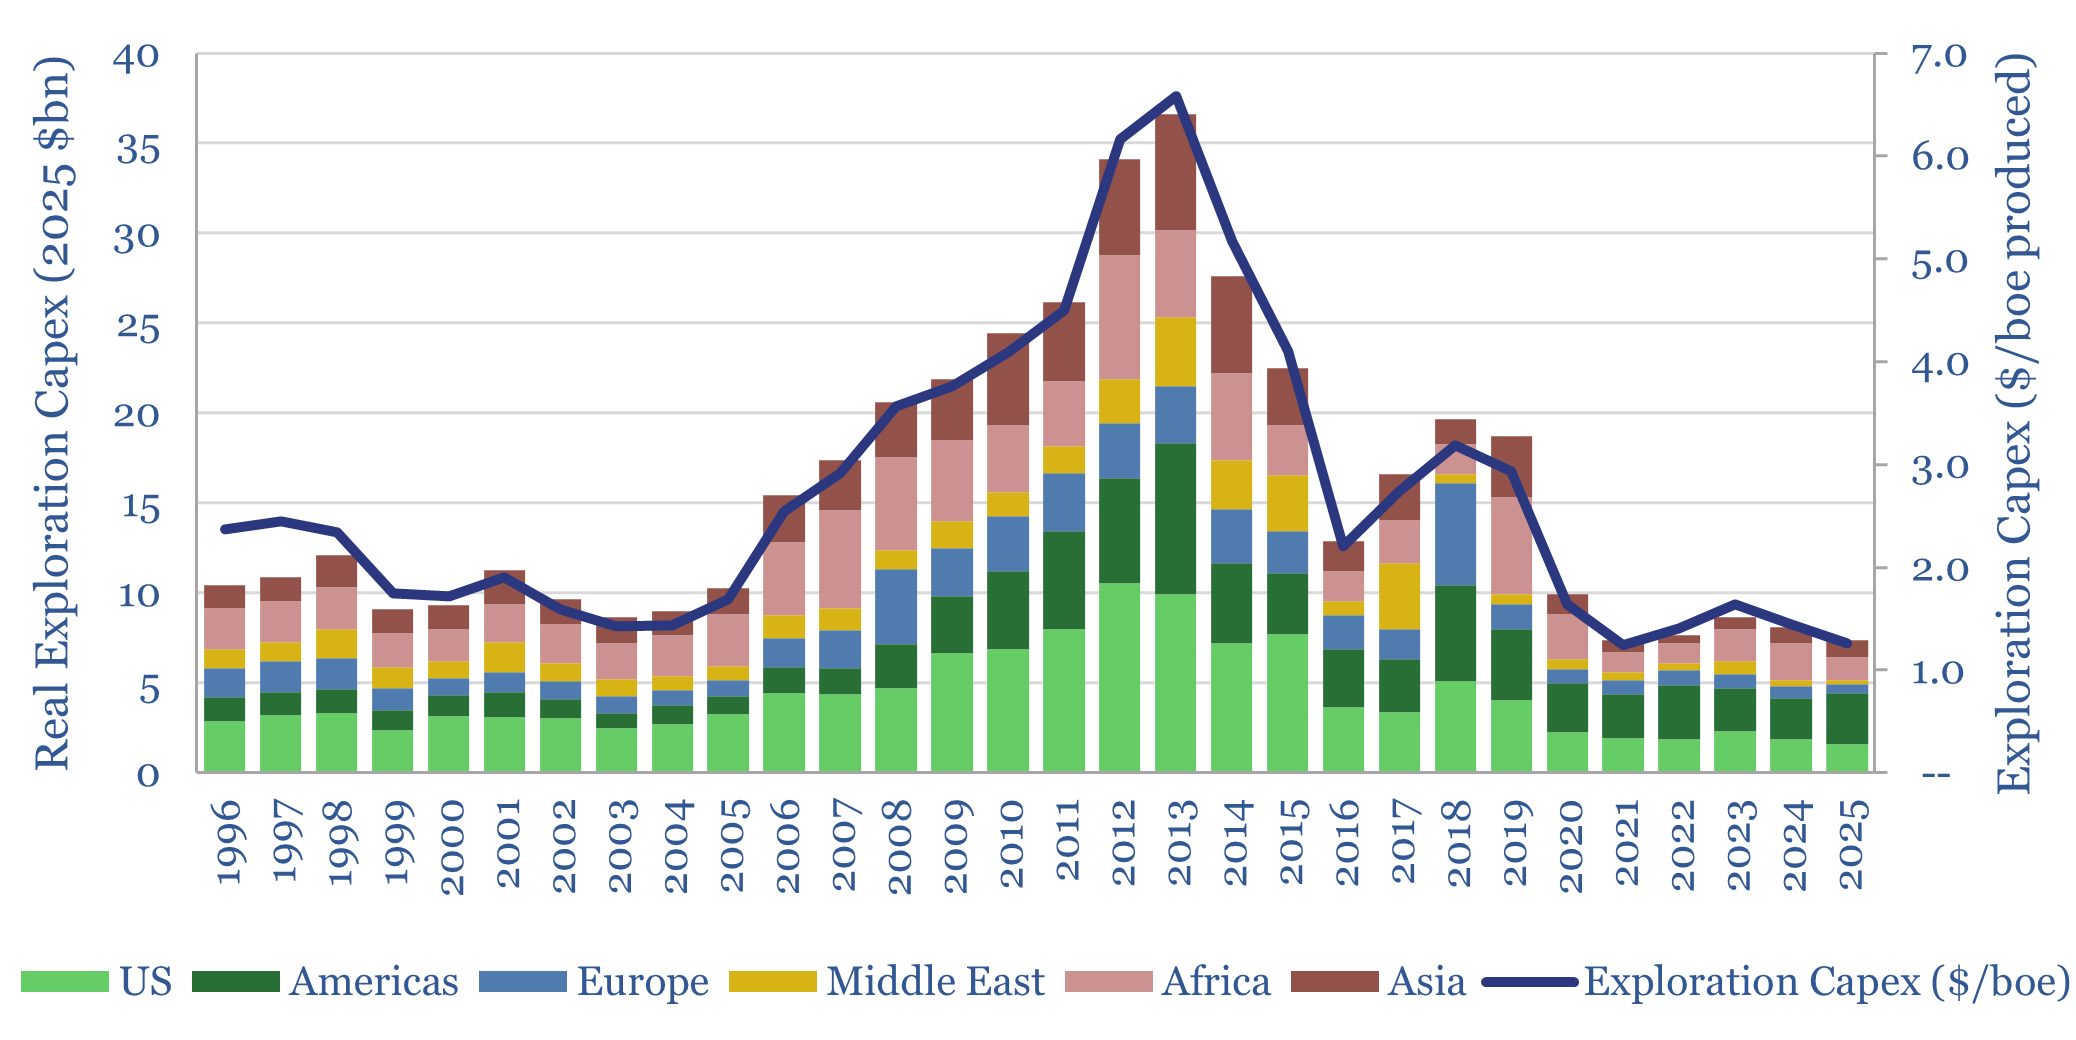
This data-file tabulates the Oil Majors’ exploration capex from the mid-1990s, in headline terms (in billions of dollars) and in per-barrel terms (in $/boe of production). Exploration spending quadrupled from $1/boe in 1995-2005 to $4/boe in 2005-19, and has since collapsed like a warm Easter Egg. Exploration has been de-prioritized. Perhaps wrongly?
-
Aixtron: power GaN MOCVD technology?

Aixtron has a market leading position in GaN MOCVD technology, which is increasingly used in the power electronics of data centers, solar and EVs. This data-file assesses 20 patents from Aixtron and Veeco, to unpack how GaN MOCVD works, what are the key challenges, and to quantify Aixtron’s potential moat.
-
Development capex: long-term spending from Oil Majors?

This data-file tabulates the five ‘Big Oil’ Super-Majors’ development capex from the mid-1990s, in headline terms (billions of dollars) and in per-barrel terms ($/boe of production). Real development capex quadrupled from $6/boe in 1995-2000 to $24/boe in 2010-15, collapsed to $10/boe, then recovered to $13.5/boe.
-
Global oil demand: breakdown by product by country?
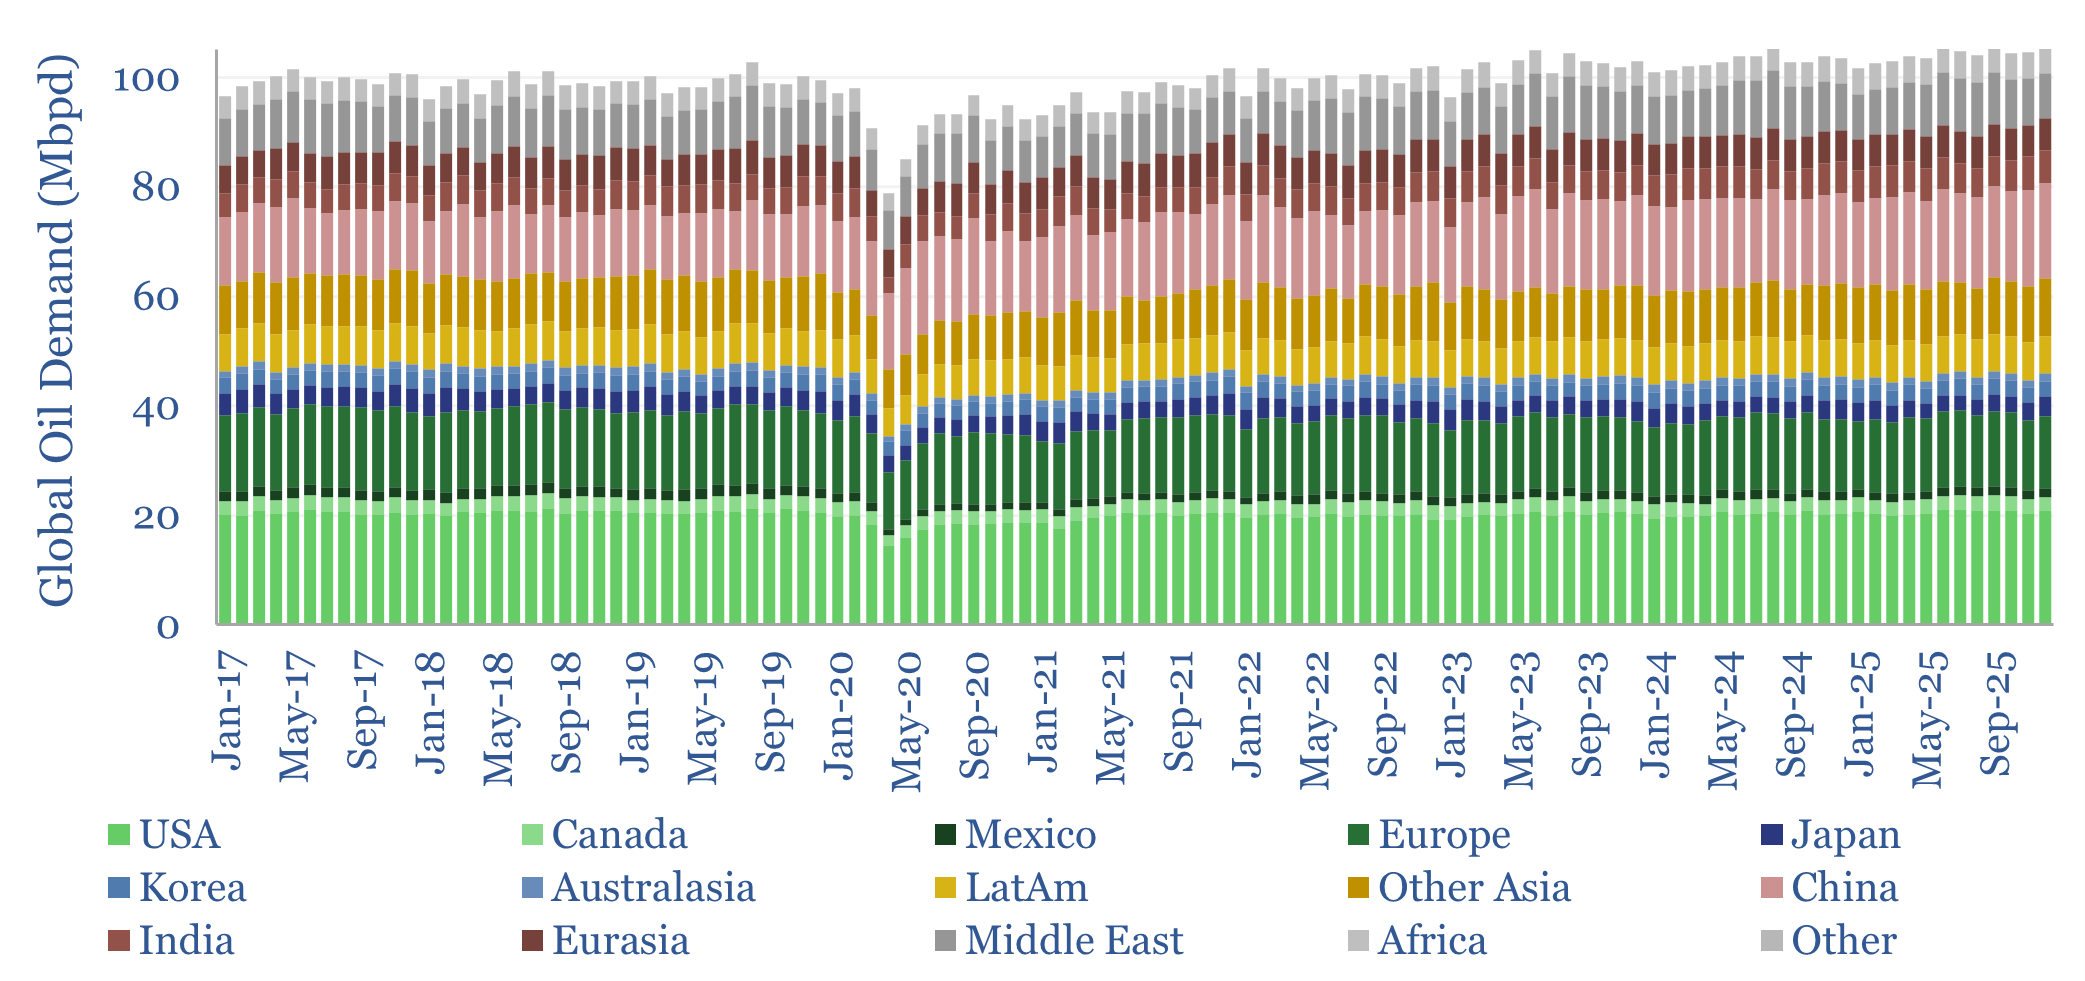
This data-file breaks down global oil demand, country-by-country, product-by-product, month-by-month, across 2017-2025. Global oil demand ran at 104 Mbpd in 2025, for +1.0 Mbpd of growth. For perspective, global oil demand rose at +1.2Mbpd per year in the 30-years from 1989->2019, so there is not much evidence, on face value, that “peak oil is nigh”.
-
Global commodity demand: sensitivity to GDP?
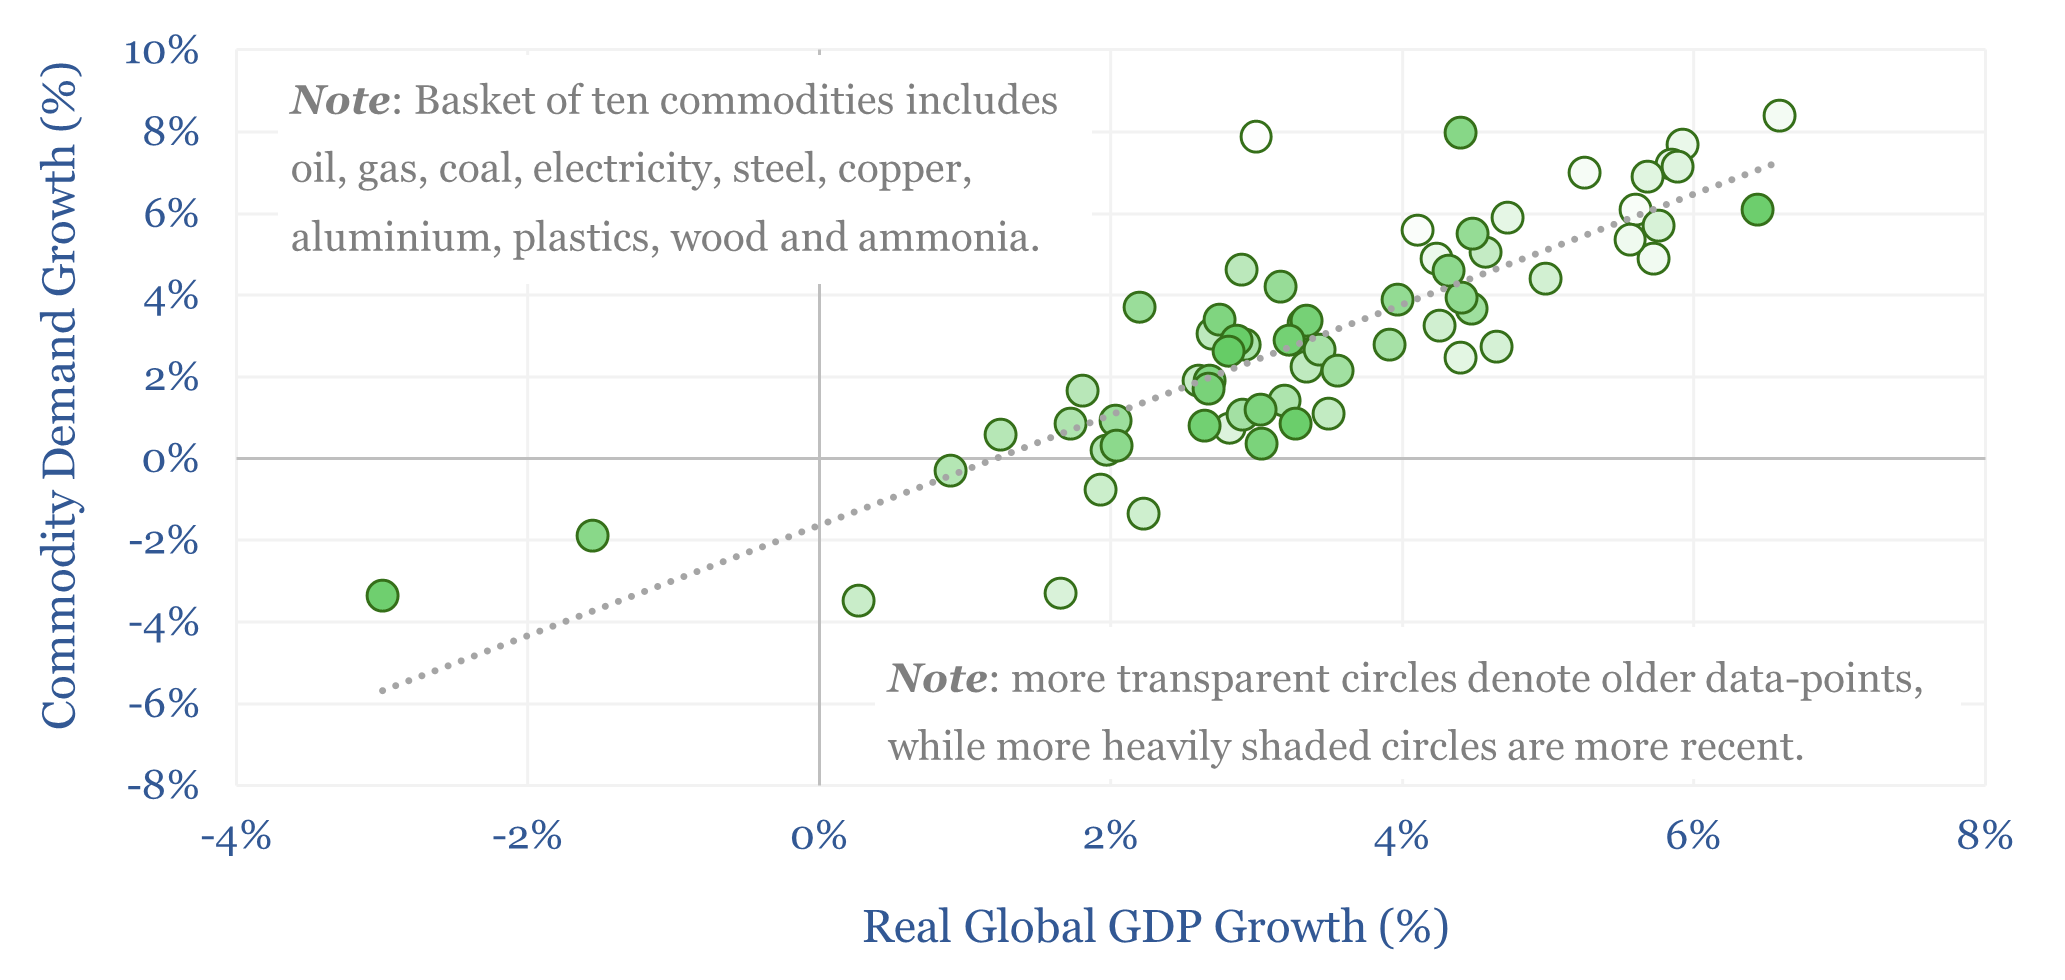
Global commodity demand is levered to GDP. Specifically, for each +/- 1% acceleration or deceleration in global GDP, commodity demand tends to accelerate or decelerate by +/- 1.4%, with a 70% R-squared, across 25 examples that are indexed in this data-file. Oil demand sensitivity to GDP is particularly interesting.
-
Wind turbine manufacturers: market share over time?
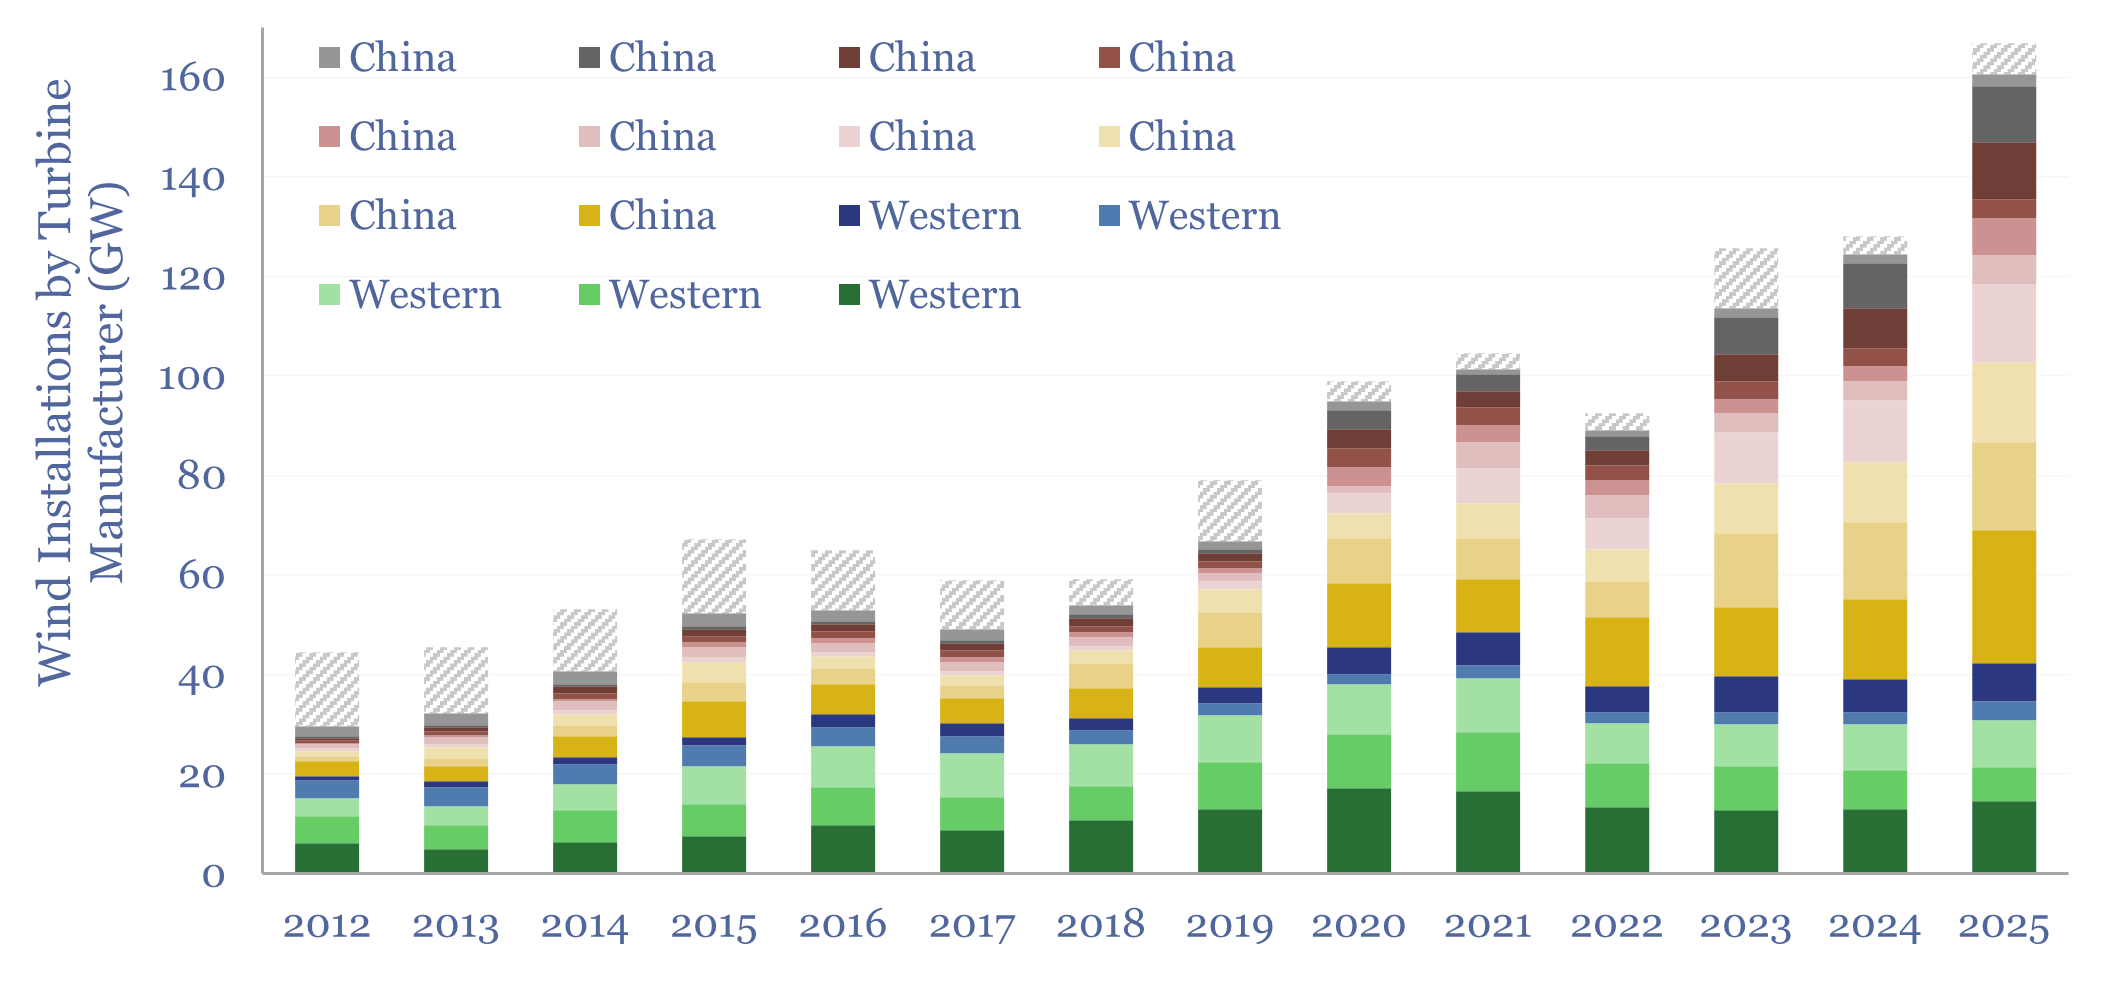
This data-file tracks wind turbine manufacturers, their market shares and their margins over time. By 2025, fifteen companies account for 95% of global wind turbine installations. This includes large Western incumbents, and a growing share for Chinese entrants, which now comprise 70% of the total market, with phenomenal growth in 2025 and continued low selling…
-
Marcellus shale: well by well production database?

This data-file tracks Marcellus shale well productivity, by tabulating the monthly output from 13,000 wells across the Pennsylvania Marcellus, from 2015 to mid-2024. Average IP rates across the basin have risen at a 12% pa CAGR, from around 5 mmcfd in 2015 to 18 mmcfd in 2025. However, activity and productivity differ starkly by operator.
Content by Category
- Batteries (96)
- Biofuels (44)
- Carbon Intensity (48)
- CCS (64)
- CO2 Removals (9)
- Coal (41)
- Commentary (65)
- Company Diligence (104)
- Data Models (921)
- Decarbonization (162)
- Demand (129)
- Digital (86)
- Downstream (47)
- Economic Model (220)
- Energy Efficiency (76)
- Hydrogen (63)
- Industry Data (308)
- LNG (56)
- Materials (86)
- Metals (88)
- Midstream (45)
- Natural Gas (161)
- Nature (76)
- Nuclear (28)
- Oil (175)
- Patents (39)
- Plastics (44)
- Power Grids (155)
- Renewables (153)
- Screen (137)
- Semiconductors (35)
- Shale (58)
- Solar (72)
- Supply-Demand (53)
- Vehicles (95)
- Video (24)
- Wind (47)
- Written Research (406)