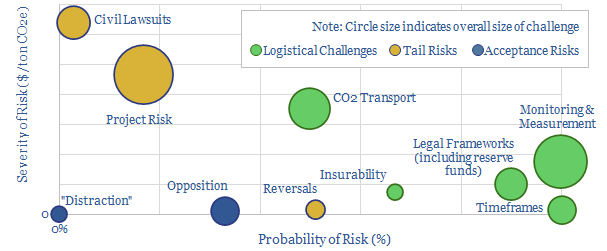
This data-file tabulates the “top ten” challenges for geological storage of CO2, based on reviewing the technical literature. Ten issues stand out, and are explained, with reference to numbers and data-points (chart above).
There is c$8-30/ton of tail-riskfor a CO2 storage operation (depending on risk levels), which may need to be considered when appraising projects.
This mattersas CCS must step up from 40MTpa capacity today to billions of tons per annum in a fully decarbonized energy system. CO2 disposal is also crucial to new CO2 technologies such as CO2-EOR, oxy-combustion, carbonate fuel cells, metal organic frameworks and direct air capture.
Measuring and monitoring CO2is one of the largest challenges, hence our data-file also summarized 25 technologies used for this purpose.
Finally, we contrast CCS to Nature Based Solutions. For of the main challenge to nature based solutions also apply to CCS. Four risks also apply to each but not the other. This suggests a complementary balance of CCS and NBS will be needed.
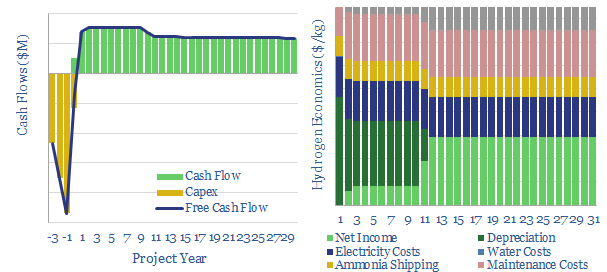
This data-file models the costsof converting green hydrogen into ammonia, transporting the ammonia in an LPG tanker, then converting the ammonia back into hydrogen through ammonia cracking.
We model what hydrogen price is required, (in $/kg), to earn a 10% IRR on the investment, the energy intensity of the process (in kWH/kg) and the overall energy efficiency (in %), based on technical papers and recent guidance from Air Products (which aims to start up a 230kTpa project in 2025).
With some generous assumptions, a large-scale green hydrogen and ammonia value chain may be able to reach consumers in developed world countries at a cost of $10/kg, although this looks ambitious, and additional costs may be incurred or returns may be diluted.
For comparison, the final two tabs of the model also test a more promising pathway, using Toluene-methylcyclohexane as a hydrogen carrier, including our top seven conclusions.
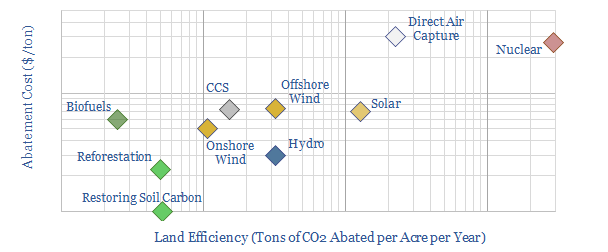
This data-file compares the land space required by different energy transition technologies, in tons of CO2-equivalents abated per acre per year. The data are sourced from technical papers and our broader work.
Costs are 65% correlatedwith land efficiency, in turn, because both metrics tends correlate with capital intensity. Both metrics are compared in the chart above (note the axes are logarithmic).
The data show an economic decarbonization is possible in a typical developed world country but it could use up 20-50% of available land. Energy transition may be more expensive in smaller countries with less land.
Covered technologiesinclude biofuels, reforestation, restoring soil carbon, carbon capture and storage, onshore wind, offshore wind, solar, hydro power, direct air capture and nuclear.
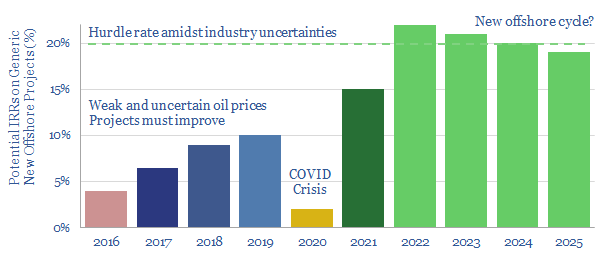
Oil markets look primed for a new up-cycle by 2022, which could culminate in Brent surpassing $80/bbl. This is sufficient to unlock 20% IRRs on the next generation of offshore projects, and thus excite another cycle of offshore exploration and development. Beneficiaries include the technology leaders among offshore producers, subsea services, plus more operationally levered offshore oil services. The idea is laid out in our 17-page note.
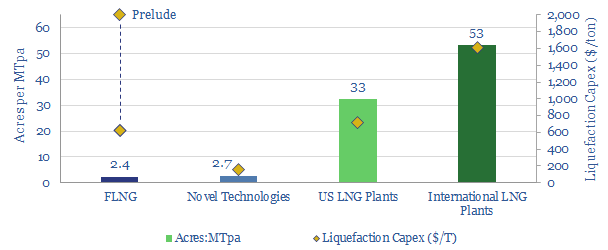
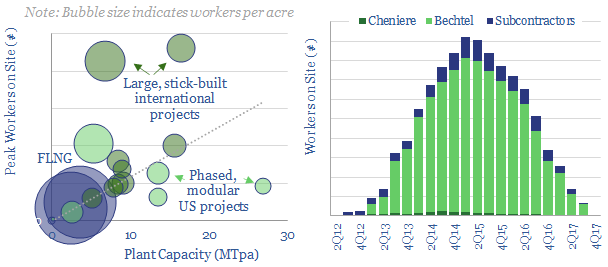
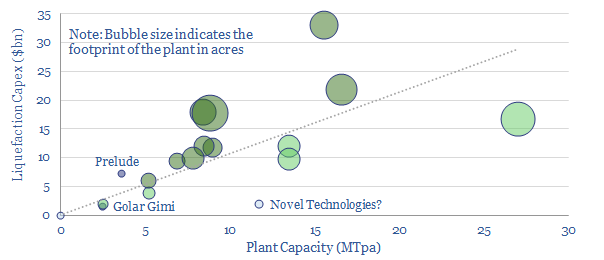
This data filetabulates the acreage footprints and peak worker counts at c20 recent LNG projects. It is interesting how these variables are likely to change over time, to lower costs and due to COVID.
International LNG occupies c50-acres per MTpa and 1,000 peak workers per MTpa of capacity. This means that largest facilities can have over 20,000 workers on site at any one time, which will be challenging amidst COVID.
US LNGprojects have been smaller, at c30-acres per MTpa, as high-quality input gas requires less pre-processing; and worker counts are as much as 4x lower, due to phased, modular construction designs (see below).
FLNG is c20x more compact than typical international projects but and has the highest density of workers. Modules which typically have large exclusion zones are congested. This will require extremely cautious operation. It could impact economics, through higher costs and lower up-times.
In principle, smaller plants should achieve cost advantages over larger plants. To reap these benefits, we are excited by novel “liquefaction” technologies, which are also tabulated in the file.
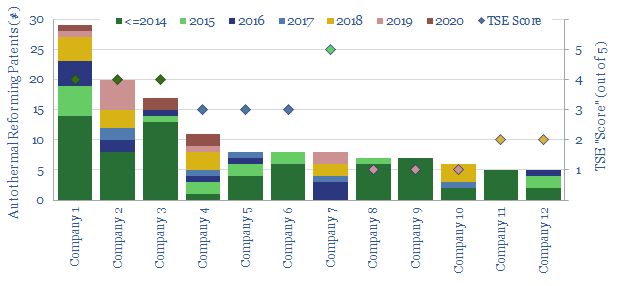
The aim of this data-fileis to assess who has the leading technology for producing industrial hydrogen: but especially blue hydrogen from auto-thermal reformers, which was highlighted as an opportunity in our recent research note.
Our screen assesses the leading companies making reformers to produce industrial hydrogen, based on public disclosures, 750 patents, and classifying these patents into their consituent patent families.
Profiled companiesinclude Air Liquide, Air Products, Casale, Haldor Topsoe, Johnson Matthey, KBR, Linde, Thyssenkrupp and over a dozen large, diversified energy companies.
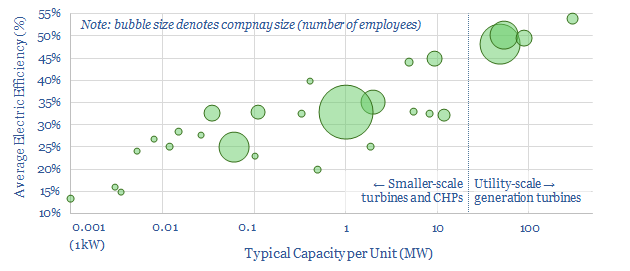
The aim of this data-file is to profile thirty leading companies in gas turbines and smaller-scale CHPs, based on their disclosures and patent filings. In each case, we describe the company, its size, its patent filings, its typical turbine size and efficiency.
Covered gas turbine companiesinclude mega-caps such as GE, Siemens, Mitsubishi and Ansaldo down to small-caps and private companies with exciting novel technologies.
But the capital goods giants noted above dominate the market and account for the majority of world-scale turbines, as well as variations of these open-cycle turbines that are used in jet engines.
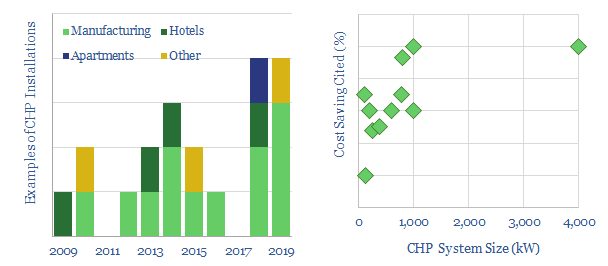
Case studies from one such company, commercializing small, combined heat and power turbines, are presented in a backup tab, showing operational disclosures on cost savings, energy savings, CO2 reductions, payback periods and motivations for adopting the system.
A recent trend has been exploring smaller-scale turbines with integrated CHPs. Although please email us if you would like to discuss some of these gas turbine companies, as we have some perspectives on costs and waste heat recovery from following this space.
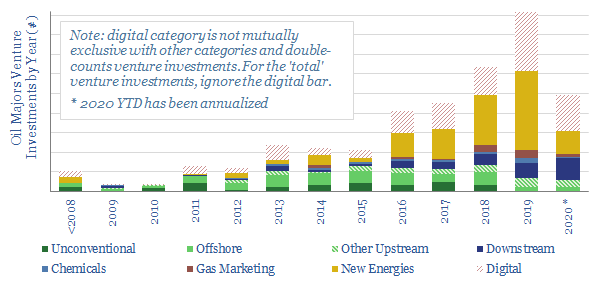
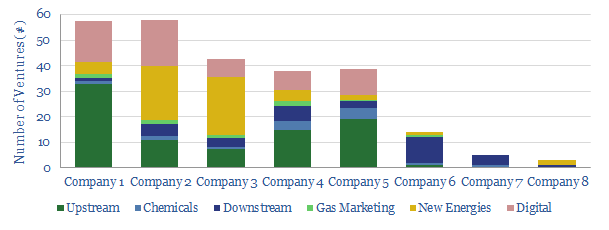
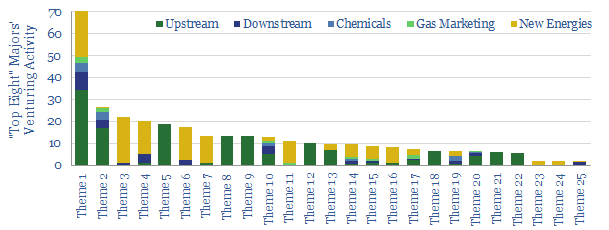
This database tabulates almost 300 venture investmentsmade by 9 of the leading Oil Majors, as the energy industry advances and transitions.
The largest portionof activity is now aimed at incubating New Energy technologies (c50% of the investments), as might be expected. Conversely, when we first created the data-file, in early-2019, the lion’s share of historical investments were in upstream technologies (c40% of the total). The investments are also highly digital (c40% of the total).
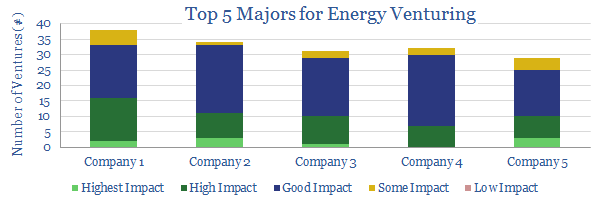
Four Oil Majors are incubating capabilitiesin new energies, as the energy system evolves. We are impressed by the opportunities they have accessed. Venturing is likely the right model to create most value in this fast-evolving space.
The full databaseshows which topic areas are most actively targeted by the Majors’ venturing, broken down across 25 sub-categories, including by company. We also chart which companies have gained stakes in the most interesting start-ups.
We have modelled the full-cycle economics of a green hydrogen value chain to decarbonize trucks. In Europe, at $6/gallon diesel prices, hydrogen trucks will be 30% more expensive in the 2020s. They could be cost-competitive by the 2040s. But the numbers are generous and logistical challenges remain. Green hydrogen trucks will most likely find adoption in niche applications, competing with other technologies, rather than as a wholesale shift to a hydrogen economy.
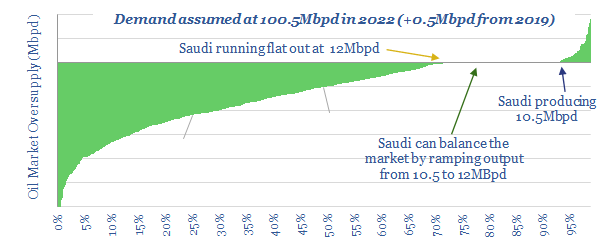
2022 oil markets now look 2Mbpd under-supplied, portending another industry up-cycle. 1.5bn bbls of excess inventories from the COVID crisis have likely been drained by early-2021, allowing OPEC to ramp back fully from production cuts by mid-2021. Yet this year’s disruption to shale and across the wider industry will drain a further 2.5bn bbls from inventories by mid-2023. It takes until 2024 for oil markets to re-balance. Inventories remain historically low until late in the decade.
This 4-page notemakes the case for the next oil industry up-cycle, with a one-page summary of our thesis, plus three pages of charts covering market balances, demand, shale, other supply, inventories and our Monte Carlo analysis. The underlying models are available here for TSE clients.
Cookies?
This website uses necessary cookies. Our cookies are simply to improve your experience. We do not undertake any advertising or targeting via our cookies. By clicking 'accept' or continuing to use the website, you consent to our use of cookies.AcceptRead More
Privacy & Cookies Policy
Privacy Overview
This website uses cookies to improve your experience while you navigate through the website. Out of these, the cookies that are categorized as necessary are stored on your browser as they are essential for the working of basic functionalities of the website. We also use third-party cookies that help us analyze and understand how you use this website. These cookies will be stored in your browser only with your consent. You also have the option to opt-out of these cookies. But opting out of some of these cookies may affect your browsing experience.
Necessary cookies are absolutely essential for the website to function properly. This category only includes cookies that ensures basic functionalities and security features of the website. These cookies do not store any personal information.
Any cookies that may not be particularly necessary for the website to function and is used specifically to collect user personal data via analytics, ads, other embedded contents are termed as non-necessary cookies. It is mandatory to procure user consent prior to running these cookies on your website.