This model captures the costs of storing hydrogen, which appear to be much higher than storing natural gas or diesel fuel.
We estimate a $2.50/kg storage spread may be needed to earn a 10% IRR on a $500/kg storage facility, while costs could be deflated to $0.5/kg if nearby salt caverns are available and projects are large and efficient.
Costs could also be deflated modestly at a high-utilization but low-speed vehicle fuelling station, in the transportation sector.
The model hinges on costs of tanks and compressors, where costs are bounded based on technical papers and online sources. Detailed notes and input data are tabulated in backup tabs behind the model.
Please download the data-file to stress test the economics.
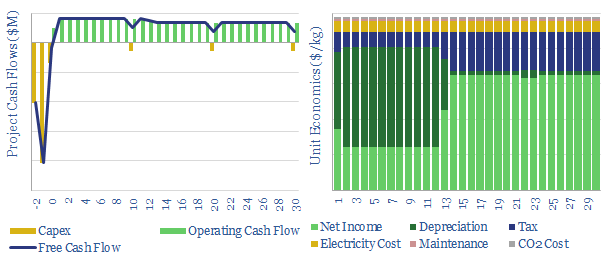
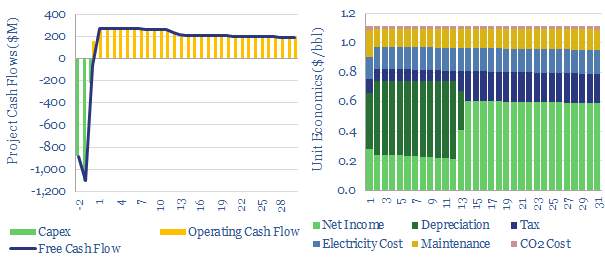
Pipeline costs are modeled in this data-file. $1/bbl is needed to move oil, oil products and other liquid commodities around 500 km at Mbpd scale, and the energy requirements are around 2.1 kWh/bbl, emitting 0.8 kg/bbl of CO2. Economics of scale matter. As a rule of thumb, costs rise by 100% when volumes fall by 50%.
This model captures the energy economics of a pipeline carrying oil, oil products, chemical feedstocks, water or debatably, super-critical CO2 (once it is already super-critical). Although note that gas-phase flows are captured in our gas pipeline model, as the physics are very different (gases are compressible).
Our base case model covers a large, 1-meter pipeline, carrying 1Mbpd of light crude oil c500km and sees a $1/bbl pipeline tariff needed to generate a 10% unlevered IRR.
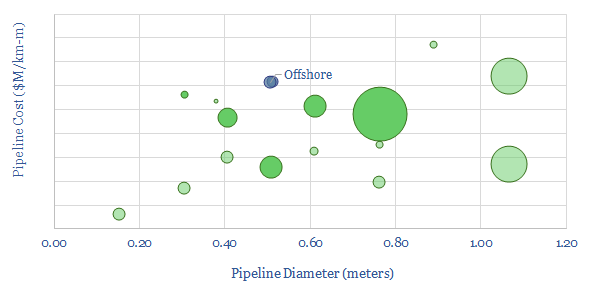
The largest cost in a pipeline is capex. A good rule of thumb is that a pipeline will cost $1-2M per km, but it varies depending on the pipeline size, location and terrain. Useful underlying data are collated in the data-file, from past projects, to bottom-up studies.
The energy costs of a large pipeline can be approximated at around 0.5 kWh per bbl per 100km, however the physics are broken down in the data-file. The total power requirement is the sum of static head (overcoming gravity) and dynamic head (overcoming friction).
Dynamic head will be the larger contributor to the overall energy consumption of a liquids pipeline, and is a function of velocity^2, 1/pipeline diameter, the ‘smoothness’ of the pipe and the viscosity of the fluid being transported.
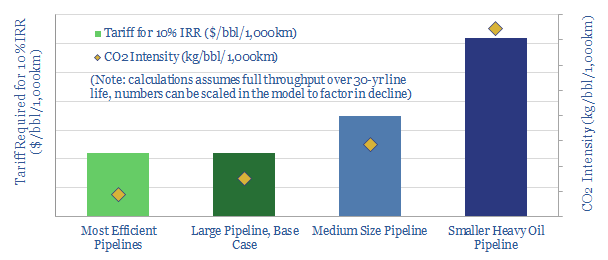
Our conclusionsshow the requisite costs, energy and CO2 intensities of different pipelines (below). Generally wider pipelines, correctly sized, with smooth internal surfaces will be the most energy efficient and have the lowest CO2 intensities.
You can stress test the economicsdirectly in the model, by varying pipeline tariffs, capex costs, energy costs, CO2 prices, maintenance costs, pipeline diameter, pipeline distance, pipeline elevation, pipeline materials, fluid viscosity and pump efficiencies.
All of our research into midstream pipelines is indexed here, while we think the energy transition will bring opportunities to move new projects, including more feedstocks, hydrogen and CO2 for CCS.
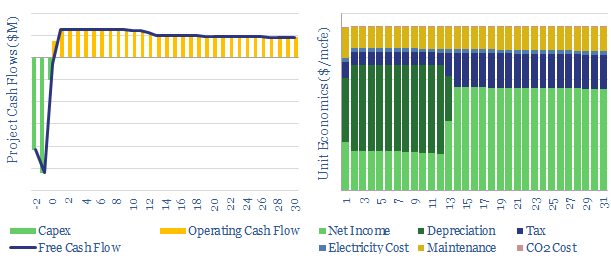
This model captures the energy economics of gas pipelines, CO2 pipelines and hydrogen pipelines. Specifically, we have modelled energy requirements using simple fluid mechanics, and modelled capex costs using past projects and technical papers, which are tabulated in the data-file.
In gas value chains, the midstream industry is responsible for moving natural gas, and possibly also CO2 for CCS and hydrogen: from the place of production, through processing facilities and ultimately to the places of consumption.
This economic model captures pipeline costs as a function of input variables, such as capex costs, pipeline distance, transport volumes, compression energy, energy costs, operating and maintenance costs.
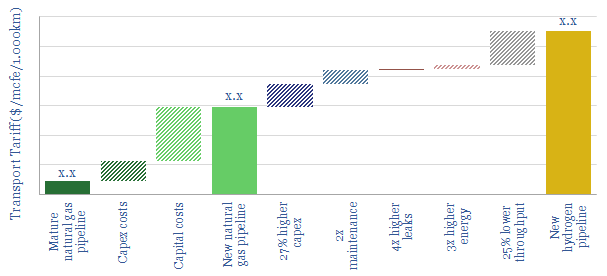
Our conclusionis that new hydrogen pipelines will cost 2x new gas pipelines and 10x existing gas pipelines, per mcf-equivalent of energy transport (chart below), while the CO2 costs of transporting hydrogen are c3x higher.
Unit costs of all pipelines decreaseas a function of their size. This matters particularly for CO2 transport and disposal, where it will be advantageous to enter the industry at scale (chart below). Another variable that matters is the pipeline pressure and compression.
You can stress test the economicsdirectly in the model, by varying pipeline tariffs, capex costs, energy costs, CO2 prices, maintenance costs, pipeline diameter, pipeline distance, pipeline elevation, pipeline materials and compressor efficiencies.
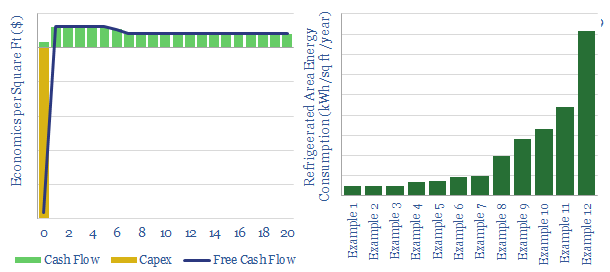
This data-file contains our numbers and analysis into the energy economics of phase change materials: an emerging class of materials, which can store and release heat by changing from solid to liquid phases. PCMs have potential to improve efficiency by c20% in cold storage at attractive IRRs.
The file includes the economics of fitting PCMs into cold storage facilities, the typical energy consumption of cold storage facilities (industrial fridges and freezers), further illustrations of the technology and how it can lower refrigeration intensity.
Our recent research note into phase change materials is linked here.
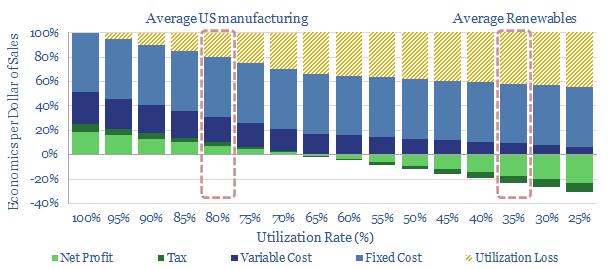
This data-file quantifies utilization rates by industry, which tend to average 80-90%, especially in manufacturing and materials contexts. The highest utilization rates are found in oil and gas, refineries, mining, chemicals and metals facilities. This is not always entirely consistent with being fully powered by volatile wind and solar.
Renewables will ramp up to 25% of global energy consumption by 2050, on our models for a fully decarbonized energy system. This is a vast achievement. But many commentators ask why renewables’ share is not higher. One reason is that renewables operate at low utilization rates (around 15-45% of installed capacity) and are volatile, while industrial demand requires higher utilization rates.
This data-file tabulates the utilization rates of different industries over time, based on a variety of data sources. Average US manufacturing utilization rates ran at almost 80% prior to the COVID crisis, to sustain c10-20% operating margins, with many commoditized industries running above 90%.
On average, US industry has run at 77% capacity utilization since 2005 (74% for durable, 76% for non-durable), although this includes recession times, such as during 2020’s COVID crisis, when aggregate industrial utilization rates fell to as low as 55%. Useful month-by-month data on the utilization of different industries is avaiable from the St Louid FED.
Utilization matters. A 5pp reduction in utilization rates (e.g., due to over-reliance on volatile renewables) could cut manufacturing profits by 35%. At 35% utilization, no manufacturing facility with >20% fixed costs is likely to turn a profit. This matters as manufacturing industries comprised $2.4trn of US GDP in 2019 (11% of the total) and c25% of energy consumption.
Falling utilization rates also underpin a levelized cost paradox for renewables. Our favorite method to backstop the volatility of renewables is via demand shifting, which will help relative margins in industries with flexible power demand (our best note, looking across different industries, is linked here).
To stress test the utilization rates of different industries, and the impact on their economics, we have also constructed 175 economic models, across all of our research to date, available here.
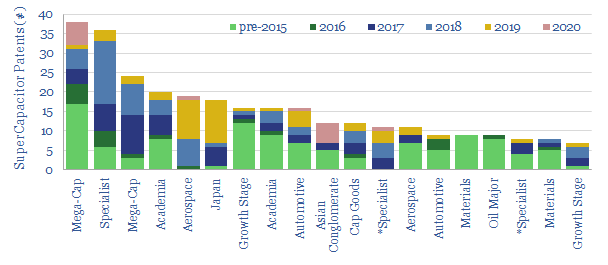
Supercapacitors may eclipse lithium ion batteries in the hybridization of transport and industry. Their energy density is improving. Potential CO2 savings could surpass 1bn tons per year. IRRs of 10-50% can be achieved, even prior to CO2 prices. These are our conclusions after reviewing 2,000 Western patents. GE, Siemens, Skeleton and ZapGo are among the leading companies exposed to the theme.
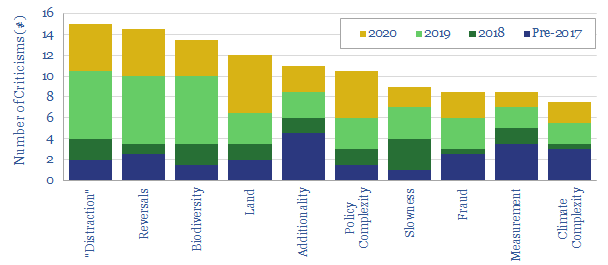
The aim of this data-file is to tabulate the criticisms of carbon offsetting through nature based solutions such as reforestation.
The full database contains over 100 criticisms, summarized through quotes and paraphrasings, which we have encountered in our communications, in technical papers and in press articles.
We have collated the criticisms into ten main categories, which are ranked by year and summarized in the data-file (chart above). We argue these challenges can be overcome and remain constructive on carbon offsets using nature based solutions.
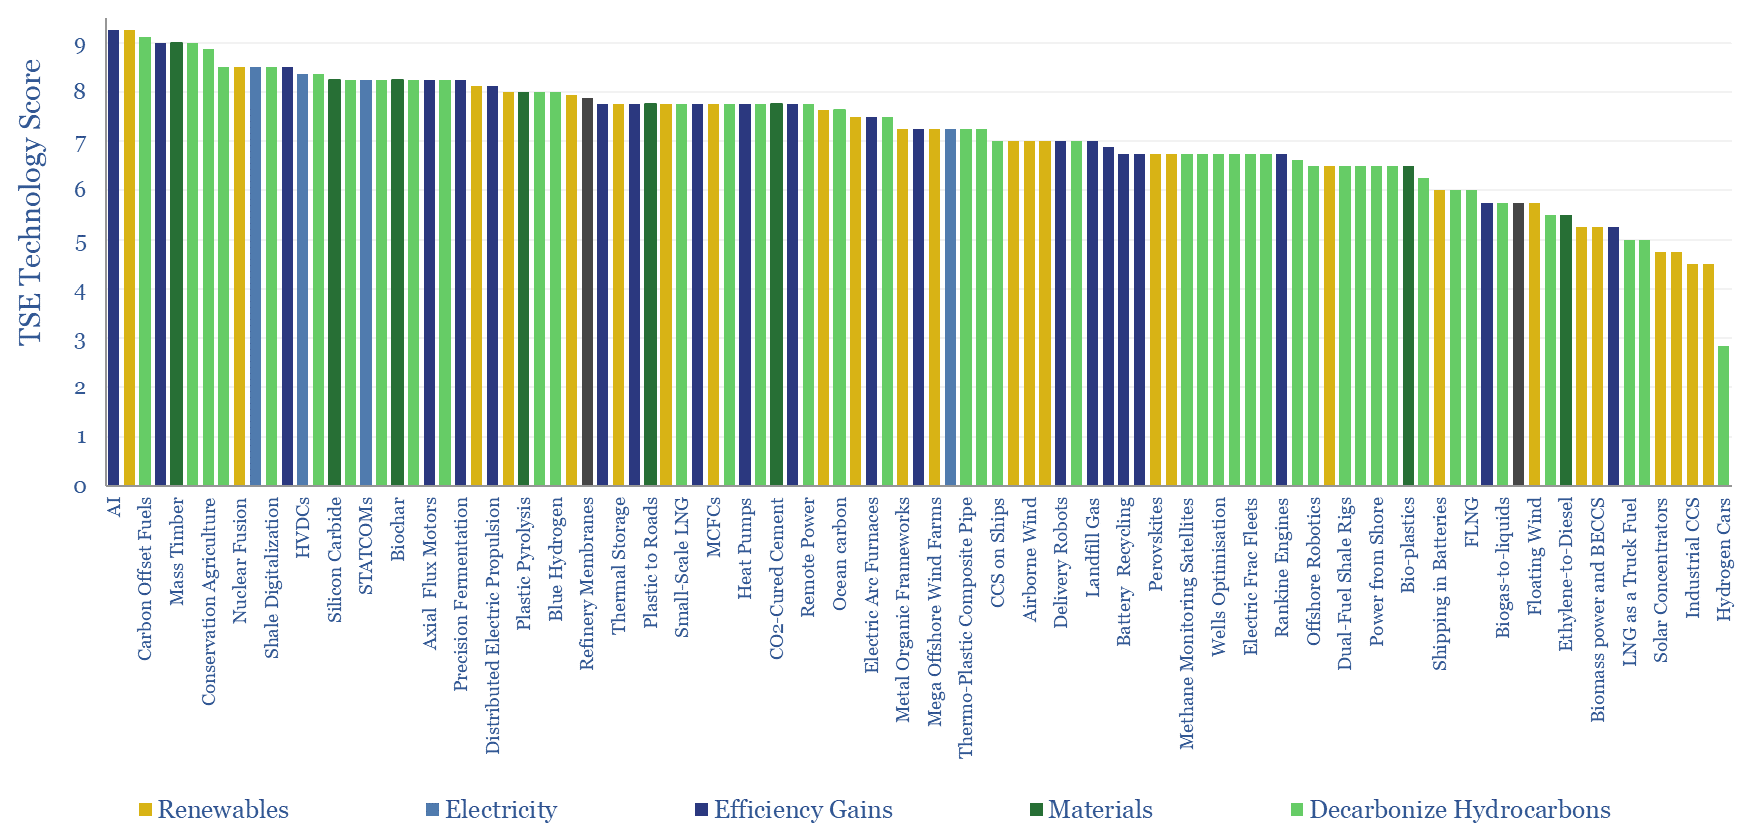
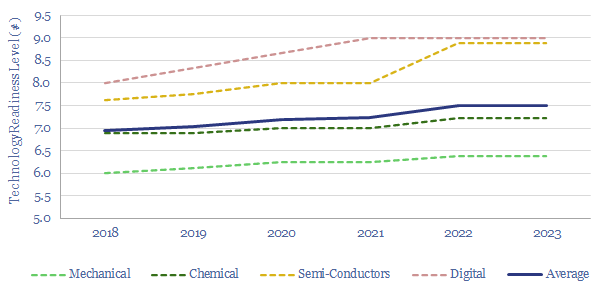
The energy transition technologies are aggregated in this data-file, scoring their economics, technical readiness, and decarbonization potential, as assessed apples-to-apples across all of Thunder Said Energy’s energy transition research.
Specifically, for each energy transition technology, we have summarized the opportunity in two-lines. Then we score its economic impact, its technical maturity (TRL), and the depth of our work on the topic to-date.
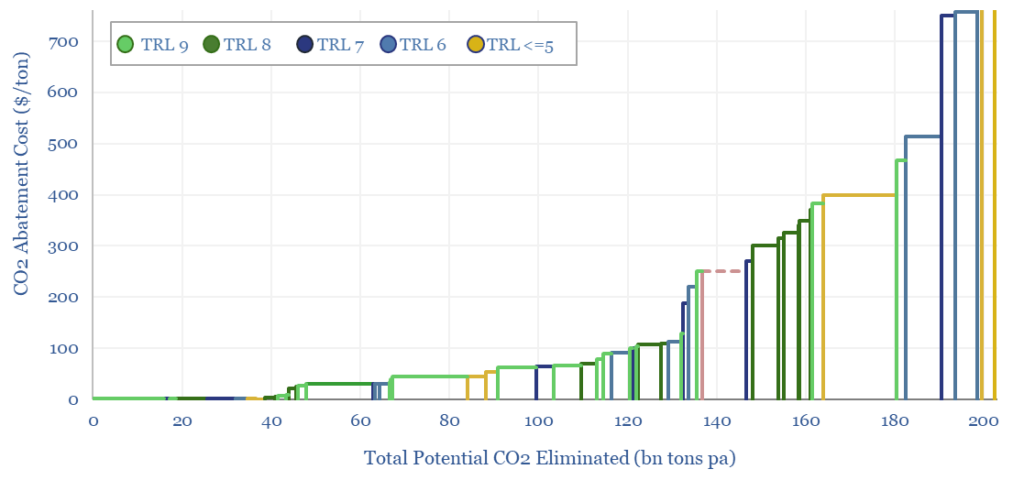
The output is a ranking of the top technologies in the energy transition, by category; and a “cost curve” for the total costs to decarbonize global energy.
Our roadmap to net zero decarbonizes the world for an average CO2 price of $40/ton, with an upper bound around $100/ton, whereas we think technologies costing in the $200-1,000/ton may ultimately be overly expensive.
Specifically, the world’s energy system will rise from 80,000 TWH pa of useful energy in 2022 to well over 100,000 TWH of useful energy by 2050. All else equal, this would increase global CO2e emissions from 50GTpa to 80GTpa. But the opportunities in this data-file can decarbonise the global energy system almost 3x over by 2050.
Our roadmap to net zero picks as many bars as possible from the left-hand side of the energy transition cost curve, to achieve the most decarbonization for the lowest cost. The most economical roadmap has an average abatement cost of $40/ton. The contribution of each technology, and energy transition cost of each technology are modelled out in this database.
How much will new technologies change our roadmap to net zero? We are constantly writing about new technologies, including screening the patents of emerging companies. However, one sober conclusion from our past five years of research is that new technologies emerge quite slowly (chart below). Especially in later stages, as they shift from controlled conditions in the lab, to real-world challenges, such as large-scale engineering, construction, operation and regulation.
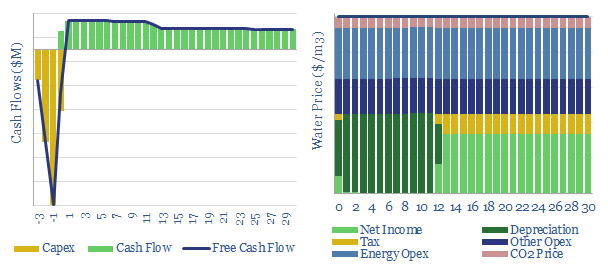
35bn tons of desalinated water are produced each year, absorbing 250 TWH of energy, or 0.4% of total global energy consumption. These numbers will likely rise, due to demographic trends, and due to climate change. Desalination costs average $1.0/m3.
These numbers have already doubled since 2005and could rise sharply in the future: water use per capita remains 50-90% lower in the emerging world than in the United States, populations are growing and aquifers depleting. 1% of the world’s population currently lives off desalinated water. The UN expects this could rise to as much as 14% by 2025-30. So desalination will absorb a rising share of global energy demand and global electricity demand.
Reverse osmosis uses semi-permeable membranes and applied pressure to push water through a membrane while excluding salts. The membranes are generally aromatic polyamide thin-films or Nafion.
Hence, this model quantifies the energy economics of desalination via reverse osmosis, which requires 3.6kWh of energy per m3 of desalinated sea-water. A cost of $1.0/m3 is necessary for a passable IRR, which is equivalent to $1/ton of water.
The world’s largest desalination plant was built at Sorek, Israel in 2013, with an output of 624,000m3/day, and a sales price of $0.58/m3. Other useful datapoints are collated in the data-file.
Impacts can be stress-tested from varying energy prices, CO2 prices, capex costs, opex costs and energy efficiency. Our own base case estimates are derived from past projects and technical papers, in order to give a breakdown of desalination costs.
An angle that excites over desalination costs is the possibility for demand shifting, as electricity is a major cost line, and desalination pumps can be run flexibly to backstop renewables’ volatility.
This data-file screens for the ‘top twenty’ technology leaders in super-capacitors, by assessing c2,000 Western patents filed since 2013.
Each company’s recent progress is summarized, while the full patent database is provided for further details.
Subsequent tabs in the data-file contain all our notes from technical papers into the topic, examples of SCs electric parameters, examples of their deployment and our economic calculations.
Cookies?
This website uses necessary cookies. Our cookies are simply to improve your experience. We do not undertake any advertising or targeting via our cookies. By clicking 'accept' or continuing to use the website, you consent to our use of cookies.AcceptRead More
Privacy & Cookies Policy
Privacy Overview
This website uses cookies to improve your experience while you navigate through the website. Out of these, the cookies that are categorized as necessary are stored on your browser as they are essential for the working of basic functionalities of the website. We also use third-party cookies that help us analyze and understand how you use this website. These cookies will be stored in your browser only with your consent. You also have the option to opt-out of these cookies. But opting out of some of these cookies may affect your browsing experience.
Necessary cookies are absolutely essential for the website to function properly. This category only includes cookies that ensures basic functionalities and security features of the website. These cookies do not store any personal information.
Any cookies that may not be particularly necessary for the website to function and is used specifically to collect user personal data via analytics, ads, other embedded contents are termed as non-necessary cookies. It is mandatory to procure user consent prior to running these cookies on your website.