Levelized costs of solar electricity are estimated at 7c/kWh in our base case, but can realistically range from 4-40c/kWh. This data-file is a breakdown of solar costs, as a function of capex, opex, insolation, curtailment and decline rates. Solar can be highly competitive, up to 35-50% of many power grids.
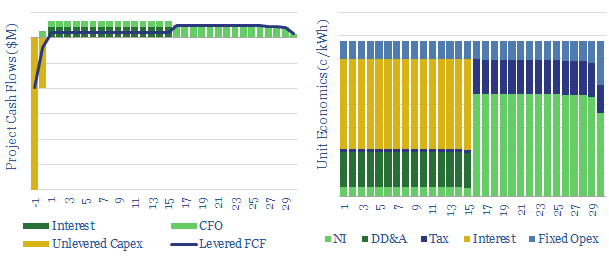
The levelized costs of solar electricity are calculated in this model, as the electricity price that needs to be achieved, per kWh of sold output, in order to achieve a satisfactory return (IRR) on up-front capex costs.
Strictly, this LCOE is the levelized cost of partial electricity (LCOPE), as solar shows minute-by-minute volatility, and also seasonal volatility, linked to weather and latitude.
Our base case estimate is that 7c/kWh power prices can cover a 6% WACC on a levered solar project, in a geography with 1,500 kWh/m2/year of insolation, 22% panel efficiency, 2% curtailment rate and 1.5% annual solar decline rate. Numbers can be stress-tested in the file.
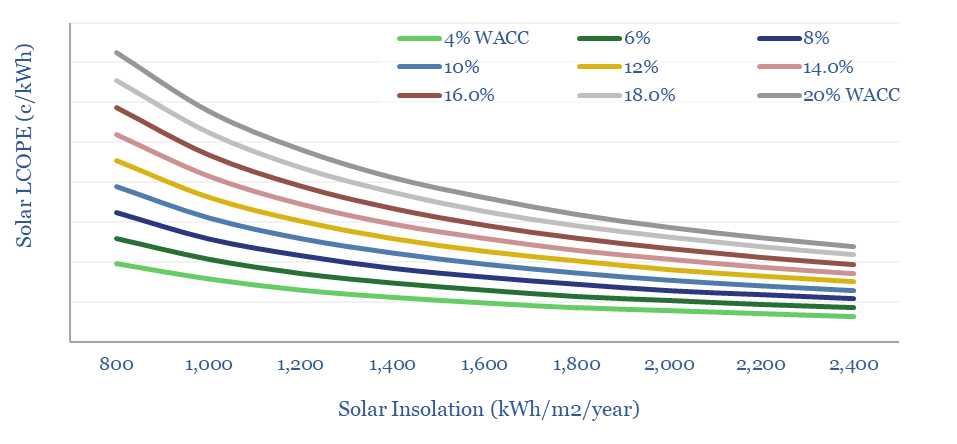
Numbers are sensitive to input assumptions, which can be stress-tested in the data-file. The two most important variables, which drive the economics, are capital costs and insolation rates. Levelized costs of solar can range from 4-40c/kWh, as shown below.

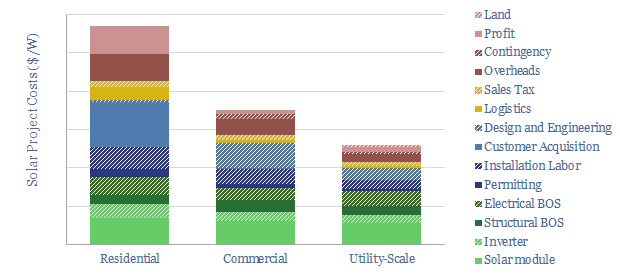
Capex costs are also disaggregated across a dozen categories, derived from technical papers and our own calculations (chart below). However, we also maintain a separate model, on a bottom-up basis, breaking down line-by-line contributors to solar capex.

Levelized costs of solar are often going to be highly competitive with other levelized costs of electricity, at least if LCOPE and LCOTE can be fairly compared. We also see module efficiency doubling over the next decade, which will help to drive continued solar deflation.
We also have models covering the levelized costs of wind, hydro, nuclear, gas, coal, biomass, diesel gensets and geothermal.
Our outlook for solar in the energy transition hinges on the levelized costs of solar. We think solar will rise from 5% of the global grid in 2023 to 35% by 2050, while a handful of solar superpowers will reach 40-50%. Beyond this level, costs of volatility may cause solar to peak.
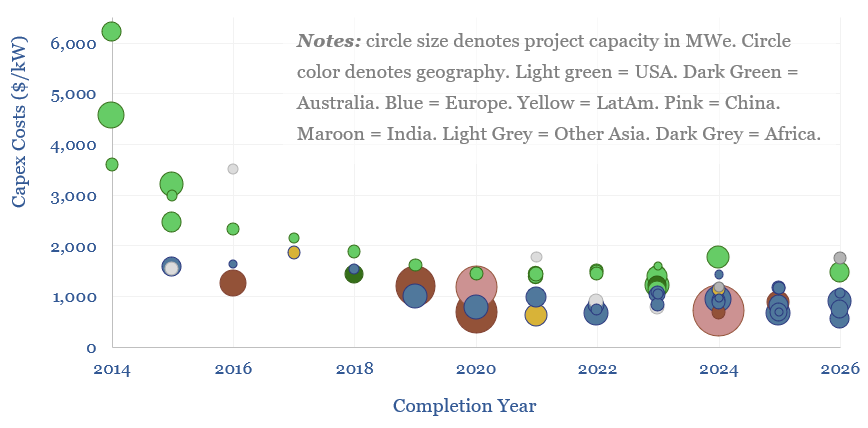
We have updated this data-file in 2024 with a list of capex numbers for over 70 solar projects from 2014 to 2026. Data show how solar capex has fallen by two-thirds, from ~$3,000/kW in 2014-16, to ~$1,000/kW. The US remains a higher cost geography due to import tariffs on solar modules.

