Search results for: “shale”
-
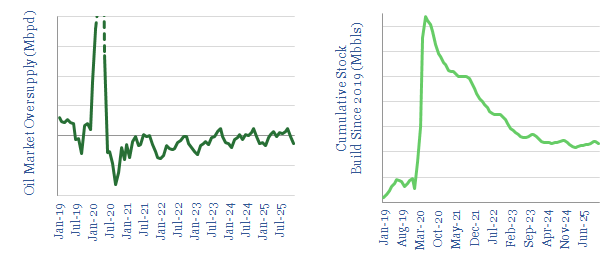
Oil markets: the aftermath?
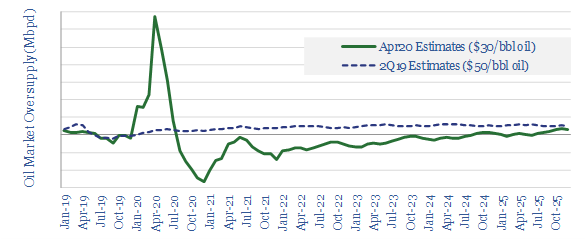
Oil and gas pricing could rebound sharply to the upside after the COVID crisis. Where we have long feared 2-3Mbpd of structural over-supply, continuing out to 2025, our new models suggest an 85% chance of under-supplied markets from mid-2021 onwards, following the loss of 4.5Mbpd of shale growth and c3Mbpd of greenfield growth. This 4-page…
-
Coal-to-gas switching: what CO2 abatement cost?
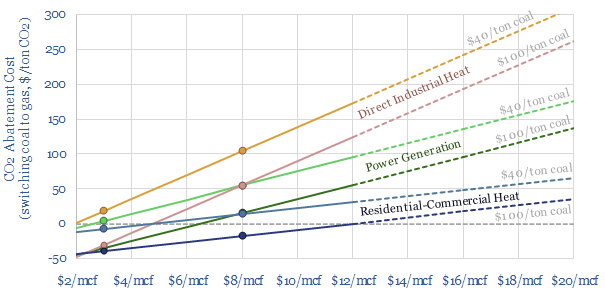
Coal-to-gas switching halves the CO2 emissions per unit of primary energy. This data-file estimates the CO2 abatement costs. Gas is often more expensive than coal. But as a rule of thumb, a $30-60/ton CO2 price makes $6-8/mcf gas competitive with $60-80/ton coal. CO2 abatement costs are materially lower in the US and after reflecting efficiency.…
-
Flare gas capture: the economics?
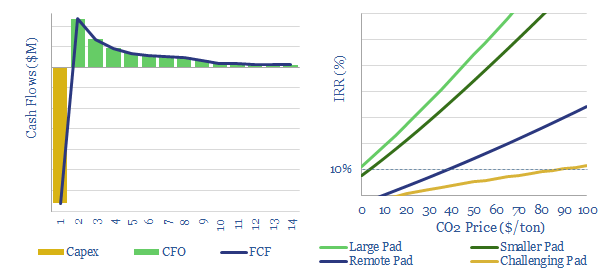
c150bcm of gas was flared globally in 2019. This data-file simplifies the economics of capturing flare gas. Generally, double-digit IRRs are achievable at large new shale pads. But costs are more challenging at smaller sites, remote pads or for contaminated gas. Carbon prices would dramatically improve economics. A $100/ton CO2 price could potentially eliminate US…
-
Oil: what happens when you defer or curtail production?

The aim of this data-file is to tabulate technical papers into production deferrals at oil and gas fields. The impact depends on the reservoir type, but generally we expect shut-ins during the 2020 COVID crisis will lower effective production capacity. Shale and Middle East producers could be relatively better placed.
-
Patent Leaders in Energy
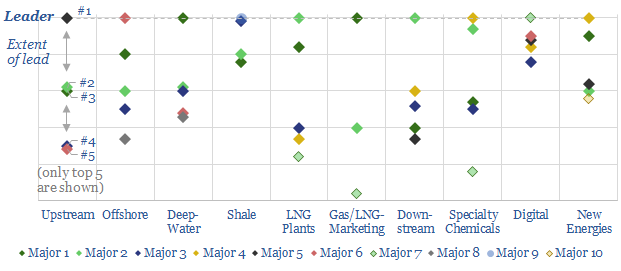
Technology leadership is crucial in energy. But it is difficult to discern. Hence, we reviewed 3,000 patents across the 25 largest companies. This note ranks the industry’s “Top 10 technology-leaders”: in upstream, offshore, deep-water, shale, LNG, gas-marketing, downstream, chemicals, digital and renewables. In each case, we profile the leading company, its edge and the proximity…
-
Decline Rates: the consensus?
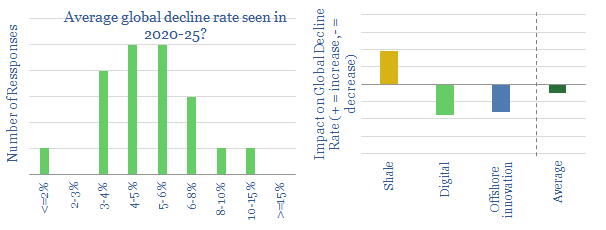
Global decline rates are currently seen at 5.2% pa in 2020-25, according to our survey. This is lower than historical consensus of 5.7%. Although shale is a headwind, it may be offset by the rise of new digital and offshore technologies. Hence modestly more participants see 2020-25 oil markets as over-supplied.
-
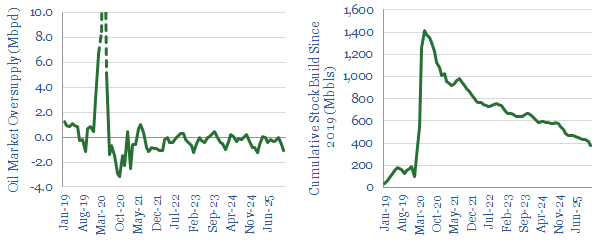
Oil markets: in the balance? (1Q21)
Devastating oil under-supplies look less likely on our latest numbers. For 2021, our prior outlook for -3Mbpd under-supply softens to -0.6Mbpd due to lower demand and stronger US/Canada output. Out to 2025, $60-70/bbl oil suffices to balance oil markets, while higher prices could draw in 4Mbpd more shale and Saudi oil.
-
Oil markets: more balanced than ever before?
Oil markets look more balanced than at any time in the past 5-years, suggesting prices will most likely move sideways. 2022 is seen -0.3Mbpd under-supplied. There is also an equal one-third chance of a surprise to both the upside and the downside, per our Monte Carlo analysis. Maintaining balance to 2025 is also possible.
-
Global coal supply-demand: outlook in energy transition?
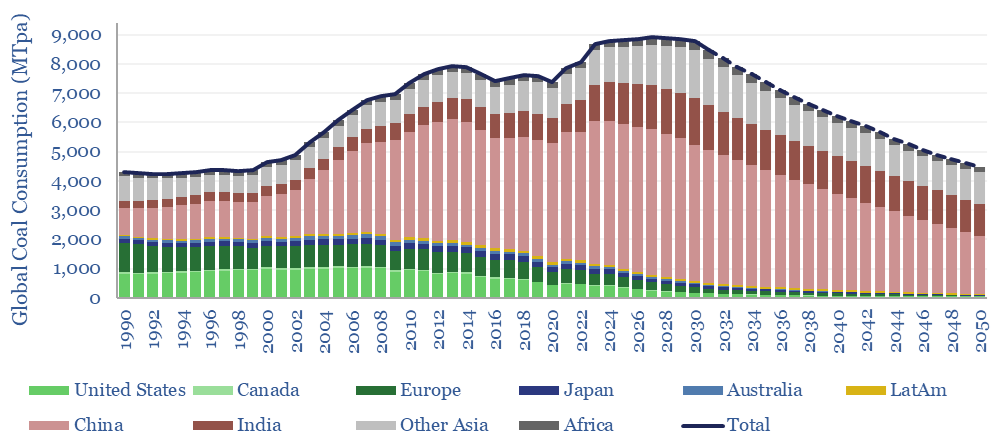
Global coal use likely hit a new all-time peak of 8.8GTpa in 2024, of which 7.6GTpa is thermal coal and 1.1GTpa is metallurgical. The largest consumers are China (5GTpa), India (1.3GTpa), other Asia (1.2GTpa), Europe (0.4GTpa) and the US (0.4GTpa). This model presents our forecasts for global coal supply-demand from 1990 to 2050.
-
LNG in transport: scaling up by scaling down?
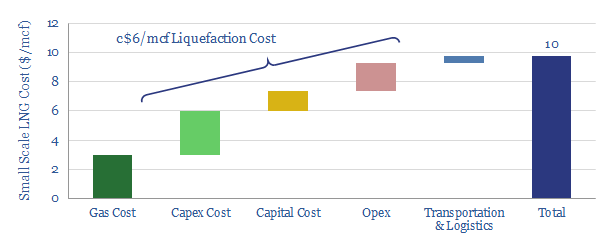
Next-generation technology in small-scale LNG has potential to reshape the global shipping-fuels industry. Especially after IMO 2020 sulphur regulations, LNG should compete with diesel. This note outlines the technologies, economics and opportunities for LNG as a transport fuel.
Content by Category
- Batteries (89)
- Biofuels (44)
- Carbon Intensity (49)
- CCS (63)
- CO2 Removals (9)
- Coal (38)
- Company Diligence (95)
- Data Models (840)
- Decarbonization (160)
- Demand (110)
- Digital (60)
- Downstream (44)
- Economic Model (205)
- Energy Efficiency (75)
- Hydrogen (63)
- Industry Data (279)
- LNG (48)
- Materials (82)
- Metals (80)
- Midstream (43)
- Natural Gas (149)
- Nature (76)
- Nuclear (23)
- Oil (164)
- Patents (38)
- Plastics (44)
- Power Grids (131)
- Renewables (149)
- Screen (117)
- Semiconductors (32)
- Shale (51)
- Solar (68)
- Supply-Demand (45)
- Vehicles (90)
- Wind (44)
- Written Research (356)