Green hydrogen: alkaline versus PEM electrolysers?

Alkaline versus PEM electrolyser

The key difference between an alkaline electrolyser and a proton exchange membrane electrolyser (PEM) is what ion diffuses between the anode and cathode side of the cell. In an alkaline electrolyser, alkaline OH- ions diffuse. In a PEM electrolyser, protons, H+ ions, diffuse. Ten fundamental differences follow.

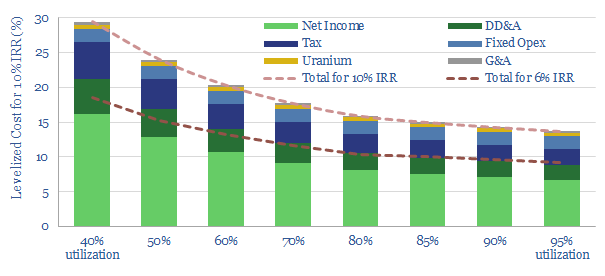
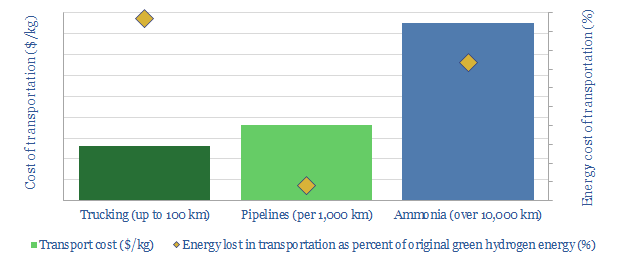
The lowest cost green hydrogen will come from alkaline electrolysers run at high utilizations, powered by clean, stable grids with excess power (e.g., nuclear, hydro).

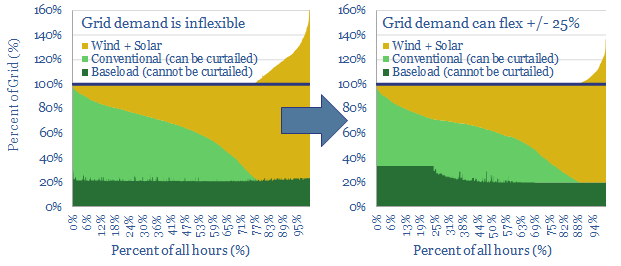
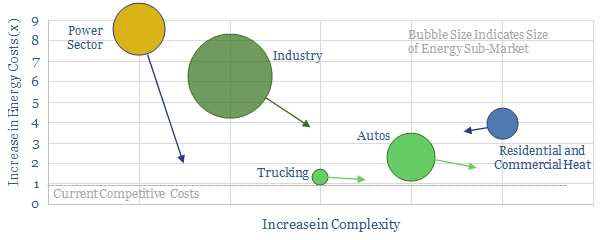
PEMFCs are more suited for backstopping renewables, although there is still some debate over the costs, longevity, efficiency and whether intermittent wind/solar can be put to better use elsewhere.


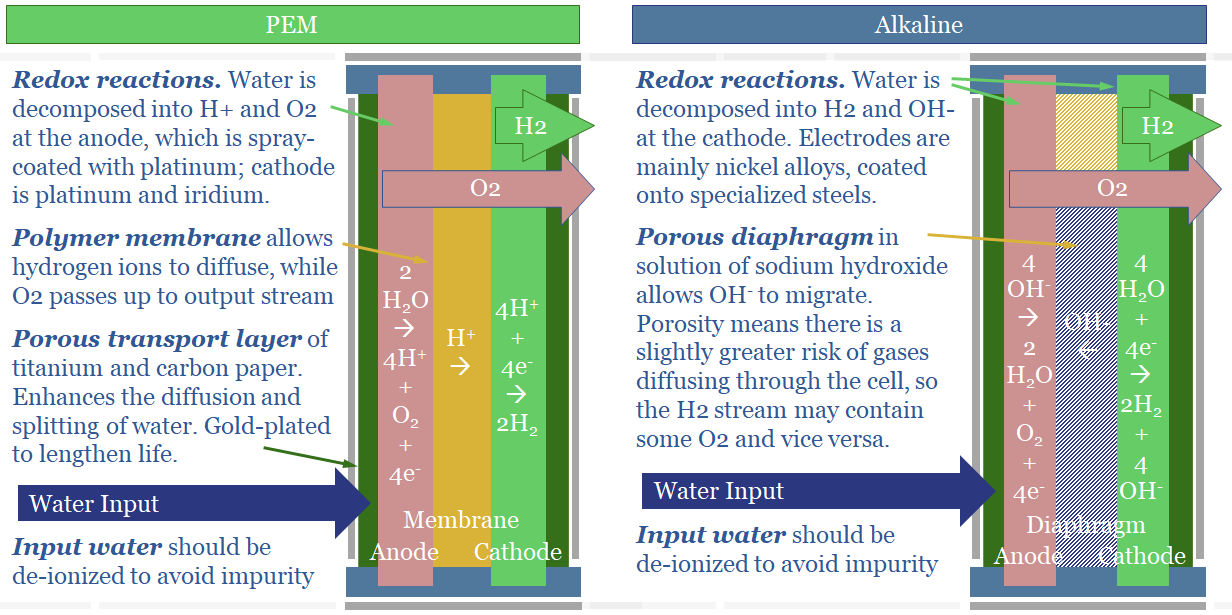
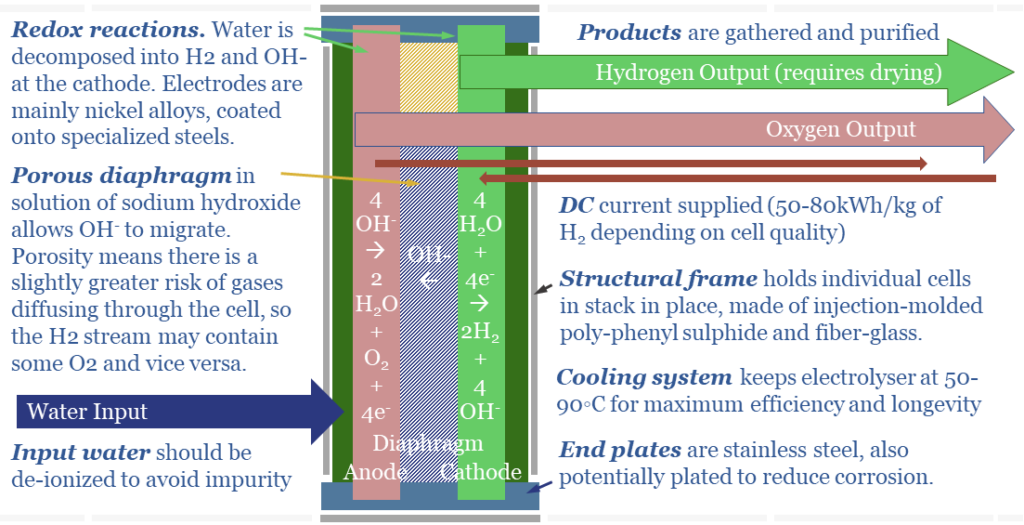
(1) In an alkaline electrolyser, water is broken down at the cathode. 4 x H2O molecules gains 4 x e- and become 2 x H2 + 4 x OH- ions. The OH- ions then diffuse across the cell to the anode. To complete the electrical circuit, 4 x OH- ion surrender 4 x e- at the cathode and become 2 x H2O molecules + 1 x O2 molecule. A schematic is below.

(2) In a PEM electrolyser, the chemistry is very different. Water is broken down at the anode. 2 x H2O molecules surrender 4 x e- and become an O2 molecule + 4 H+ ions (protons). The H+ ions then diffuse across the cell to the cathode. To complete the electrical circuit, at the cathode, 4 x H+ ions gain 4 x e- and become 2 x H2 molecules.

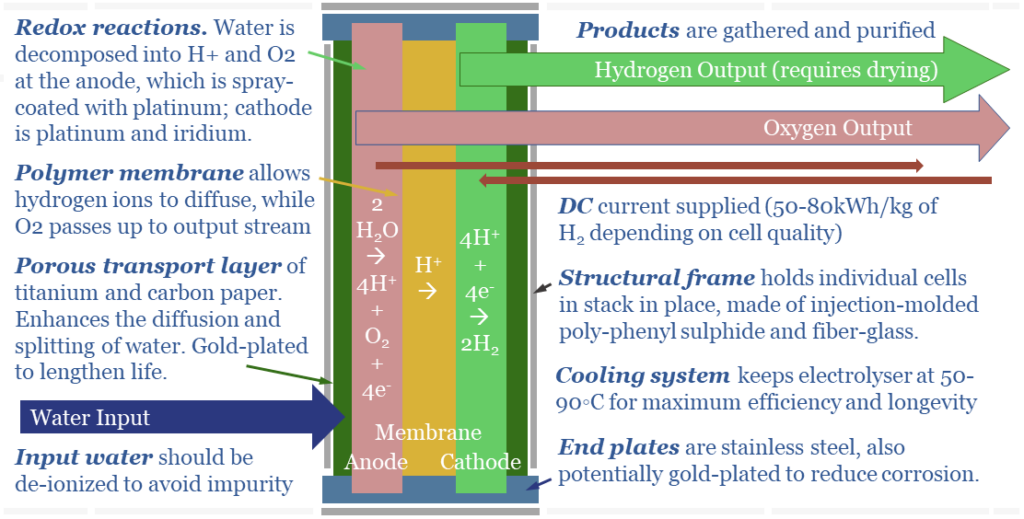
(3) PEMs have Membranes. H+ ions are the smallest ions in the Universe, measuring 0.0008 pico-meters (comparable with other ionic radiuses below). This means protons can diffuse through solid polymers like Nafion, which otherwise resist electricity and resist the flow of almost all other materials; totally isolating the anode and cathode sides of the cell in a PEMFC.

(4) Alkaline Electrolysers have Diaphragms. OH- ions are larger, at 153 pm (which is actually quite large, per the chart above). Thus they will not diffuse through a solid polymer membrane. Consequently, the anode and cathode are separated by a porous diaphragm, bathed in an electrolyte solution of potassium hydroxide, produced via a variant of the chlor-alkali process. This (alkaline) electrolyte also contains OH- ions. This helps, because more OH- ions makes it faster for excess OH- ions to diffuse from high concentration on the cathode side of the cell to low concentration on the anode side of the cell (see (2)).

(5) Safety implications. Alkaline electrolysers are said to be less safe than PEMs. The reason is the porous diaphragm. Instead of bubbling out as a gas on the anode side, very small amounts of oxygen may dissolve, diffuse ‘in the wrong direction’ across the porous diaphragm, and bubble out alongside the hydrogen gas at the cathode side. This is bad. H2 + O2 make an explosive mixture.

(6) Footprint implications. One way to deal with the safety issue above is to place the anode and cathode ‘further apart’ for an alkaline electrolyser. This lowers the chances of oxygen diffusing across the diaphragm. But it also means that alkaline electrolysers are less power-dense.

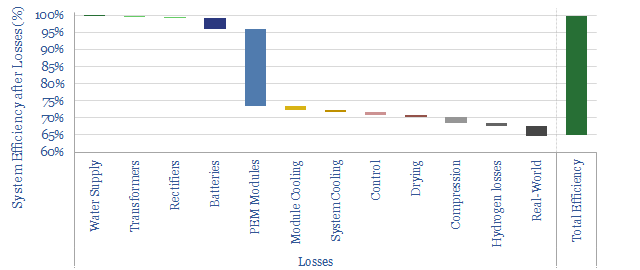
(7) Efficiency implications. Small amount of current can leak through the KOH solution in an alkaline electrolyser, especially at very large current densities. When a direct current (e-) is added to the cell, we want it to reduce 2 x H+ into H2. However, a small amount of the current may be wasted, converting K+ into K; and a small amount of ‘shunt current’ may flow through the KOH solution directly from cathode to anode. We think real-world PEMs will be around 65% efficient (chart below, write-up here) and alkaline electrolysers will be multiple percentage points lower.

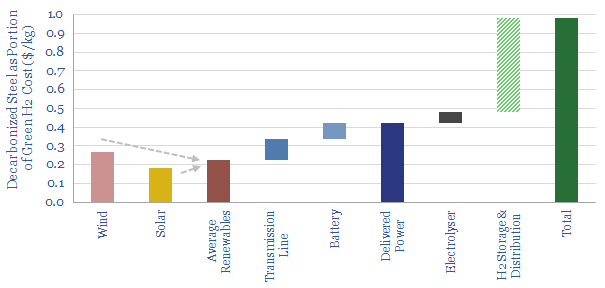
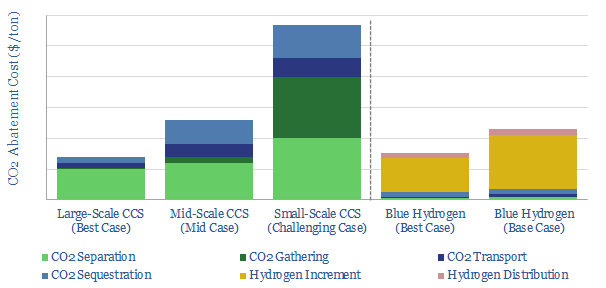
(8) Cost implications. An alkaline electrolyser may be a few $100/kW cheaper than a PEM electrolyser. Because the diaphragm is cheaper than the membrane. The electrodes are cheaper too. Our overview of electrolyser costs is below.

(9) Longevity implications. Today’s PEMs degrade 2x faster than alkaline electrolysers (40,000 hours versus 90,000 hours, as general rules of thumb). This is primarily because the membranes are fragile. And H+ ions are, by definition, acidic. But as with all power-electronics, the rate of degradation is also a function of the input signal and operating conditions.

(10) Flexibility implications. Alkaline electrolysers are not seen to be a good fit for backstopping renewables (chart above). According to one technical paper, “It is well known that alkaline water electrolysers must be operated with a so-called protective current in stand-by/idle conditions (i.e., when no power is provided by renewable energy sources) in order to avoid a substantial performance degradation”. When ion flow stops, there is nothing driving OH- ions across the cell, and pushing the H2 and O2 out of the cell. In turn, this means O2 and H2 bubbles can form. They may accumulate around electrode catalysts. Then when the cell starts up again, the gas bubbles block current flow. In turn, overly large resistance or current densities can then degrade the catalysts.

Energy policy: unleashing new technologies?

Does policy de-risk new technology?

Does policy de-risk new technology? This 10-page note is a case study. The Synthetic Fuels Corporation was created by the US Government in 1980. It was promised $88bn. But it missed its target to unleash 2Mbpd of next-generation fuels by 1992. There were four challenges. Are they worth remembering in new energies today?


The Synthetic Fuels Corporation was created by the US Government in 1980. To great fanfare. Its goal was unleashing synfuels. At $325bn in today’s money, its budget was actually quite similar to the energy-climate portion of 2022’s Inflation Reduction Act.

We explore other similarities between energy policies in the 1980s, the creation of the SFC, and emerging policies in the energy transition (pages 2-4). Our conclusion is that the similarities are surprisingly striking.

The main production pathway that was envisaged in the creation of synfuels started with coal, produced hydrogen as an intermediate, and then converted syngas into liquid fuels. The process is described in more detail on page 5.

Costs are a challenge. We have modelled the energy costs of synfuels, in today’s money, using models of coal gasification and gas-to-liquids. Ultimate costs of synfuels — in $/bbl and c/kWh-th — are derived on page 6.

Efficiency is a challenge. We modelled the thermodynamics and energy penalties of producing synfuels, in a helpful waterfall chart schematic on page 11. You cannot get around the second law of thermodynamics.

Other technical challenges are discussed on page 8. Some projects backed by the SFC simply did not work. Others were very small scale (around 5kbpd).

Politics could be described as the biggest barrier. Policies have an annoying habit of changing. The downfall of the US’s political push towards synfuels, which played out throughout the 1980s, is summarized on page 9.

Does policy de-risk new technology? We draw out conclusions for the energy transition on page 10. We all clearly want to avoid repeating mistakes of the 1980s. So our goal is to offer constructive suggestions for decision-makers, investors and project developers.

Green steel: circular reference?

green steel

Steel explains almost c10% of global CO2. Hence 2021 has seen the world’s first ‘green steel’ made using green hydrogen. Yet inflation worries us. At $7.5/kg H2, green steel would cost 2x conventional steel. In turn, doubling the global steel price would re-inflate green H2 costs by $0.5/kg. This 16-page note explores inflationary feedback loops and other options for steel-makers.


Global steel production runs at 2GTpa, comprising one of the ‘top ten’ materials made by mankind. 70% of production is from blast furnaces and basic oxygen furnaces emitting 2.4 tons of CO2 per ton of steel output. Pages 2-4 provide an overview of the industry, its production processes and their CO2 emissions.

Green hydrogen is generating excitement as an abatement option. We review pilot projects and optimistic projections from technical papers on pages 5-6.

What about the costs? We have modeled the economics of a full-scale switch to green hydrogen in a Direct Reduced Iron + Electric Arc Furnace plant configuration. We would see costs doubling, but c85-90% of the CO2 can be removed (page 7).

Inflationary feedback loops have been a recurring topic in our recent research, and steel makes an interesting case study. Steel is used in wind, solar, power distribution, batteries, hydrogen electrolysers and hydrogen storage infrastructure. So what happens to the price of green hydrogen if all of these value chain components switch to 2x more expensive green steel? We run through the results on pages 8-11, then discuss how these inflationary feedback loops might actually play on pages 12-13.

Technical challenges for the adoption of green hydrogen in the steel industry are discussed on page 14. We are skeptical of the cost-deflation promised in other studies.

Our conclusions are that there may be some niche uses for green steel, but we prefer other options for mass-scale decarbonization of the steel industry, on pages 15-16.

Back-stopping renewables: the nuclear option?

Nuclear power can backstop renewables

Nuclear power can backstop much volatility in renewable-heavy grids, for costs of 15-25c/kWh. This is at least 70% less costly than large batteries or green hydrogen, but could see less wind and solar developed overall. This 13-page note reviews how flexibility in nuclear power can backstop renewables, and sees nuclear growth accelerating.


Four types of volatility in renewable-heavy grids are described on page 2 and will require a back-up.

There are limitations for batteries in hydrogen, in smoothing this volatility, as discussed on pages 3-4.

What about nuclear? An improving economic rationale is noted on pages 5-6, prompting us to re-visit the possibility of flexible nuclear plant operation.

Technical issues for maneuvering large nuclear power plants, scaling their output up and down, are laid out from first principles on pages 7-11, including minute-by-minute ramp-rates and the largest challenge, which is cold-starts.

The economics of nuclear flexibility are calculated on page 12, showing costs around 15-25c/kWh for a new Western greenfield facility, which is less than large batteries and hydrogen.

Our conclusions around how nuclear power can backstop renewables volatility – and who benefits – are summarized on page 13.

Shifting demand: can renewables reach 50% of grids?

Shifting demand for wind and solar

25% of the power grid could realistically become ‘flexible’, shifting its demand across days, even weeks. This is the lowest cost and most thermodynamically efficient route to fit more wind and solar into power grids. We are upgrading our renewables ceilings from 40% to 50%. This 22-page note outlines the growing opportunity in demand shifting.


Renewables would struggle to reach 50% penetration of today’s grids, due to their volatility. Pages 2-7 quantify the challenges, which include capacity payments for non-renewable back-ups, negative power pricing >20% of the time, >10% curtailment and 30% marginal cost re-inflation for new projects.

But a greater share of renewables would help decarbonization. This objective is explained on page 8, showing the relative costs and CO2-intensities of electricity technologies.

Renewable electricity storage is not the solution. It is costly and thermodynamically inefficient, which actually dilutes the impact of renewables. Costs and efficiency losses are quantified for batteries and for hydrogen on pages 9-11.

Demand shifting is a vastly superior solution. Pages 12-17 outline half-a-dozen demand-shifting opportunities that have been profiled in our research to-date. Companies in the smart energy supply chain are also noted and screened.

What impacts? We model that up to 25% of the grid can ultimately be demand-flexible, while this can help accommodate an additional 10pp share for renewables in the grid, before extreme volatility begins to bite (see pages 18-19).

Europe leads, and we now assume renewables can reach 50% of its power grid by 2050, with follow-through consequences for our gas and power models (page 20).

Our global renewables forecasts are not upgraded, as the bottleneck on a global basis is simply annual capacity additions, which must treble between 2020 and 2050, in our roadmap to ‘net zero’. (pages 21-22).

Methanol: the next hydrogen?

Methanol as a clean transportation fuel

Methanol is becoming more exciting than hydrogen as a clean fuel to help decarbonize transport. Specifically, blue methanol and bio-methanol are 65-75% less CO2-intensive than oil products, while they can already earn 10% IRRs at c$3/gallon-equivalent prices. Unlike hydrogen, it is simple to transport and integrate methanol with pre-existing vehicles. Hence this 21-page note outlines the opportunity.


The objectives and challenges of hydrogen are summarized on pages 2-3. We show that clean methanol can satisfy the objectives without incurring the challenges.

An overview of the methanol market is given on pages 4-5, to frame the opportunity, particularly in transportation fuels and cleaner chemicals.

Conventional methanol production is described on 6-8. We focus upon the chemistry, the costs, the economics and the CO2 intensity.

Bio-methanol is modelled on pages 9-10. We also focus upon the costs, economics and CO2 intensity, including an opportunity for carbon-negative fuels.

Blue methanol is outlined on pages 11-15. Converting CO2 and hydrogen into methanol is fully commercial, based on recent case studies, which we also use to model the economics and CO2 credentials.

Green methanol is more expensive for little incremental CO2 reduction, and indeed some routes to green methanol production are actually higher-CO2 (pages 16-18).

Companies in the methanol value chain are profiled on pages 19-20. We focus upon leading incumbents, technology providers and private companies commercializing clean methanol.

Our conclusion is that methanol could excite decision-makers in 2021, the way that hydrogen excited in 2020. This thesis is spelled out on page 21.

Energy transition: is it becoming a bubble?

Energy transition becoming a bubble?

Investment bubbles in history typically take 4-years to build and 2-years to burst, as asset prices rise c815% then collapse by 75%. In the aftermath, finances and reputations are both destroyed. There is now a frightening resemblance between energy transition technologies and prior investment bubbles. This 19-page note aims to pinpoint the risks and help you defray them.


Our rationale for comparing energy transition to prior investment bubbles is contextualized on page 2, based on discussions we have had with investors and companies in 2020.

Half-a-dozen historical bubbles are summarized on pages 3-4, in order to compare the energy transition with features of Dutch tulips, the South Sea and Mississippi Companies, British Railway Mania, Roaring Twenties, Dot Com bubble and sub-prime mortgages.

Five common features of all bubbles are considered in turn on pages 5-16. In each case, we explain how the feature contributed to past bubbles, and where there is evidence of the feature in different energy transition technologies.

Important findings are that many themes of the energy transition can achieve continued deflation or profitability, but not both; while a combination of increasing leverage and curtailment on renewables assets could leave many assets underwater.

Implications are drawn out on pages 17-19, including five recommendations for decision-makers to find opportunities and avoid the most dangerous aspects of bubbles surrounding the energy transition.

Deep blue: cracking the code of carbon capture?

blue hydrogen carbon capture

Carbon capture is cursed by colossal costs at small scale. But blue hydrogen may be its saviour. Crucial economies of scale are guaranteed by deploying both technologies together. The combination is a dream scenario for gas producers. This 22-page note outlines the opportunity and costs.


The mechanics of carbon capture and storage projects are explained on pages 2-4, assessing the costs of CO2 capture, CO2 transport and CO2 disposal in turn.

However CCS faces challenges, which are outlined on pages 4-5. In particular, CO2 has three ‘curses’ at small scale, which dramatically inflate the costs.

We quantify the three curses’ impacts. They are diffuse CO2 concentrations (pages 6-8), high fixed costs for pipelines and disposal facilities (pages 8-10) and difficulties gathering CO2 from dispersed turbines and boilers (pages 10-11).

The rationale for blue hydrogen is to overcome these challenges with CCS, as explained on page 12.

Different blue hydrogen reactor designs are discussed, and their economics are modelled on pages 13-15. Autothermal reforming should take precedence over steam methane reforming as part of the energy transition.

Midstream challenges remain. But we find they are less challenging for blue hydrogen than for green hydrogen on page 16.

A scale-up of blue hydrogen is a dream scenario for the gas industry. The three benefits are superior volumes, pricing power and acceptance in the energy transition, as explained on pages 17-19.

Leading projects are profiled on page 20, which aim to combine blue hydrogen with CCS.

Leading companies in auto-thermal reforming (ATR) are profiled on page 21, based on reviewing technical papers and over 750 patents.

Aker Carbon Capture’s technology is profiled on page 22. Patents reveal a technical breakthrough, but it will only benefit indirectly from our blue hydrogen theme.

The green hydrogen economy: a summary?

green hydrogen economy

Our mission is to find economic opportunities that can drive the energy transition, substantiated by transparent data and modelling. Therefore, we have looked extensively for opportunities in hydrogen, but somewhat failed to find very many.

More pessimistically stated, we fear that the ‘green hydrogen economy’ may fail to be green, fail to deliver hydrogen, and fail to be economical. We see greater opportunities elsewhere in the energy transition.

This short note summarizes half-a-dozen deep-dive research notes, plus over a dozen models and data-files into the commercialization of hydrogen. There may be opportunities in the space, but they must be chosen very carefully.


An overview of different hydrogen pathways?

We start with an overview of hydrogen pathways. In 2019, c70MT of hydrogen was produced globally. 95% of it was grey, meaning it was derived from steam-methane reforming of natural gas. The cost of this process is around $1.3/kg ($11.5/mcf-gas- equivalent) and efficiency is c70%, which means that replacing 1 kWh of gas with 1kWh of hydrogen actually increases both gas demand and CO2 emissions.

Capture 80-100% of the CO2 from SMR using CCS and you have ‘blue hydrogen’, a fuel that costs c$2/kg ($18/mcfe), with a production efficiency of c60%, and a CO2 content that is 75-100% lower CO2 than combusting the natural gas it is derived from.

Finally, use renewable energy to hydrolyse water, and you have ‘green hydrogen’, which is truly zero carbon. But it currently costs $6-8/kg ($55-70/mcfe) and has 60-90% production efficiency, which is far worse than the best batteries we have researched.

Can hydrogen be economic: in heat, power or transportation?

Costs matter for consumers in the energy transition. For example, we estimate that using blue hydrogen to decarbonize heat would raise an average household’s heating bill by c$670 per year, while green hydrogen would increase it by c$2,600. By contrast, our preferred solution of nature based solutions and efficient natural gas decarbonizes home heating at an incremental cost of $50 per household per year.

Green hydrogen in the power sector does not look viable to us. We have modelled the green hydrogen value chain: harnessing renewable energy, electrolysing water, storing the hydrogen, then generating usable power in a fuel cell. Today’s end costs are very high, at 64c/kWh. Even by 2040-2050, our best case scenario is 14c/kWh, which would elevate average household electricity bills by $440-990/year compared with the superior alternative of decarbonizing natural gas.

This is despite heroic assumptions in our 2040s numbers, such as a 1.5x improvement in round trip energy efficiency, 80% cost deflation, c40% “free” renewable energy, in situ hydrogen production and use, and nearby salt caverns for low cost storage (so green H2 retails at $3/kg). All of this analysis is based on transparent data and modelling, as shown below. We welcome pushbacks and challenges if you have different numbers.

Challenges are raised about green hydrogen in our work. First, processes fuelled purely by renewables (i.e., electrolysis reactors) will tend to have 30-40% utilization rates at best (half the US industrial average), which amortizes high capital costs over less generation. Second, storage is complex and could be 4-10x more expensive than we assumed, if salt caverns are not nearby. Finally, beware of ‘magic mystery deflation’ that is baked into the estimates of some commentators.

Economizing comes with trade-offs. This is particularly visible when we look at the cost of electrolysers, where lower capex may come at the cost of lower efficiency, reliability, longevity and even safety. Some forecasters are calling for 80% deflation, but we see 15-25% as more likely, if manufacturers wish to make a margin in the future, and as many of the cost components are technically mature.

Green hydrogen in trucking may offer more promising inroads, particularly in well-chosen niches. Trucking consumes 10Mbpd of diesel globally and emits c1.5bn tons of CO2 per year, which is 3.5% of the global total. Current full-cycle costs of hydrogen trucks are c30% higher than diesels. This is based on $150k higher truck costs, 85% higher maintenance and $7/kg green hydrogen plus $1.5/kg retail margins.

But a full and rapid switch to hydrogen trucks in Europe would cost an incremental $50bn per year (equivalent to a 0.3% off Europe’s GDP, plus multipliers). 2040s green hydrogen truck costs could become competitive with diesel, in Europe, but again, this is incorporating some heroic assumptions. In particular, fuel retail margins for hydrogen may need to be c20x higher than for conventional fuels in remote locations with little traffic.

Immutable midstream issues: an anomalous commodity?

All of the value chains and models above assumed hydrogen was generated in situ, via electrolysis, at its point of use. However, in order for hydrogen to scale up, it would need to be transported, like other commodities.

Transporting hydrogen may be more challenging than any other commodity ever commercialised in the history of global energy. Costs are 2-10x higher than gas value chains. Up to 50% of hydrogen’s embedded energy may be lost in transit. We find these challenges are relatively immutable. They are due to physical and chemical properties of H2, plus the laws of fluid mechanics, which cannot be deflated away through greater scale.

For example a hydrogen pipeline will inherently cost 2-10x more than a comparable gas pipeline. This is down to fluid dynamics, as the hydrogen line, all else equal, will flow 25% less energy (due to the gravity, energy density and compressibility of hydrogen gas), but require c30% more expensive reinforcement and materials (due to hydrogen’s lower molecular mass and proneness to causing embrittlement and stress cracking in high-pressure lines).

Moving hydrogen as ammonia is another option. Air Products recently sanctioned a $7bn project to produce green hydrogen in Saudi Arabia, convert it to ammonia, then ship the ammonia to Europe or Japan. Its guidance implies hydrogen could be imported at $10/kg while earning a 10% IRR. But we needed to assume several cost lines are budgeted at 50% below recent comparison-points to match this guidance. Our sense is that a comparably complex LNG project might warrant a 20% hurdle rate. Thus to be excited by this project, we would want to see a hydrogen sales price closer to $15/kg.

Is Magic Mystery Deflation a Cure All?

The pushback to our hesitations is that deflation will prevail, costs will fall and green hydrogen will ultimately become economic in ways that are hard to model ex-ante. This is possible, but it is not borne out by our work reviewing over 1M patents. The ‘average’ topic in the energy transition is seeing c600 patents filed per year (ex-China) and accelerating at a 5% CAGR. Hydrogen fuel cells saw 222 in 2019 and are declining at a -10% CADR. Hydrogen trucks and fuelling stations saw c300 patents in 2019 which is flat on 2013.

The patents also flag complexities. How do you safely prevent explosions in the event of a crash? How do you keep a fuel cell hydrated in dry climates, cool under thermal loads and starting smoothly in very cold climates? How do you add odorants to hydrogen to lower the risk of undetected leaks, if odorants poison fuel cells? Who is legally liable if a fuel cell is poisoned by inadvertently selling contaminated hydrogen?

We would be wary of companies that have made extensive promises, especially around future economics, but without having developed the underlying technologies being promised. This creates a high degree of risk.

To help identify technology leaders, we have assessed the patents filed in fuel cells, electrolyers, hydrogen vehicles and in fuelling infrastructure.

Conclusion. Policymakers are currently aiming to accelerate the development of green hydrogen. Our own work into the economics and technical challenges make us nervous that these policies may need to be walked back over time. There may be some interesting use cases for hydrogen in the energy transition (especially blue hydrogen). But the history of technology transitions does not suggest to us that a green hydrogen economy could emerge and have any meaningful impact on climate within the required 20-30 year timeframe.

Hydrogen: lost in transportation?

Costs of hydrogen transportation

Transporting hydrogen will be more challenging than for any other commodity ever commercialised in the history of global energy. This 19-page note reviews the costs and complexities of cryogenic trucks, hydrogen pipelines and chemical hydrogen carriers (e.g., ammonia). Midstream costs will be 2-10x higher than comparable gas value chains, while up to 50% of hydrogen’s embedded energy may be lost in transportation.


We have assessed the costs of green hydrogen value chains in our prior research, focusing on power and trucking. The costs are re-capped on pages 2-3. But our calculations assume all hydrogen is generated near its point of sale. This note assesses the additional costs and complexities of hydrogen transport.

Hydrogen is inherently more complex to transport than natural gas, due to immutable physical and chemical differences, which are spelled out on pages 4-5.

Cryogenic trucks are assessed on pages 6-7. Liquefying hydrogen at -253C and the associated boil-off may consume c50% as much energy as is in the delivered hydrogen.

New hydrogen pipelines are assessed on pages 8-12, including a deep-dive into the fluid mechanics. Costs will inherently be 2-10x higher than for natural gas.

Blending hydrogen into pre-existing gas pipelines is assessed on pages 13-14. This option introduces unfathomable complexity for a mere 3-6% CO2 reduction.

Chemical carriers such as ammonia are assessed on pages 15-17. We model the value chain end-to-end, which makes for interesting conclusions on Air Products’s recently sanctioned $7bn hydrogen-ammonia project in Saudi Arabia.

The impact on hydrogen costs is quantified on pages 18-19. We conclude hydrogen transport would increase our power and trucking costs by c10-25%.

Copyright: Thunder Said Energy, 2019-2024.