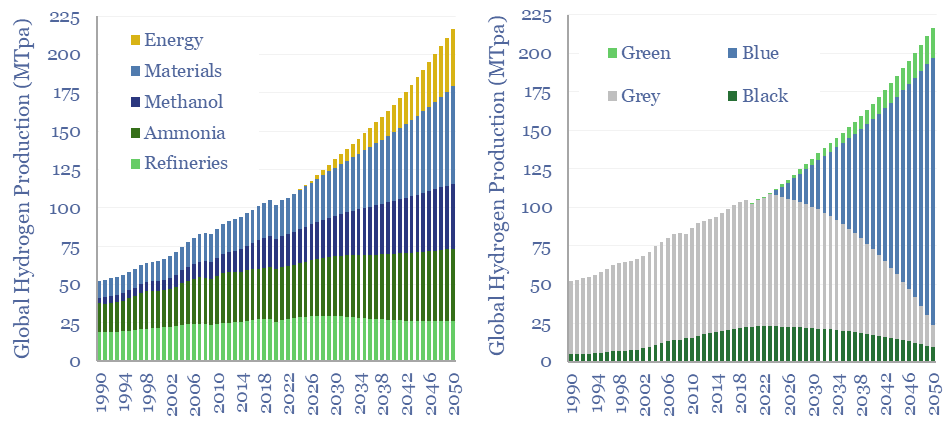
110MTpa of hydrogen is produced each year, emitting 1.3GTpa of CO2. We think the market doubles to 220MTpa by 2050. This is c60% ‘below consensus’. Decarbonization also disrupts 80% of today’s asset base. Our outlook varies by region. This 17-page hydrogen outlook explores the evolving market and implications for industrial gas incumbents?
Today’s 110MTpa hydrogen market is first broken down by product type, end use, geography, supply sources and hydrogen cost ranges (pages 2-4).
Producing 110MTpa of hydrogen in 2023 emits 1.3 GTpa of CO2, which is 2.5% of total global CO2 emissions, at an average CO2 intensity of 12 tons/ton (page 5).
There is no shortage of commentary into how the world should decarbonize. Every commentator is entitled to their views. Our goal in this report is to guess what will actually happen, to black, grey, blue, turquoise and green hydrogen (pages 6-8).
Five recommendations for industrial gas companies follow from this view, some for the 2020s, others for the 2030s and beyond (page 9).
Refining industry disruption creates downside to hydrogen demand in some geographies. Refineries use 25-30% of the world’s hydrogen, mainly for hydroprocessing. While oil demand is flatlining in some geographies and declining in others (pages 10-11).
Hence our hydrogen outlook varies by region. The trajectory looks very different in US hydrogen markets, Europe, the broader OECD and non-OECD (pages 12-16).
Blue hydrogen value chains are now booming in the US, to decarbonize ammonia, steel, petrochemicals and other materials. More broadly, other commentators have published huge forecasts for green hydrogen. But what is actually realistic in our hydrogen supply model? And what implications for the gas industry, power industry and CCS industry? (pages 12-16).
Large industrial gas companies and technology providers are pursuing different strategies amidst this evolving landscape (page 17).
