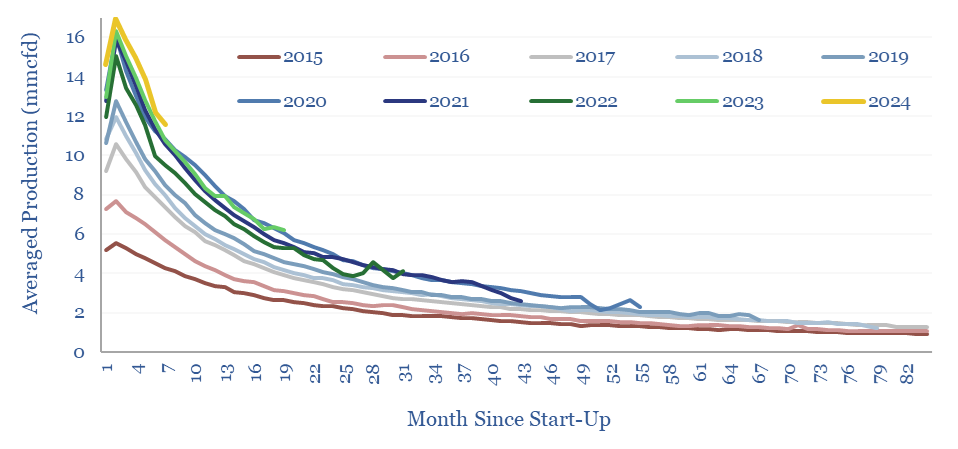
This data-file tracks Marcellus shale well productivity, by tabulating the monthly output from 13,000 wells across the Pennsylvania Marcellus, from 2015 to mid-2024. Average IP rates across the basin have…

Methane leakage rates in the gas industry vary by source and use. Across our build-ups, the best-placed value chains are using Marcellus gas in CCGTs (0.2% methane leakage, equivalent to…
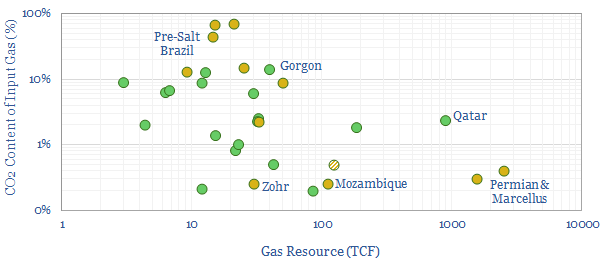
…gas value chains to be around 56 kg/mcf. Large, low-CO2 resources like the Permian, Marcellus and Mozambique are well-positioned to dominate future LNG growth. LNG markets are set to treble…
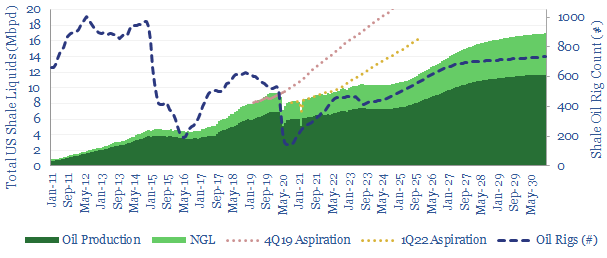
…the Marcellus and Haynesville shale gas plays, using the same framework, in further tabs of the data-file. Amazingly, there is potential to underpin a 100-200MTpa US LNG expansion here, with…
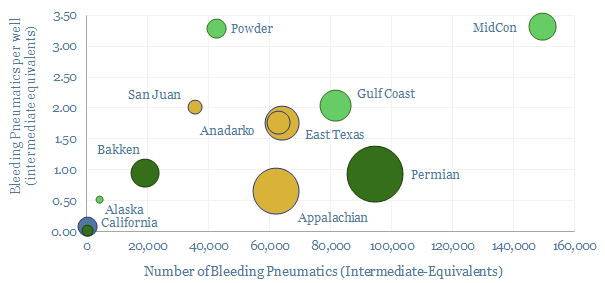
…Ford, while it is lowest in the Marcellus and Utica, at 0.75 pneumatic devices per well, as pure-play gas producers primarily aim to monetize not leak their gas. Methodology. Note…
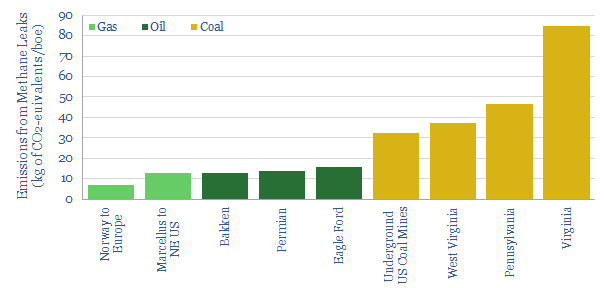
…be much higher for associated gas in oil basins than non-associated gas in gas basins. The Marcellus is the lowest-leak basin in our sample at 0.1%, versus the Permian, Bakken…
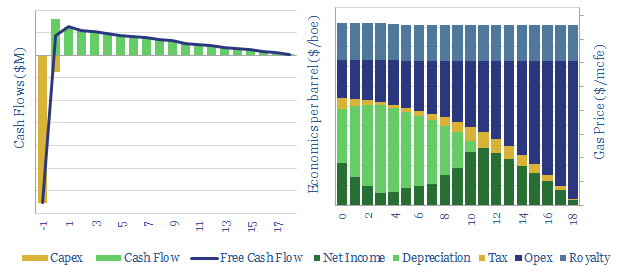
…US shale gas, in order to calculate the NPVs, IRRs and gas price breakevens of future drilling in major US shale basins (predominantly the Marcellus). Underlying the analysis is a…
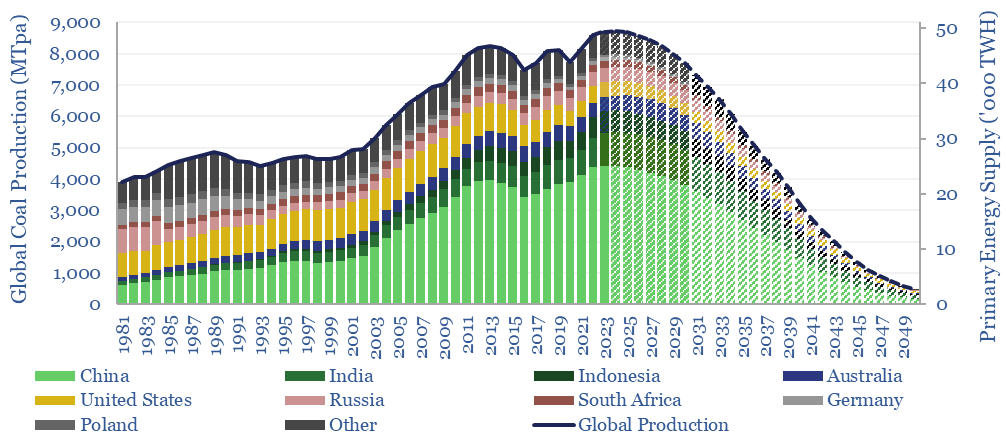
…80bcfd. Thus US coal declined to 500MTpa in 2021. Although questions about the continued phase-back of US coal are now being raised, due to pipeline bottlenecks from the Marcellus, and…
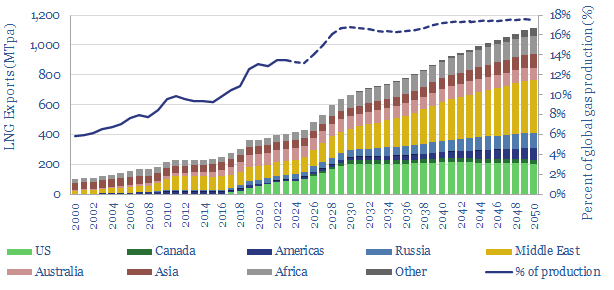
…on E&P activity in the Haynesville, Permian and Marcellus. (7) Longer term supply growth will be dominated by the Middle East, which is particularly well placed to phase out China’s…
…shale forecasts, especially in the Marcellus, and sustain the growth of US gas demand through 2035. Charts and numbers are on pages 17-18. We look forward to discussing and debating…