Demand
-
India: electricity demand and power grid over time?
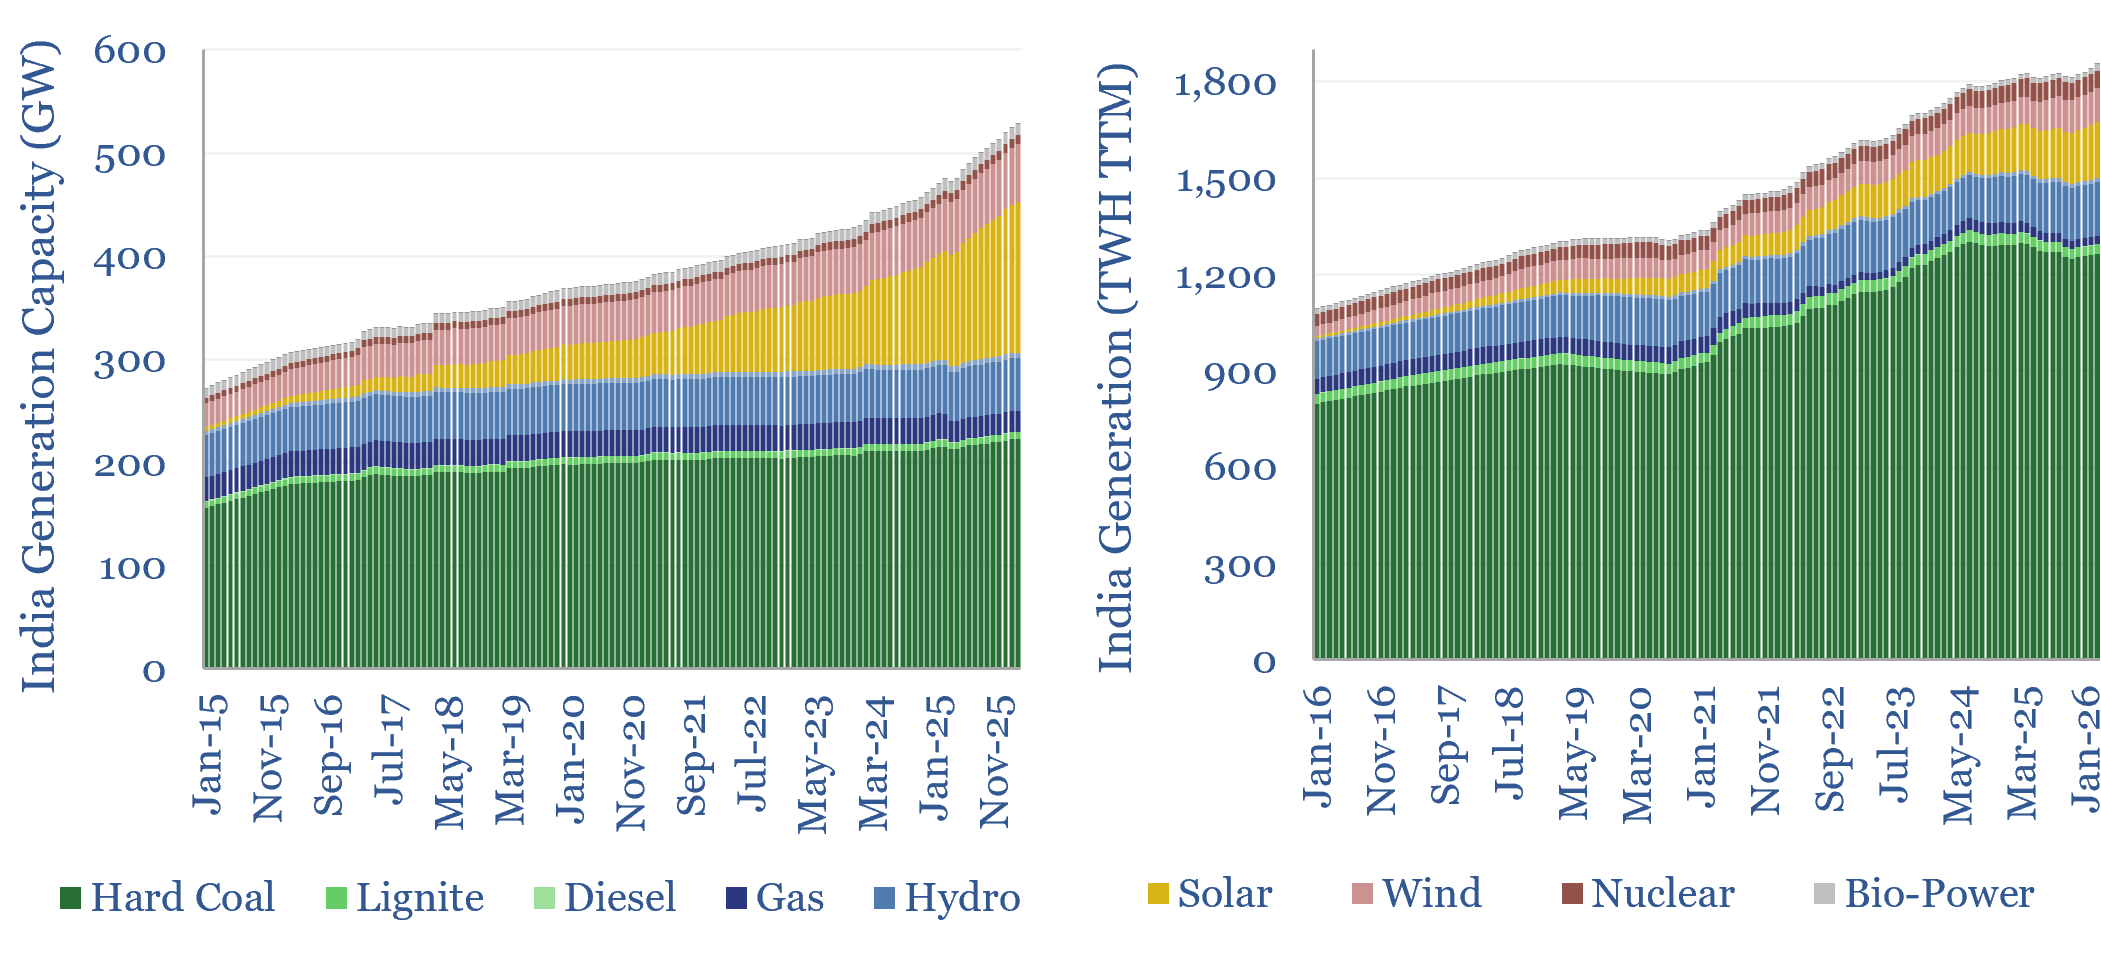
India’s electricity demand is growing by 6-8% (+100-140 TWH) per year, but 75% of the total still comes from coal, which has itself grown at a 6% CAGR in the past half-decade. India seems to be industrializing primarly around coal + solar, in relatively equal proportions?
-
China energy supply-demand model?

This data-file is our China Energy Model and China CO2 Model, disaggregating China’s energy demand by industry, across coal, oil, gas, wind, solar, hydro and nuclear, across c200 lines, from 2000-2060, with 20-input variables that can be stress-tested. By 2050, useful energy demand rises by 38%, electricity demand doubles, and CO2 falls back by 40%.
-
Global oil demand: breakdown by product by country?
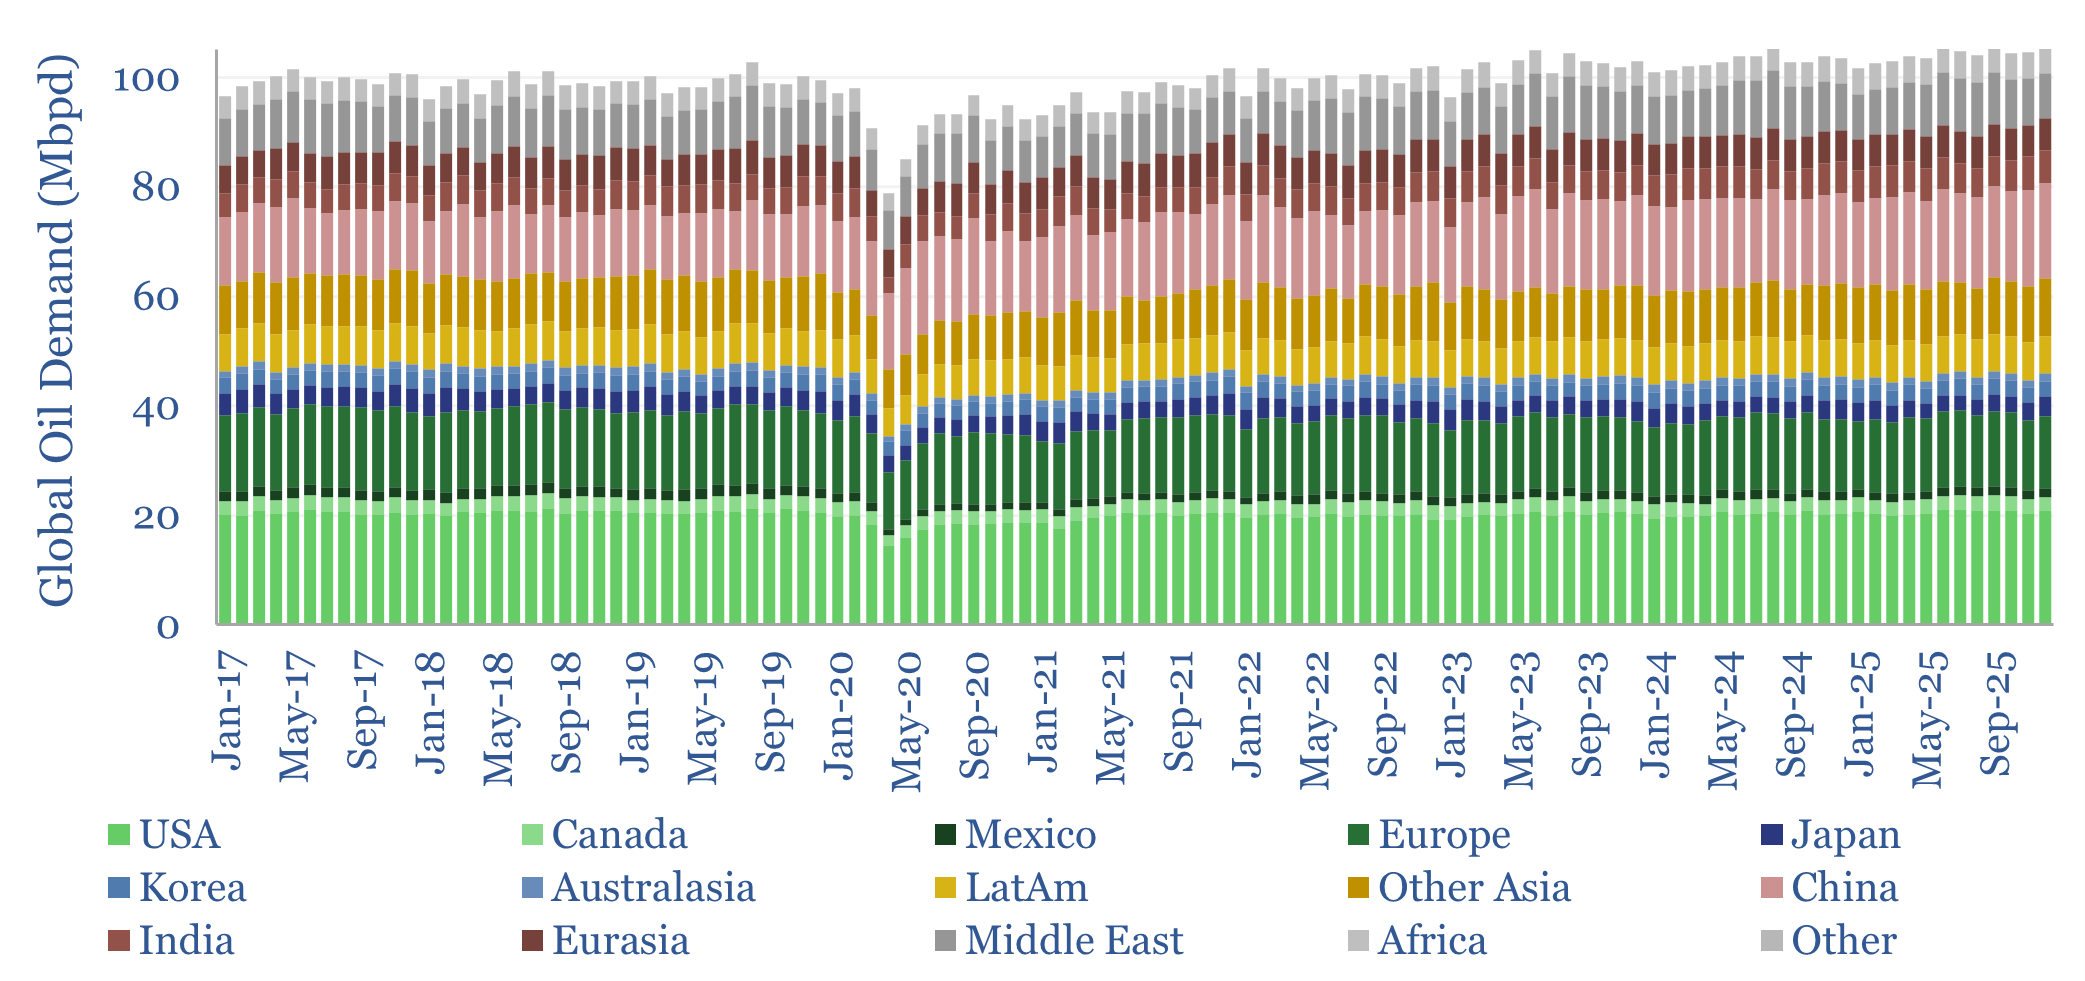
This data-file breaks down global oil demand, country-by-country, product-by-product, month-by-month, across 2017-2025. Global oil demand ran at 104 Mbpd in 2025, for +1.0 Mbpd of growth. For perspective, global oil demand rose at +1.2Mbpd per year in the 30-years from 1989->2019, so there is not much evidence, on face value, that “peak oil is nigh”.
-
Flexible data centers: can AI load shift?
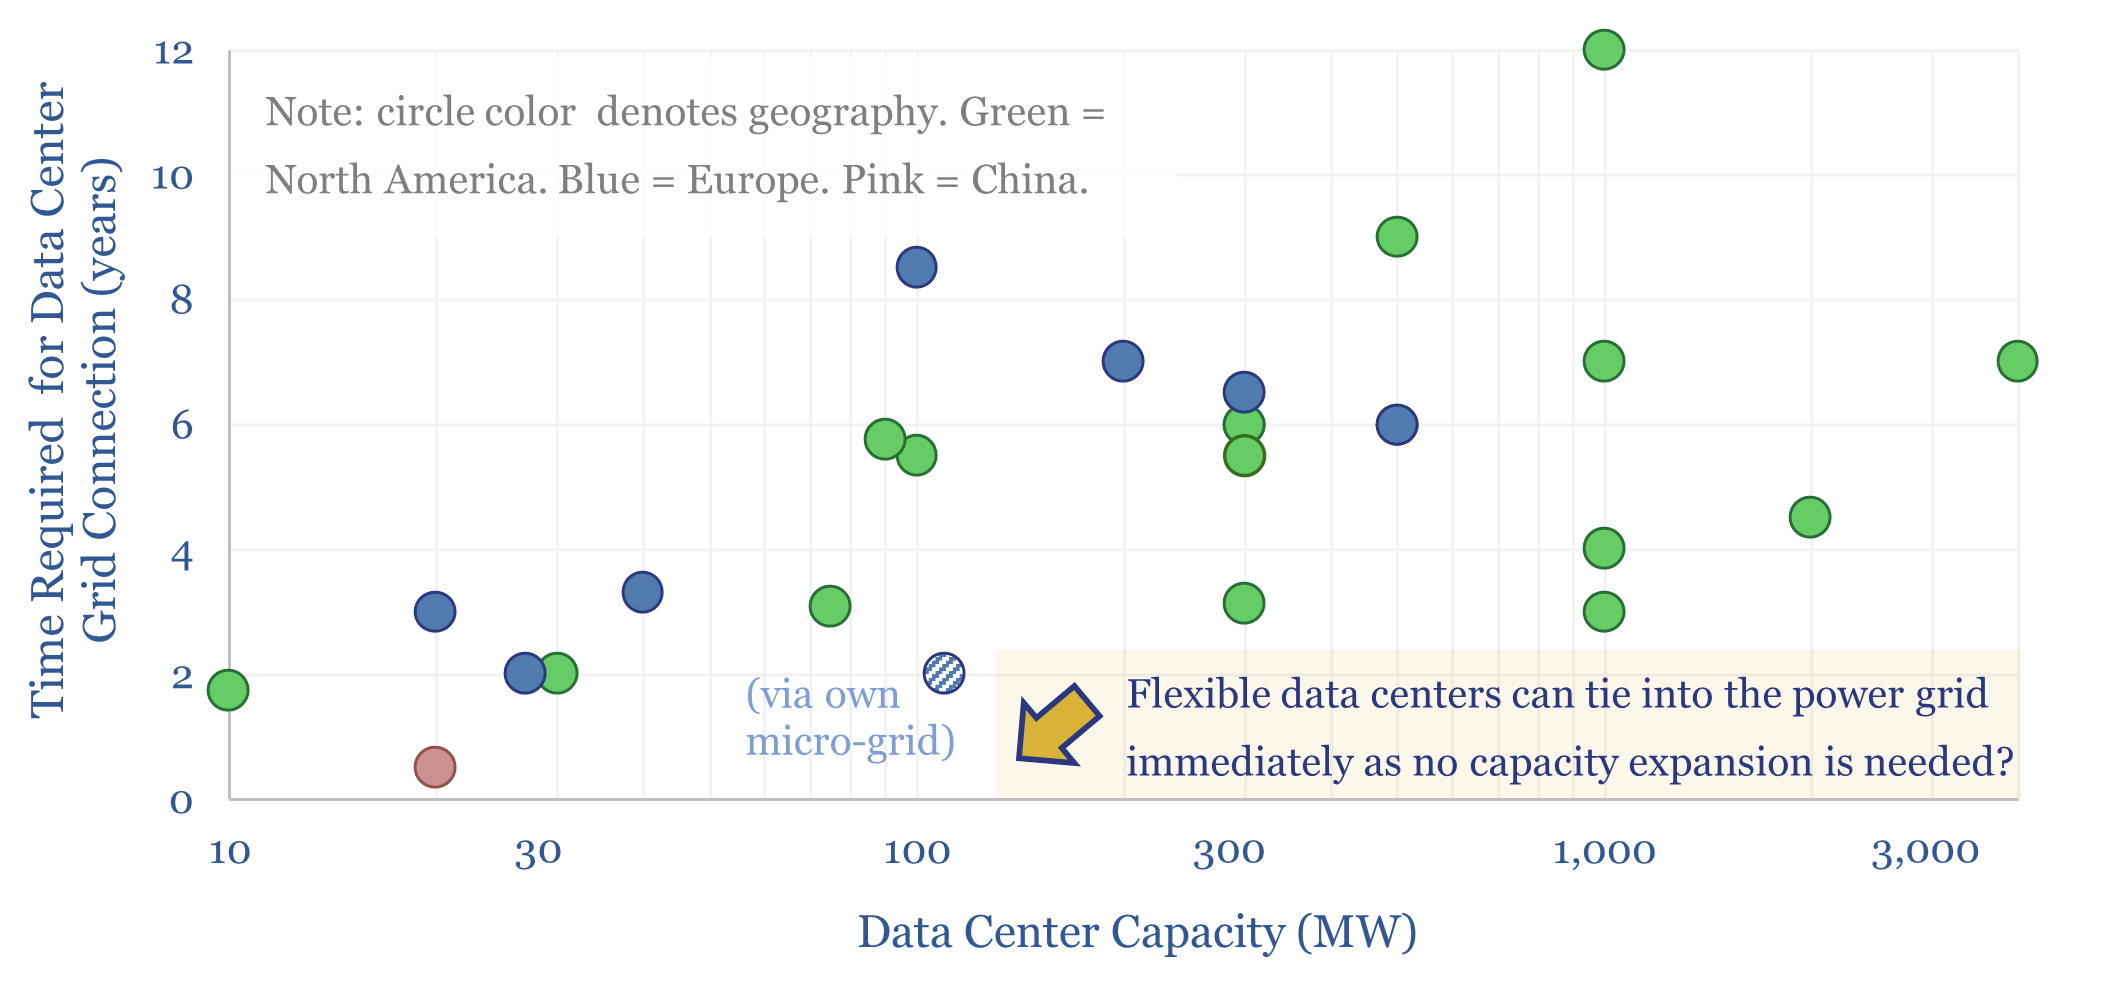
It can take 4-12 years to expand the grid and accommodate large new AI data centers. But what if more flexible data centers could be energized mostly via the pre-existing grid? This 15-page report shows how flexible AI data centers, which engage in demand shifting, are technically feasible, economically justified, and accelerating?
-
LNG bunkering vessel economics?
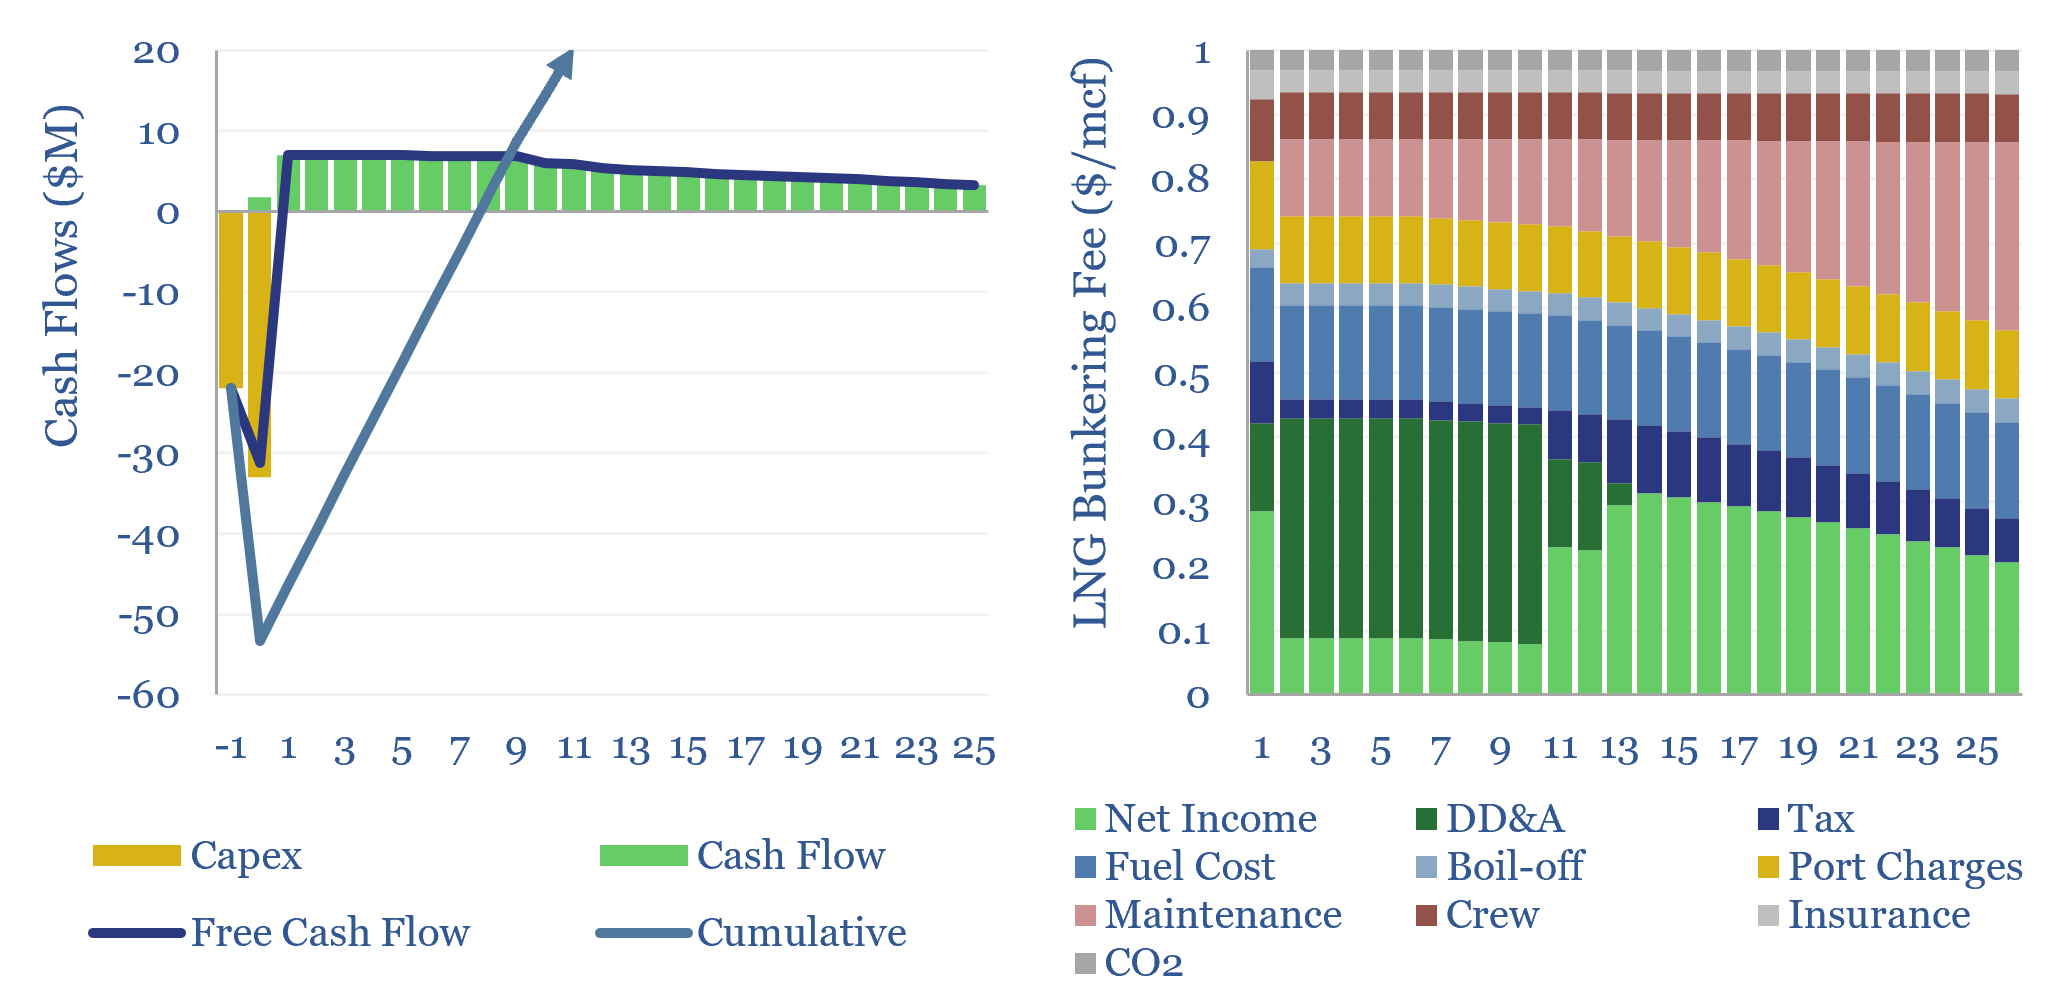
This data-file captures the economics of LNG bunkering vessels. LNG bunkering costs $1/mcf in well-utilized contexts, enabling LNG ship fueling at $8-10/mcf, which is 35% below $2/gal oil products at $70/bbl oil. A 1.5-year payback on dual-fuel vessels could thus see another 10MTpa of LNG used in shipping by 2030, displacing 250kbpd of oil?
-
Electric ships: worse things have happened at sea?
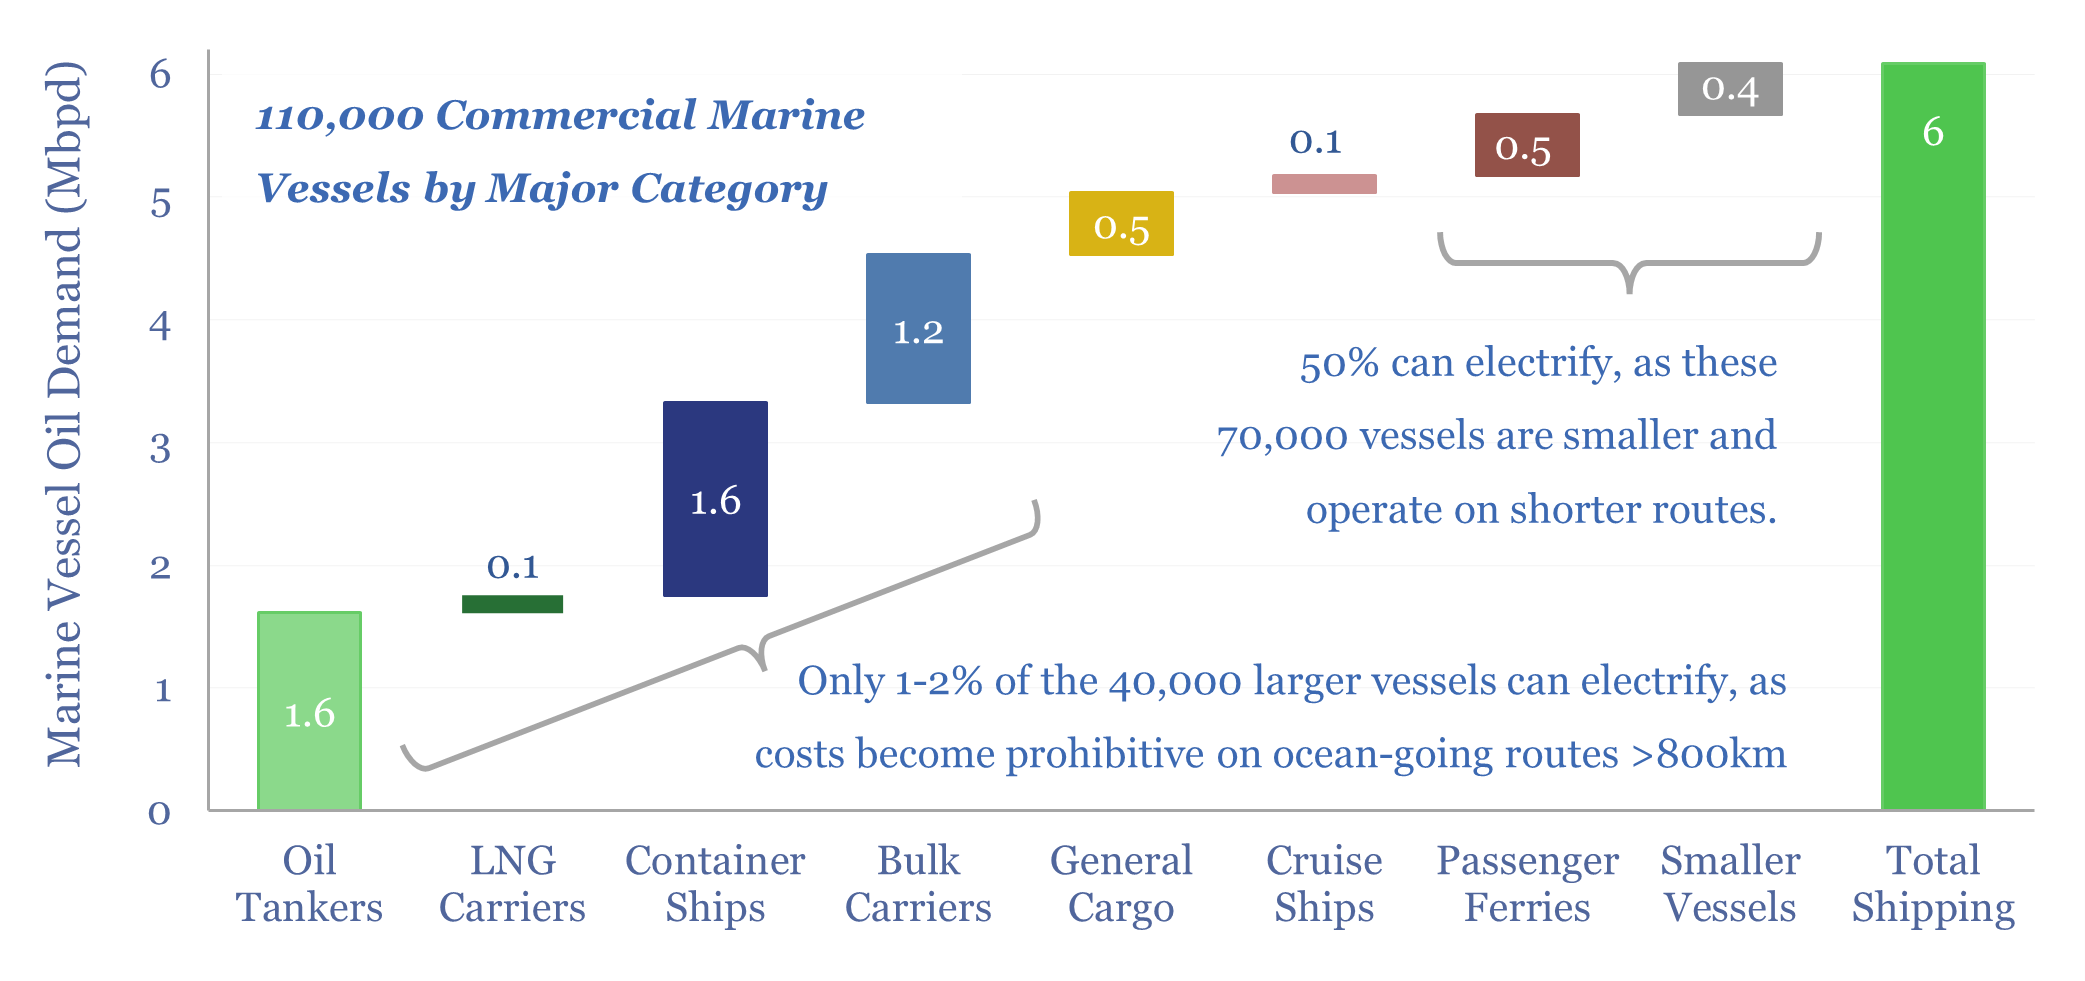
Over 15% of the world’s marine vessels could electrify in the next decade, accelerated by higher oil prices, and as Europe/Asia seek self-sufficiency. This 16-page report explores leading concepts, 30 flagship deployments to-date, the economics, and the implications for companies/commodity markets.
-
Electric ships: costs and case studies?
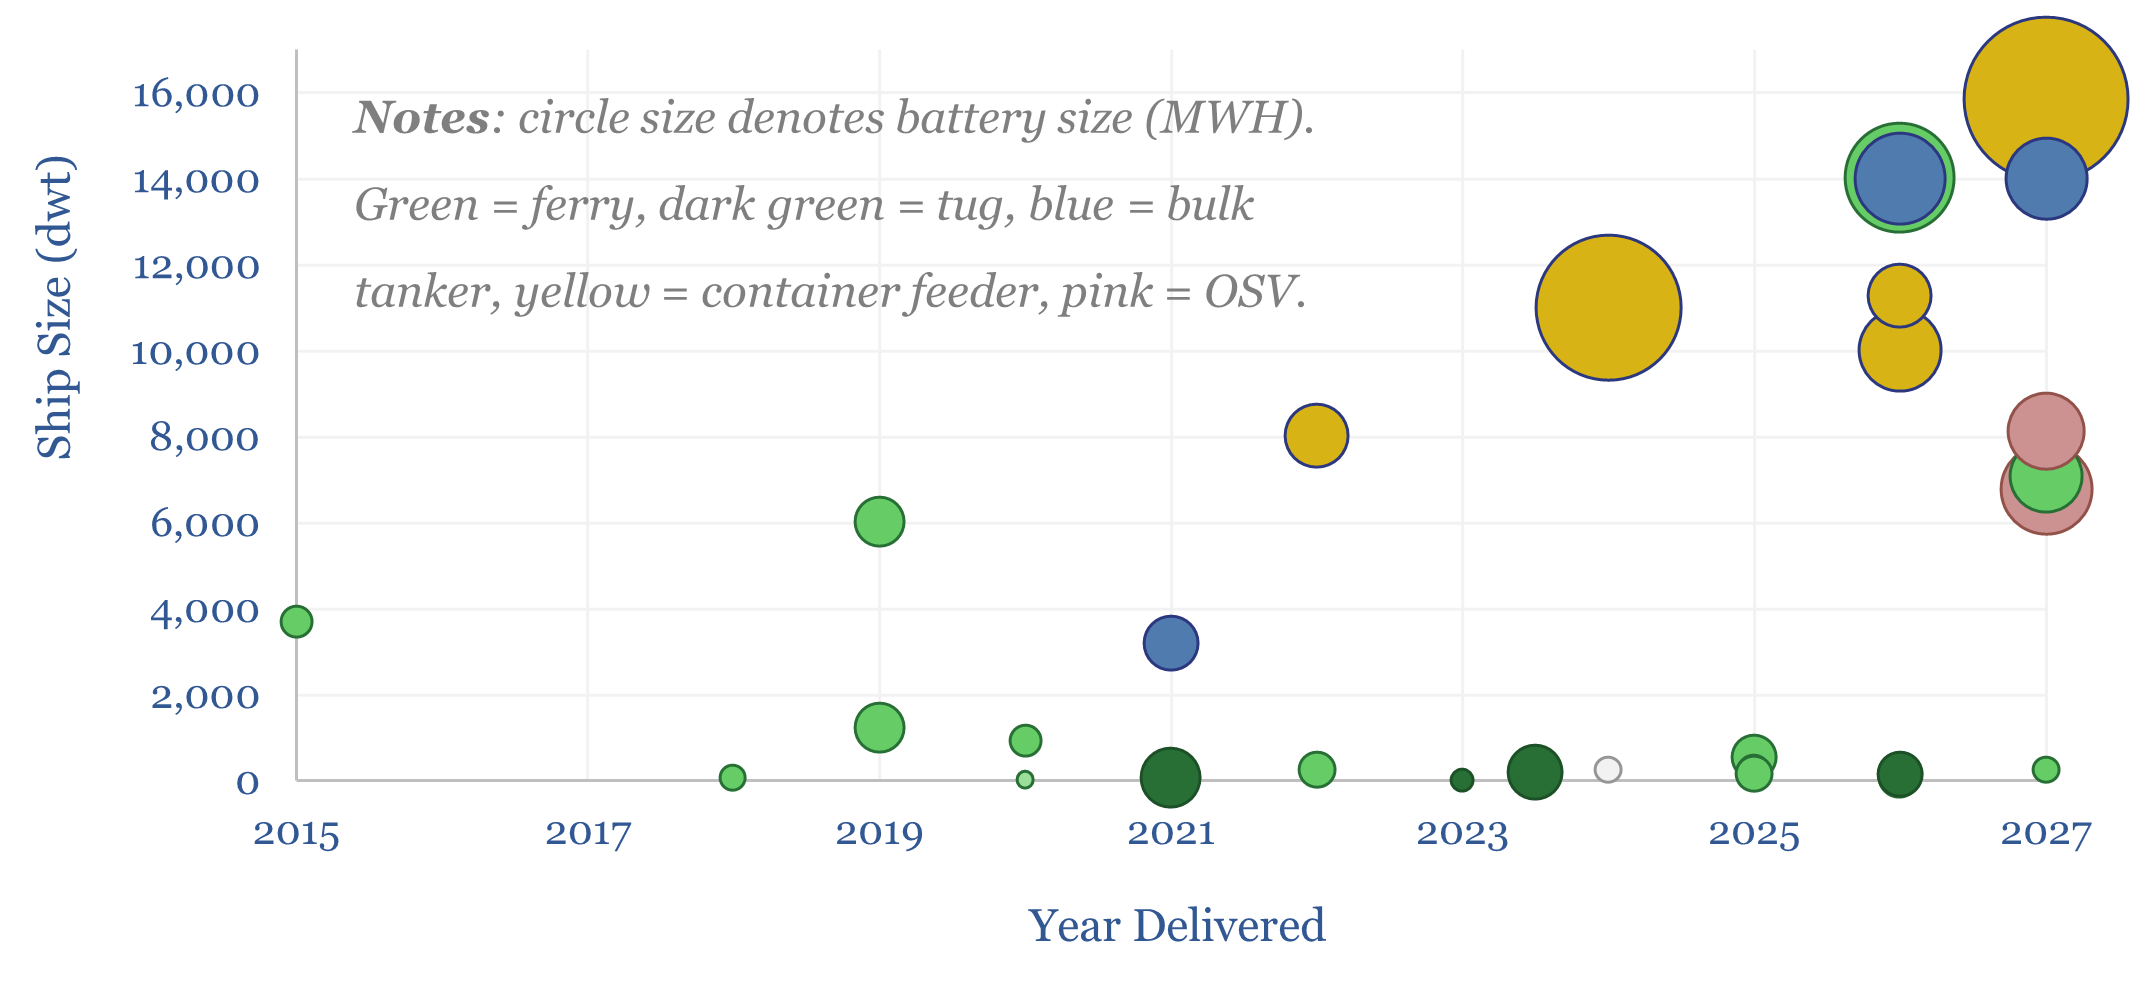
Over 1,000 electric ships have now been deployed globally. Mostly small-scale. This data-file profiles 30 case studies of electric ships (on the examples tab) and compares the costs of large electric ships against 20,000 TEU container vessels that would otherwise be fueled by marine diesel.
-
US electricity demand: by sector, by use, over time?
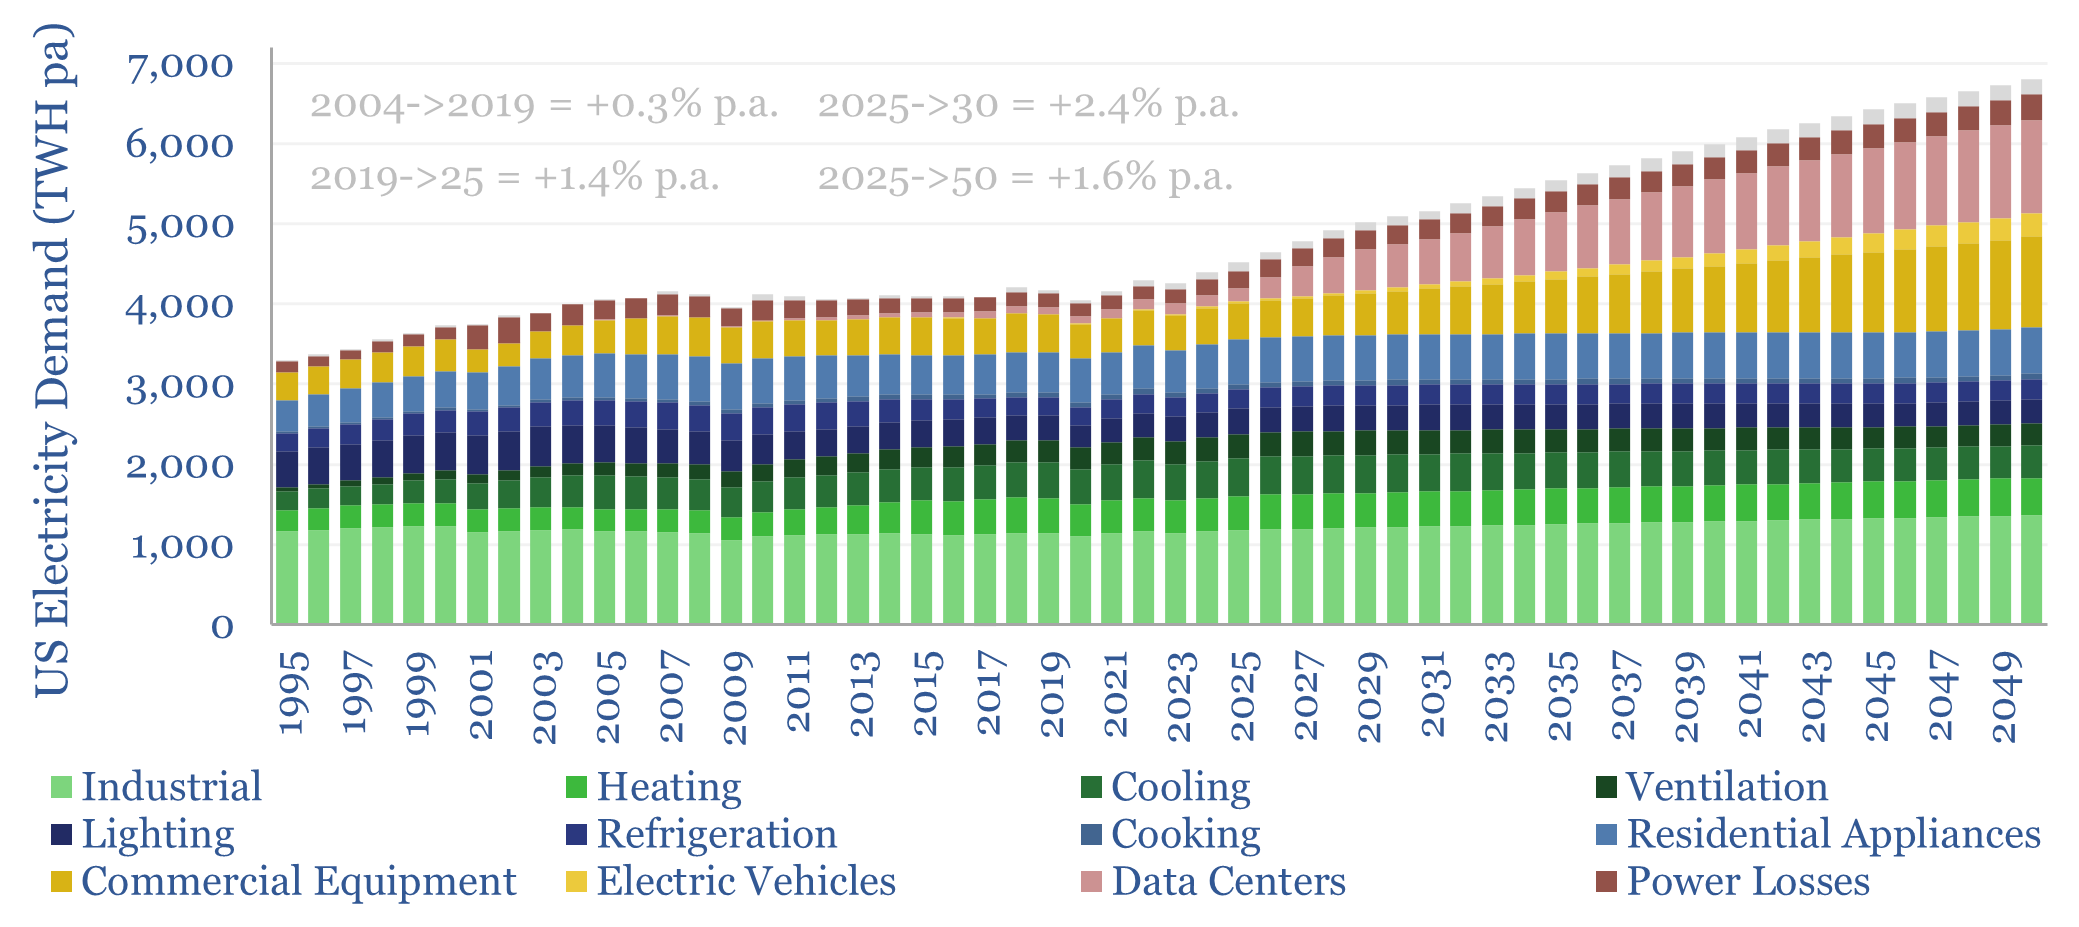
US electricity sales reached 4,430 TWH in 2024, rising +3% YoY, and bringing the trailing ten-year CAGR to 1% pa. The current breakdown is 37% residential, 37% commercial, 26% industrial. All three are now growing. To help understand load growth, this data-file is a breakdown of US electricity demand by sector, by use and over…
-
MOSFETs: energy use and power loss calculator?
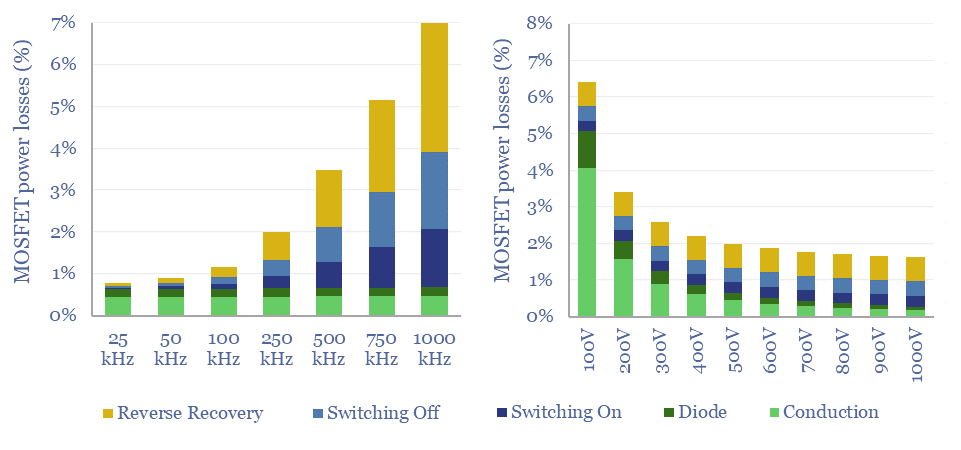
MOSFETs are fast-acting digital switches, used to transform electricity, across new energies and digital devices. MOSFET power losses are built up from first principles in this data-file, averaging 2% per MOSFET, with a range of 1-10% depending on voltage, switching, on resistance, operating temperature and reverse recovery charge.
-
US energy model: oil, gas, power and CO2?
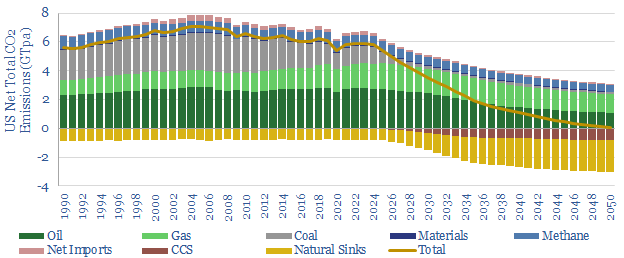
The US consumes 25,000 TWH of primary energy per year, which equates to 13,000 TWH of useful energy, and emits 6GTpa of CO2. This model captures our best estimates for how the US energy system will involve, across oil, gas, coal, nuclear, wind, solar and efficiency gains, and thus the trajectory of CO2 emissions through…
Content by Category
- Batteries (96)
- Biofuels (44)
- Carbon Intensity (48)
- CCS (64)
- CO2 Removals (9)
- Coal (43)
- Commentary (65)
- Company Diligence (105)
- Data Models (927)
- Decarbonization (162)
- Demand (131)
- Digital (89)
- Downstream (47)
- Economic Model (222)
- Energy Efficiency (76)
- Hydrogen (63)
- Industry Data (310)
- LNG (56)
- Materials (86)
- Metals (89)
- Midstream (45)
- Natural Gas (162)
- Nature (76)
- Nuclear (28)
- Oil (177)
- Patents (39)
- Plastics (44)
- Power Grids (156)
- Renewables (153)
- Screen (138)
- Semiconductors (35)
- Shale (58)
- Solar (72)
- Supply-Demand (53)
- Vehicles (94)
- Video (24)
- Wind (46)
- Written Research (408)