Power Grids
-
Gas generation: timing the cycle?
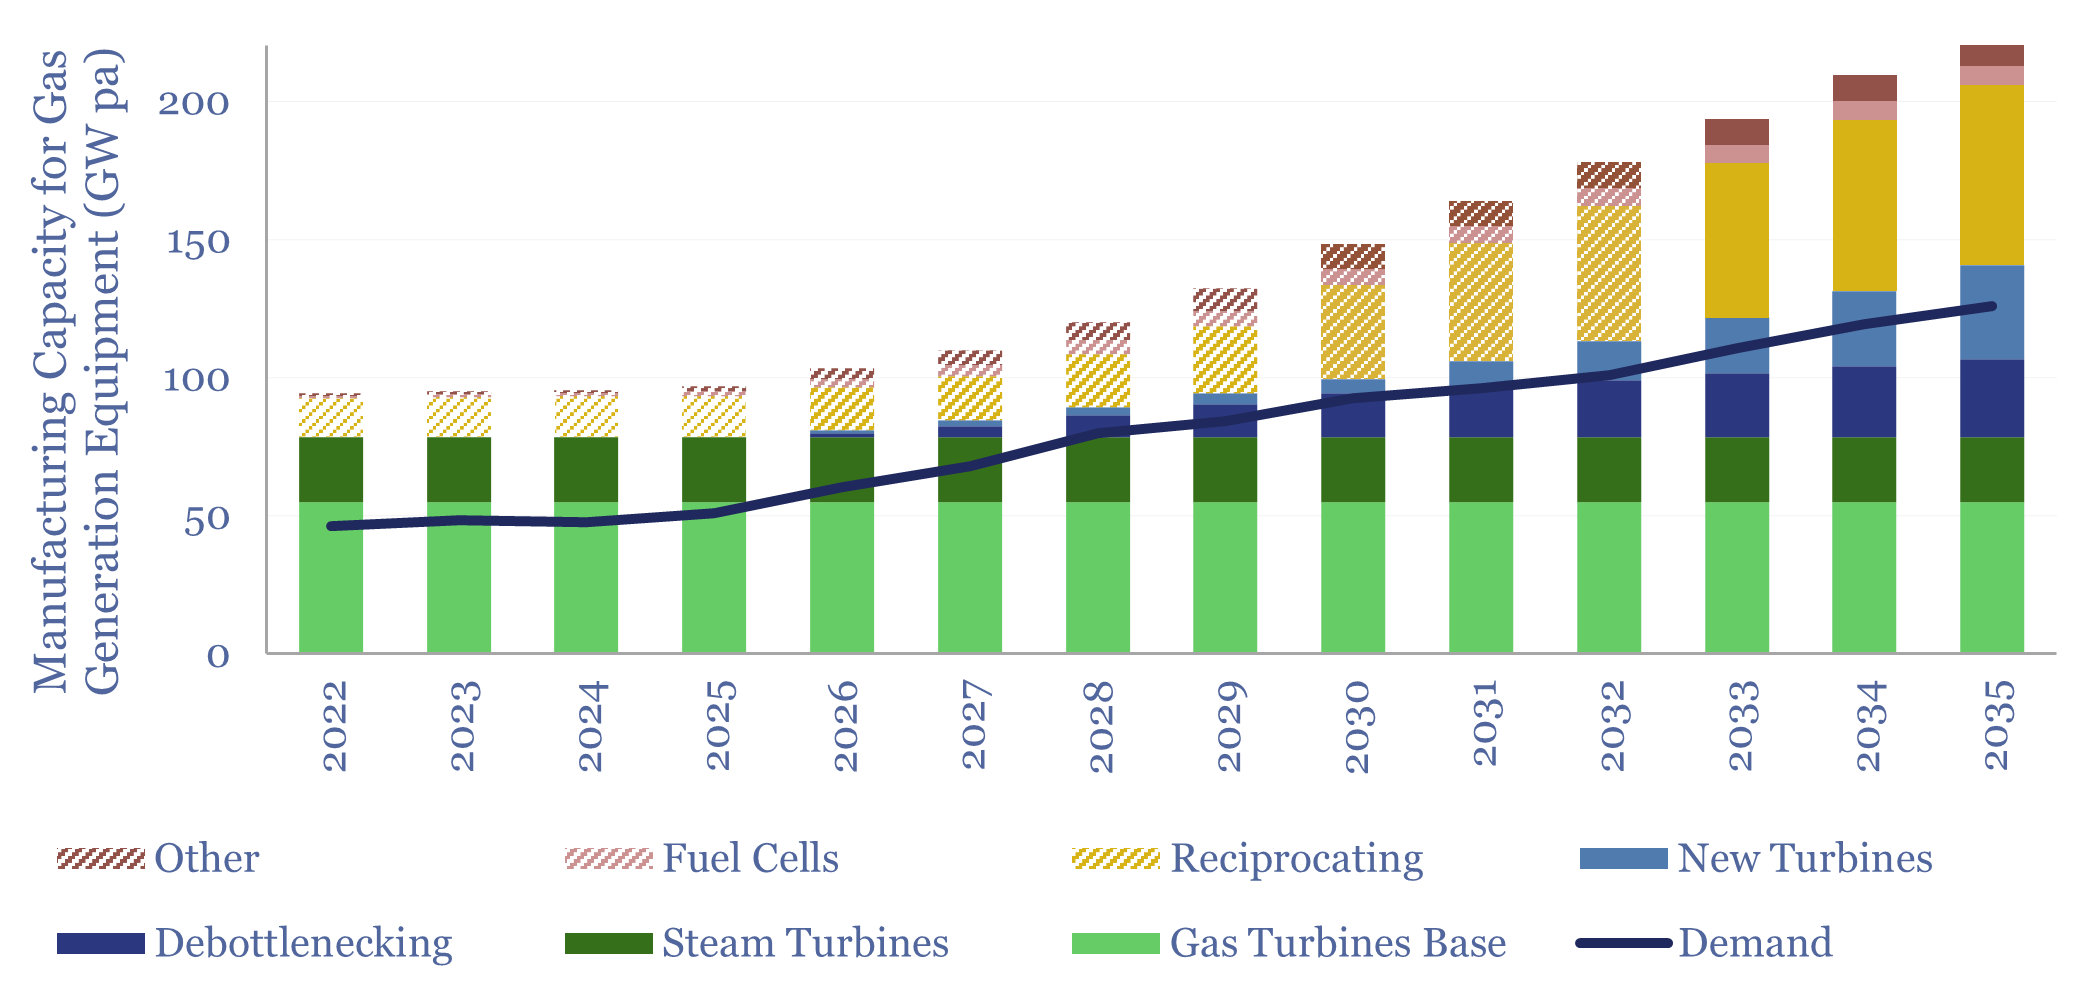
Gas-fired power generating capacity is in a classic capital cycle. This 16-page report evaluates when the cycle will peak. Gas power demand wants to rise at 3.8% pa through 2050. But high CCGT prices may delay EM growth, bring in new entrants, and substitution towards reciprocating engines.
-
US power generation under development over time?
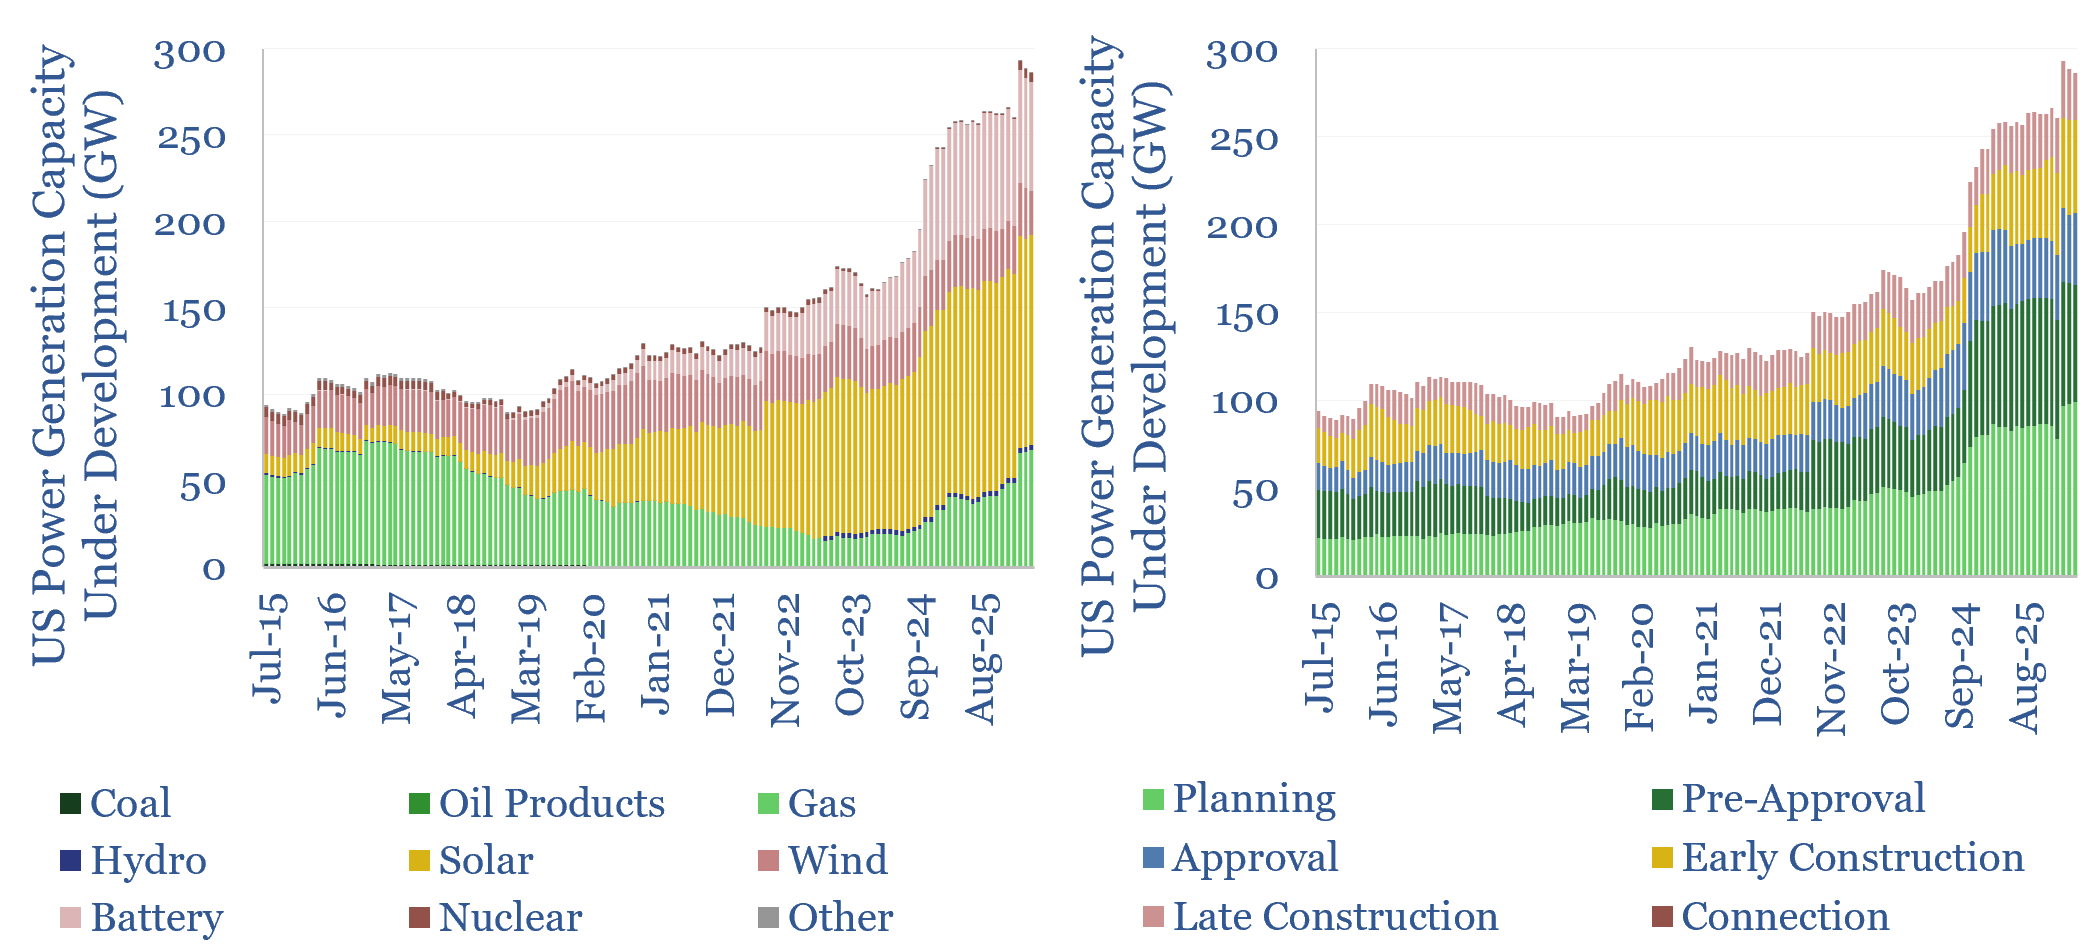
An all-time record of 260GW of new power generation capacity is currently under development in the US in 4Q25, enough to expand the US’s 1.3TW power grid by almost 15%. This data-file tracks US power generation under development, as a leading indicator for gas turbine, wind, solar and battery demand. The pipeline suggests tight power…
-
AI power delivery: hit by a bus?

Providing power to AI data centers was a key theme in 2025. But distributing power within them may be just as important for 2026+. More power-dense AI chips require upgrading in-rack buses from 54V to 800V. This 14-page report explores the challenges and opportunities of future AI power delivery architectures.
-
Global power price volatility tracker?
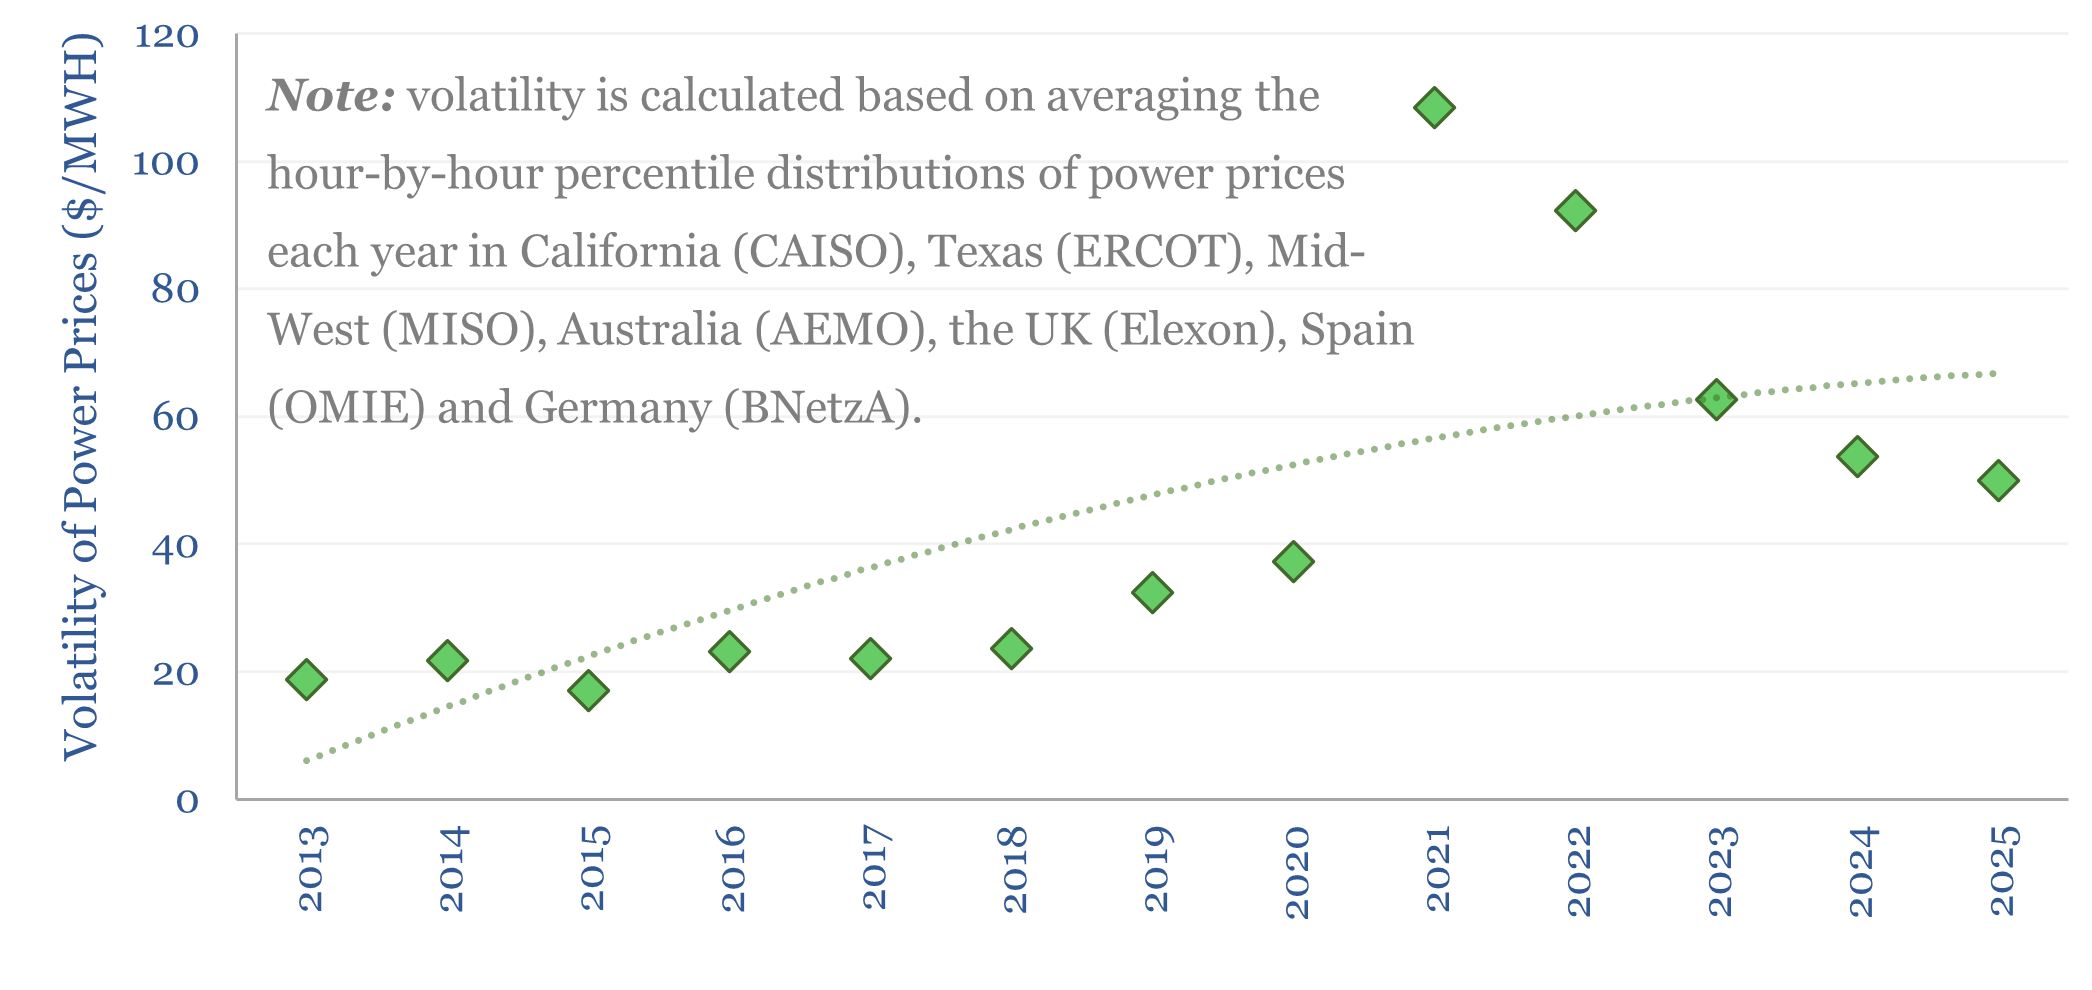
The volatility of power grids almost trebled in the decade from 2013-15 to 2023-2025, but actually eased back from 2022 to 2025. This data-file tracks the percentile-by-percentile distributions of power prices, each year, in seven major grid regions (Texas, California, US MidWest, Australia, the UK, Spain, and Germany) as an index of global power price…
-
Power cables: carrying capacity and loss rates?
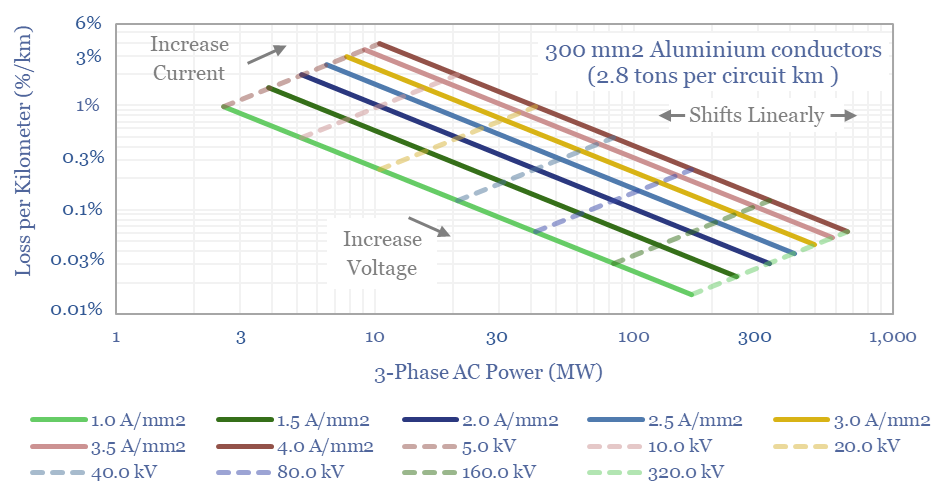
This data-file calculates the power carrying capacity of power cables, plus the resistive losses of power cables. Both are modeled as a function of their voltage, current density, copper and/or aluminium content, resistance and connection type. Underlying data are drawn from data we have tabulated on over 100 conductors, their ratings and costs.
-
Power cuts: how frequent are grid disruptions?

This data-file aggregates significant US power grid disruptions, based on data from the DOE. On average, there are 250 power cuts per year in the United States, lasting for a median average of 5-hours, and affecting a median average of 80,000 customers. 20% of the power cuts last longer than 1-day. 15% affect more than…
-
Power markets: classical economics?

This 15-page report outlines how wholesale power markets work, which helps to understand four emerging controversies. Wholesale power prices are governed by classic microeconomics: day-ahead markets clear at the intersection of downward sloping demand curves and upward sloping supply curves.
-
Electricity pricing: time-of-use tariffs by region?

Time-of-use tariffs mean end customers’ electricity prices are not fixed, but vary across time. ToU tariffs can reduce peak power demand by 10% on average. This data-file tracks the share of customers with time-of-use tariffs, by region, and then focuses in on interesting countries.
-
Power electronic capital goods: margins over time?
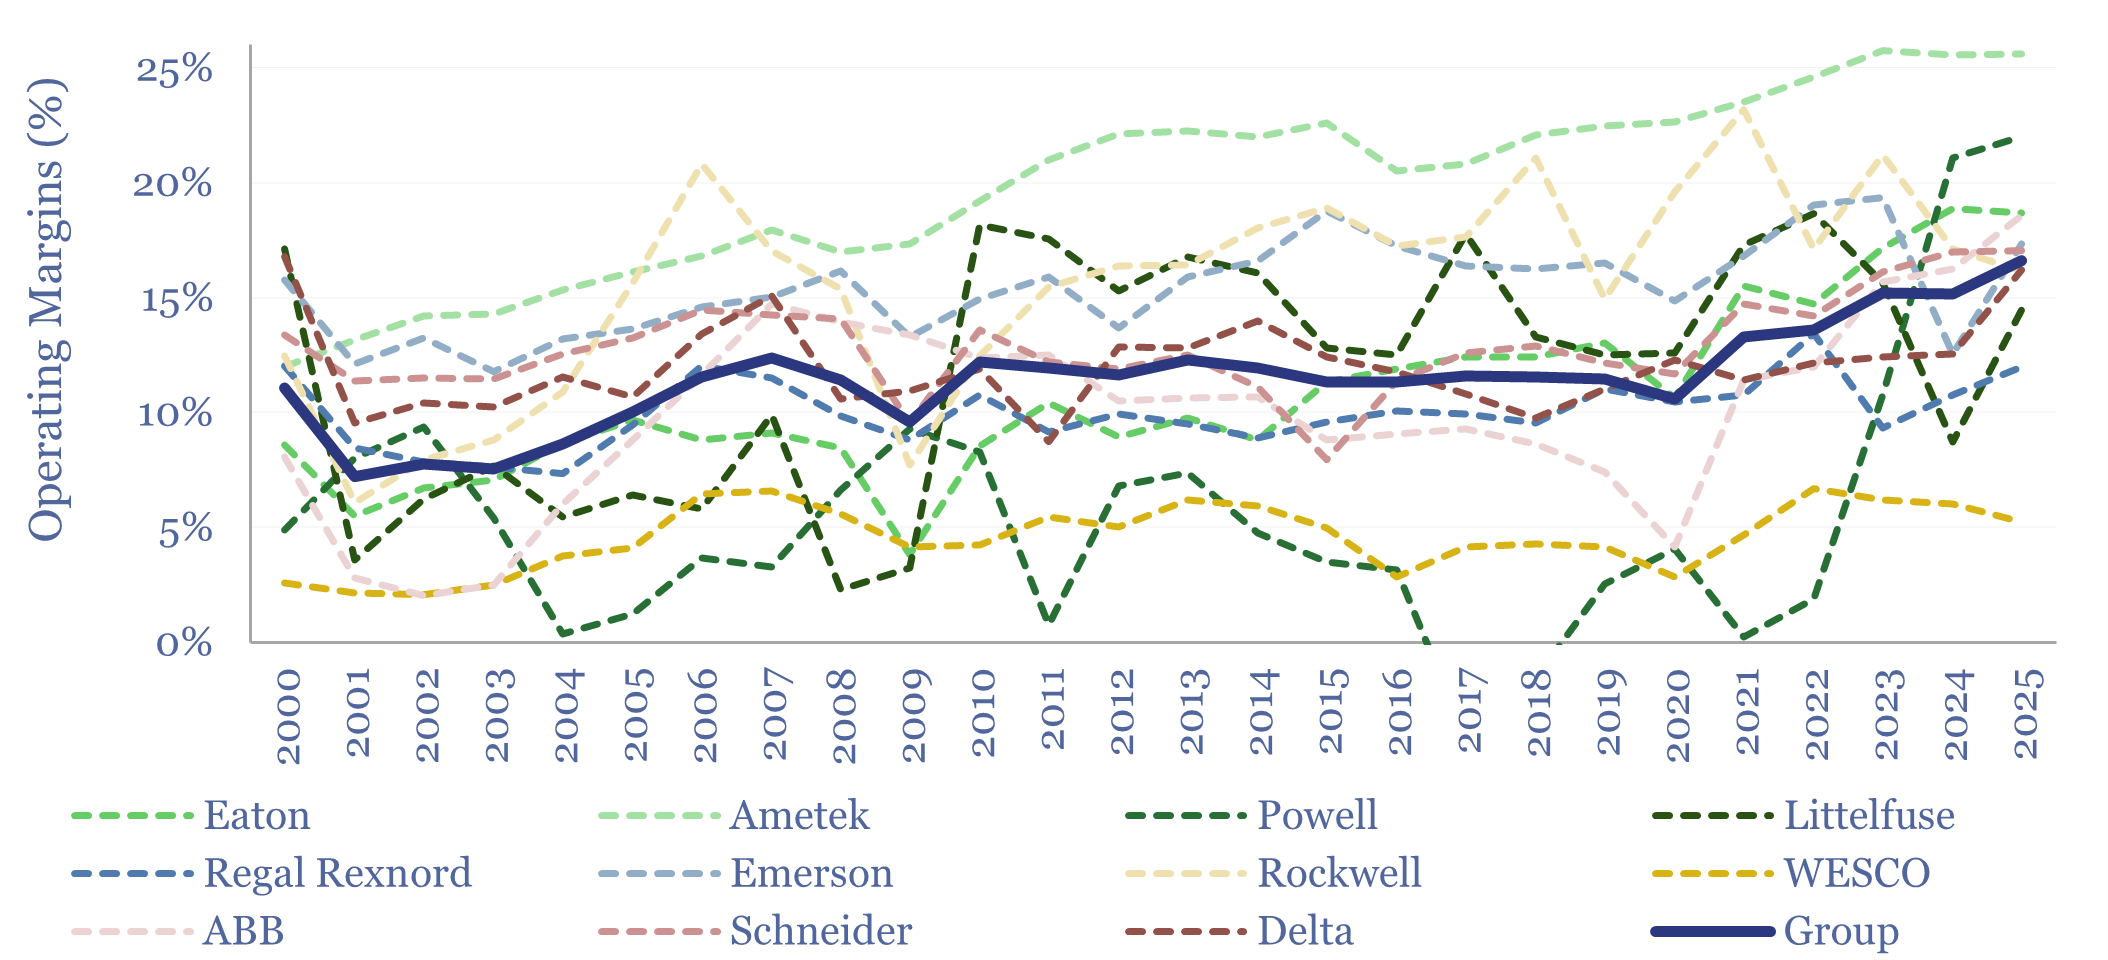
This data-file tracks power electronic capital goods company margins over time, rising from 10% in 2000-2010, to 12% in 2010-20 and then inflecting to a record 16% in 2025. The increase is mostly driven by higher- and medium-voltage categories, linked to re-accelerating load growth in the United States. Details on each company are in the…
-
Industrial heat pump costs: economic model?
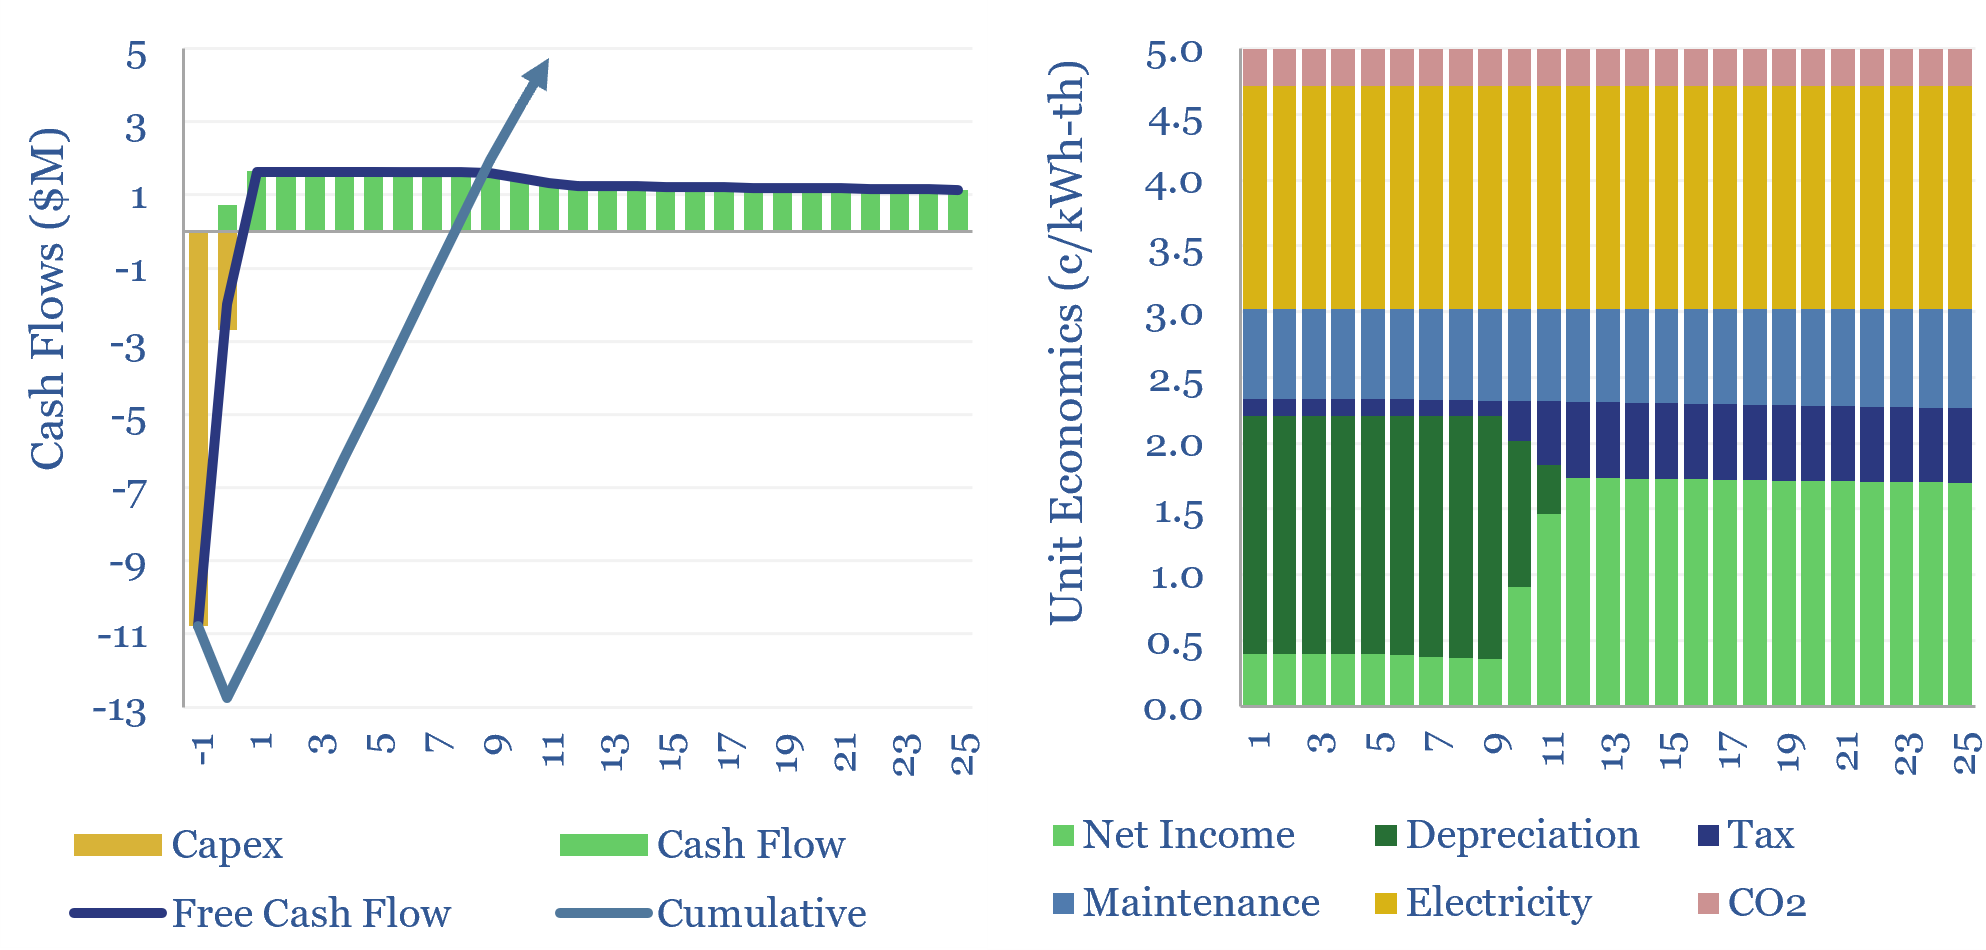
Industrial heat pump costs typically average 5c/kWh-th, when generating round-the-clock heat from 6c/kWh electricity, with a 3.5x Coefficient of Performance, and achieving a 60ºC heat lift. Our models do not yet show heat pumps, energized by excess renewables, outcompeting gas heat, especially for larger or higher-temperature applications. Costs can be stress-tested in this model.
Content by Category
- Batteries (96)
- Biofuels (44)
- Carbon Intensity (48)
- CCS (64)
- CO2 Removals (9)
- Coal (41)
- Commentary (65)
- Company Diligence (105)
- Data Models (924)
- Decarbonization (162)
- Demand (131)
- Digital (88)
- Downstream (47)
- Economic Model (221)
- Energy Efficiency (76)
- Hydrogen (63)
- Industry Data (308)
- LNG (56)
- Materials (86)
- Metals (88)
- Midstream (45)
- Natural Gas (161)
- Nature (76)
- Nuclear (28)
- Oil (176)
- Patents (39)
- Plastics (44)
- Power Grids (156)
- Renewables (153)
- Screen (138)
- Semiconductors (35)
- Shale (58)
- Solar (72)
- Supply-Demand (53)
- Vehicles (94)
- Video (24)
- Wind (47)
- Written Research (408)