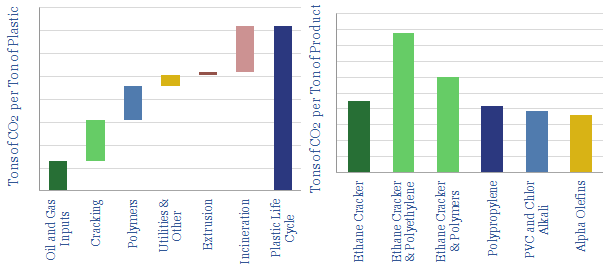
The energy intensity of plastic products and the CO2 intensity of plastics are built up from first principles in this data-file. Virgin plastic typically embeds 3-4 kg/kg of CO2e. But compared against glass, PET bottles embed 60% less energy and 80% less CO2. Compared against virgin PET, recycled PET embeds 70% less energy and 45% less CO2. Aluminium packaging is also highly efficient.
Global plastics production now stands at 500MTpa and will likely rise to 1GTpa by 2050, in our models of global plastics use. So, what is the energy and CO2 intensity of plastics and plastic products?
Answering this question is actually quite complicated. To see why, consider the complexity of the value chain shown below, which captures the PET used in a standard plastic water bottle. Our sense is that there are a lot of LCA studies out there, but most of them are simply guessing at an end number, without doing the necessary work on each step of the process.
Our own attempt, in this data-file, draws from our economic models into oil production, gas production, gas fractionation to ethane, ethane cracking to ethylene, oil refining to naphtha, naphtha cracking to PX, PX oxidation to PTA, make-up methanol solvent, PET production, CO2 intensity of trucking, then additional data are gathered into the production of ethylene oxide, ethylene glycol, condensation polymerization into PET and injection molding into bottles.
It is a wonderfully complex overall-build-up, which makes a mockery of the idea that there is some immutable number for the CO2 intensity of plastics. Clearly, there is scope for variation within all of the industrial processes described above. Nevertheless, we can construct a base case for the energy intensity and CO2 intensity of PET bottles, as a nice case study. And all of the numbers can be varied and stress-tested in the model.
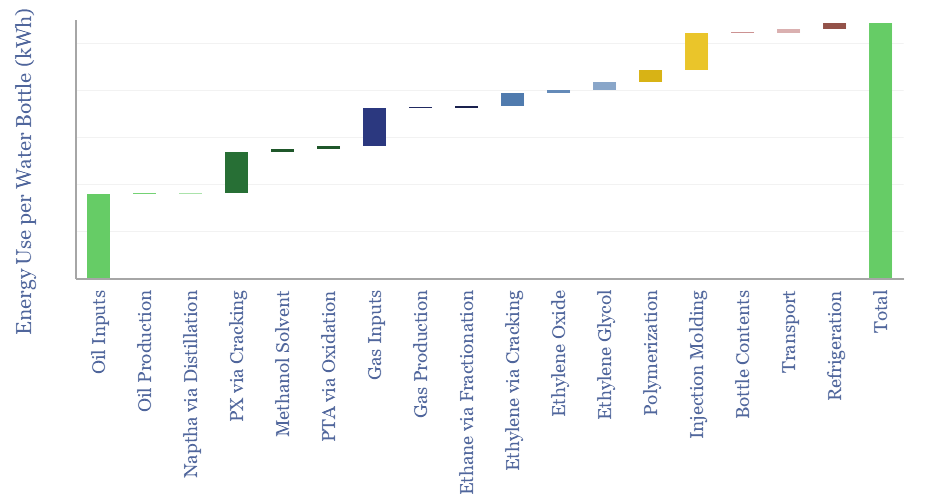
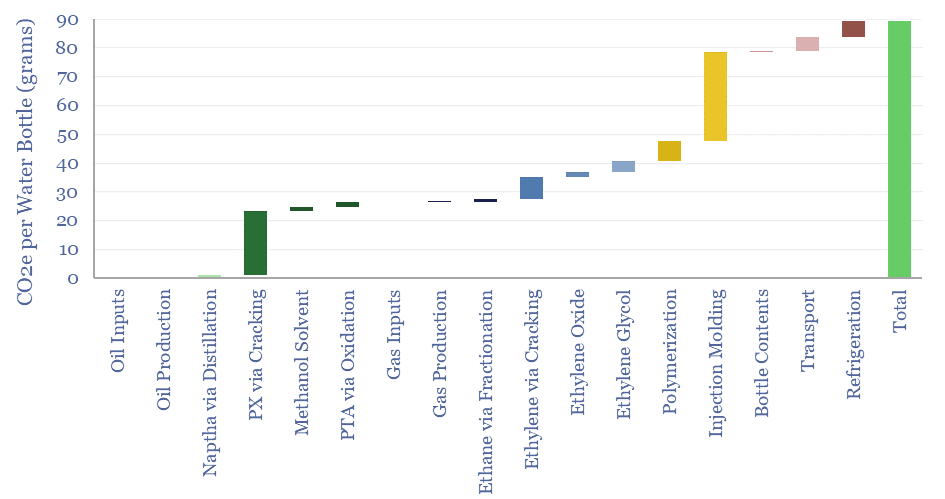
Our conclusion is that a cold, 500ml PET bottle that is pulled out of the fridge and enjoyed contains 23 grams of plastics, embeds 0.7 kWh of primary energy and about 90 grams of CO2. If the same bottle was made from recycled PET, then it would embed 0.2 kWh of energy and 40 grams of CO2. The energy saving is 70%, although the steps of injection molding, transport and refrigeration are common to both processes.
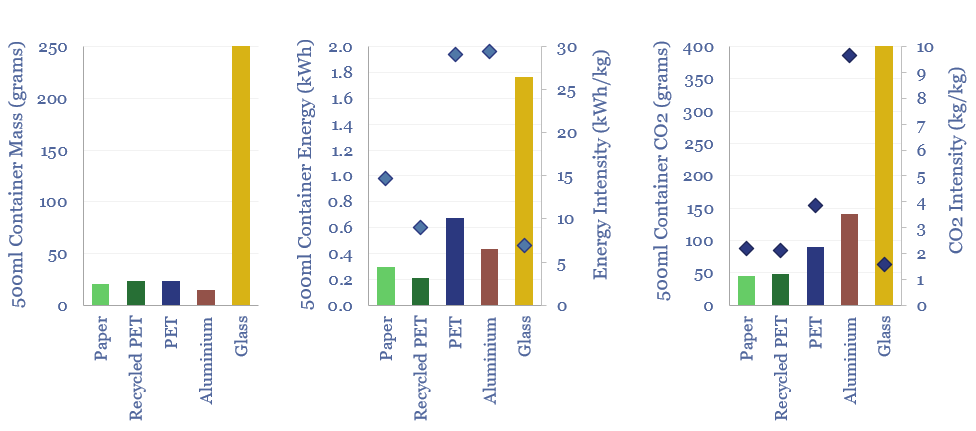
Plastic bottles embed 60% less energy and 80% less CO2 than glass bottles, within our build-up, and holding all other variables equal. The key reason is mass. A 500ml PET bottle might weigh 23 grams while a 500ml glass bottle weighs 250 grams, over 10x more. And the deltas would be ever starker with longer transportation distances. Plastic packaging is not the root of all evil!
Aluminium packaging can also be highly energy and CO2-efficient. We have assumed a global average grade of aluminium, embedding about 9 tons of CO2 per ton of aluminium, but note there is also a wide distribution of CO2 intensities among different aluminium producers. But the lowest CO2 and energy use is found for paper packaging.
Granular data are also tabulated on 70 chemicals facilities around the US, using EPA FLIGHT data. Most facilities are not directly comparable. However, we have derived meaningful CO2 intensity data (per ton of product) for c20 of them. We find large and integrated petchem facilities tend to be more efficient (chart below).
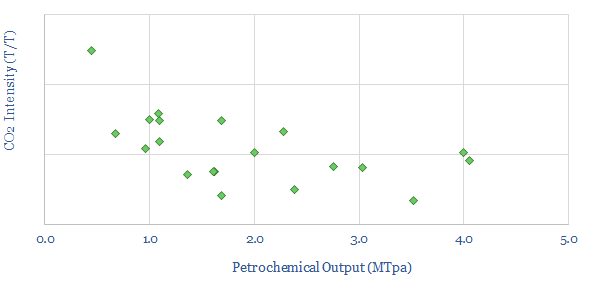
Generally, the CO2 intensity of plastic products will run to about 3-4 tons/ton, using other broader-brush build-ups in the data-file, which draw on the reported CO2 emissions from actual petrochemical facilities. Differences are also visible in different plastic products, on one of the model’s tabs (charts below).
