This data-file is a screen of 16 leading listed downstream companies, with 16Mbpd of refining capacity, currently valued at $200bn on an EV basis. Refining margins, costs, complexity, utilization and split between other business activities are summarized in the data-file.
The average downstream company in the data-file has 1Mbpd of refining capacity, with 10x Nelson Complexity Index, ran at 88% utilization in 2024, and thus generated $4.2/bbl in EBITDA, $3/bbl in EBIT margins, $2/bbl in net margins, and spent $2.5/bbl in capex.
Our peer group of downstream oil companies is 60% exposed to refining, on average, with a range from 15% to 90%. Other common business activities include fuel retail, petrochemicals, lubricants, pipelines, NGL fractionation, gas and power sales, and increasingly, biofuels, bioethanol, renewable diesel, SAF, power generation, and EV charging.
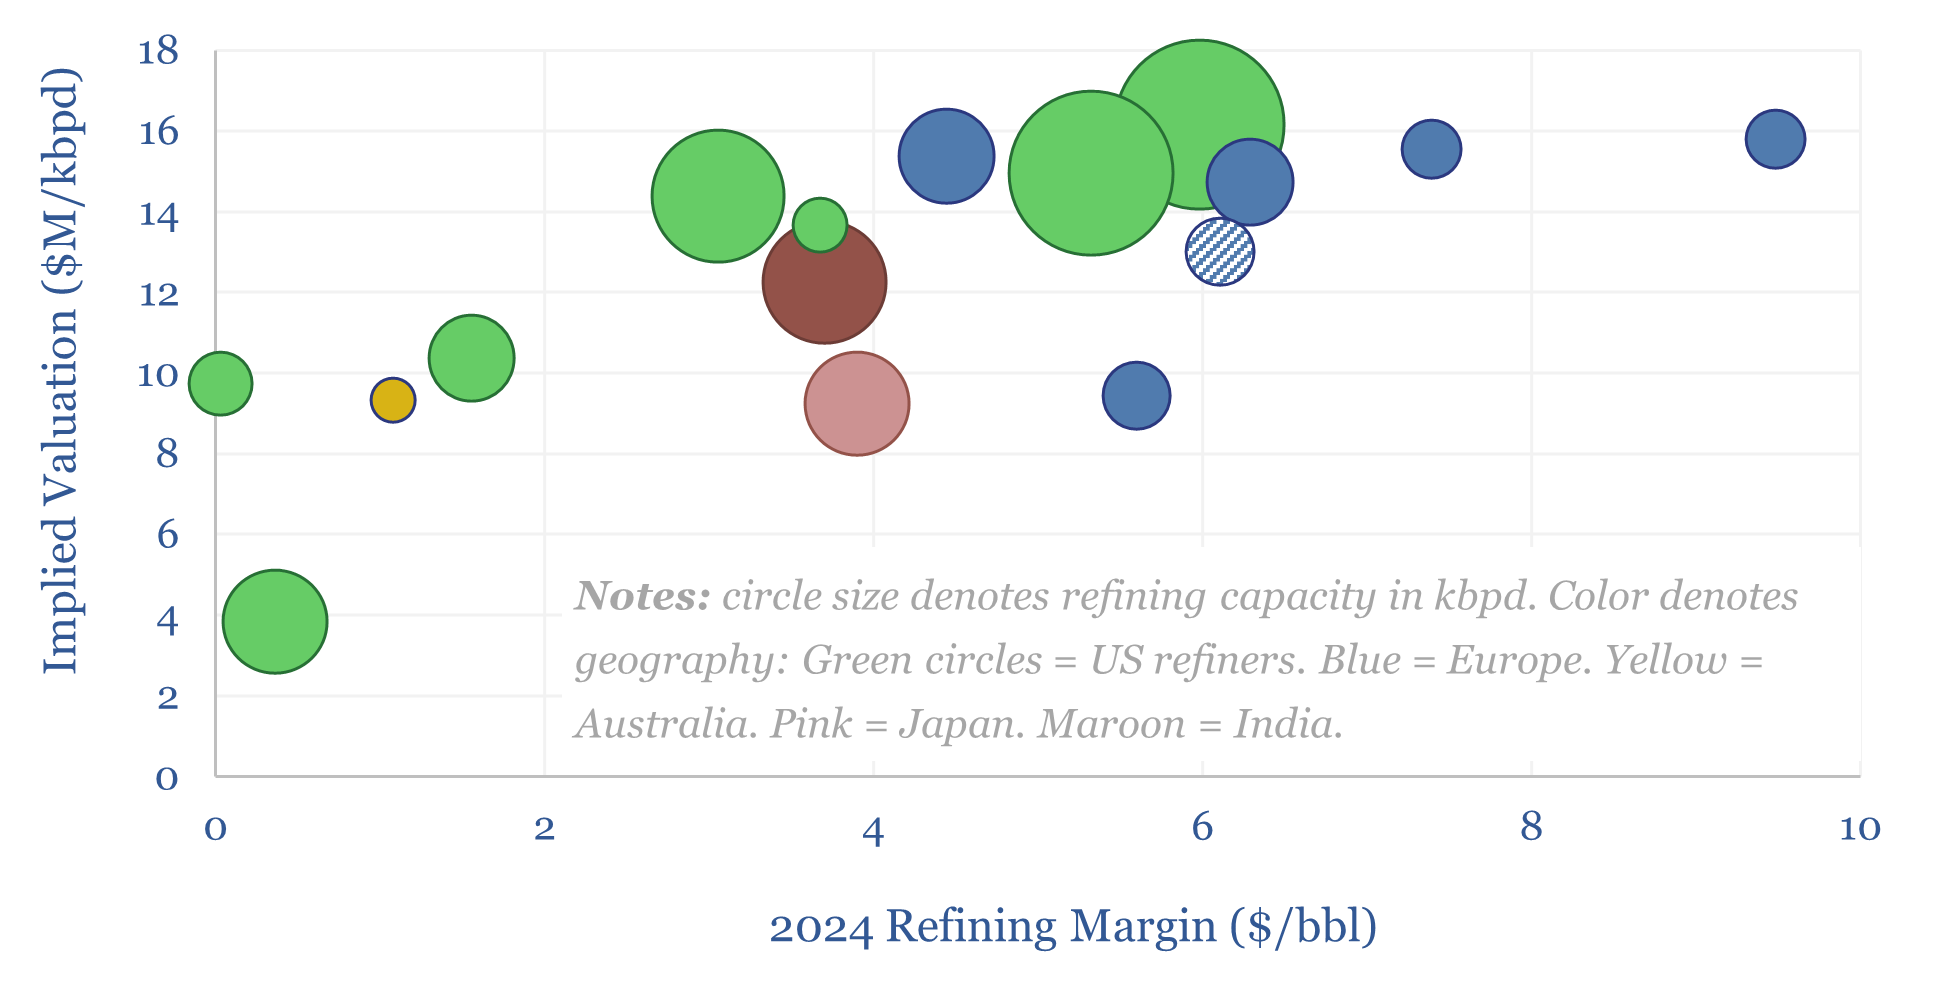
In early-2026, the market is ascribing an average of $13M/kbpd in enterprise value to this group of companies. Interestingly, for comparison, the capex costs for constructing new refineries is estimated in the range of $30-40M/kbpd, in our refinery model, suggesting disenchantment over long-term oil demand. Whether <10x PE and 9% dividend yields are “right” for some of these companies is open for debate.
Market valuations are 70% correlated with 2024 refining margins, which we have aggregated on an apples-to-apples EBITDA basis. In turn, refining margins are 60% correlated with Nelson Complexity Index (after removing one notable outlier) and c10% correlated with the size of the organization’s refining footprint.
Full details on each company, including notes, capacity, size, complexity, margins, and exposure to different downstream activities are tabulated in the data-file. We think 2026 may reset expectations for over 1Mbpd/year of global oil demand growth, requiring a reacceleration of the global refining project pipeline.