This data-file captures the forecast revisions, over time, in our various energy supply-demand models. Over the past seven years, we have consistently and enormously increased our forecasts for solar and coal. We have also repeatedly raised our forecasts for global oil and electricity use. Conversely, we have seen slower growth in gas and EVs, and to a lesser extent, nuclear and wind. Perhaps these trends continue?
Thunder Said Energy has been modeling the world’s evolving energy system since 2019. Over time, we have settled upon consistent structures in these supply-demand models, broken down according to ten regions – the US, Canada, Europe, Japan, Australia, LatAm, China, India, Other Asia and Africa.
Hence it is interesting to collate our forecasts, over time, to see how they have changed, based on reflecting actual data, changing policies, and our research into energy technologies. Where have been the biggest and most consistent upgrades and downgrades, and what does this tell us?
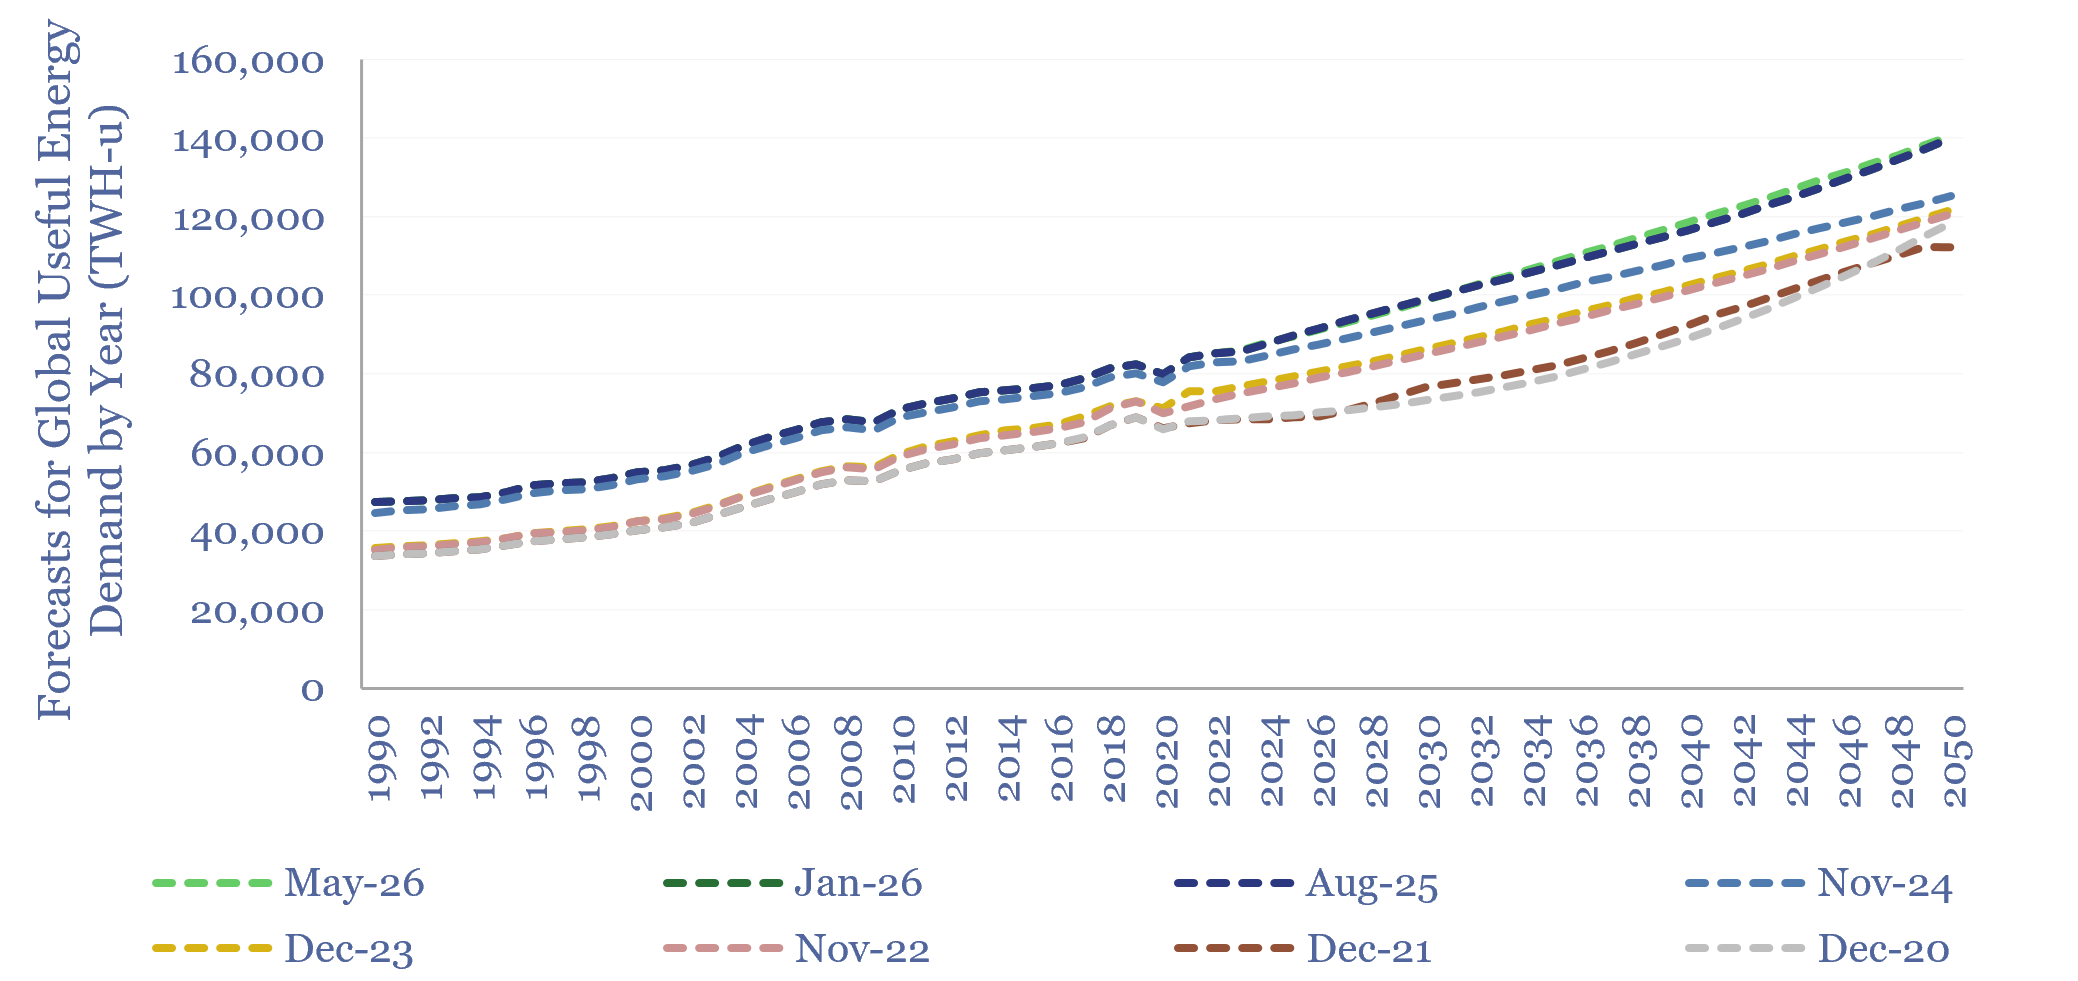
Global energy demand has been revised progressively upwards. In 2021, we saw 1.6% pa demand growth to 112,000 TWH by 2050. In 2026, we see 1.7% pa demand growth to 140,000 TWH pa in 2050. The biggest upgrades have been in the US and Other Asia. Although we also made some revisions in the way we estimate useful energy demand from primary energy demand. (chart above)
Global electricity demand has also been revised progressively upwards. In 2022, we saw +3.3% pa growth to 70,000 TWH by 2050. In 2026, we see +3.8% pa growth to 90,000 TWH by 2050.
Global coal demand has seen staggering upgrades. In our forecasts from 2020, which leaned heavily into decarbonization, we saw coal use falling back to 3GTpa by 2030. After two major energy shocks, we now see 2030 demand 3x higher, and global coal use remains at 5GTpa through 2050.

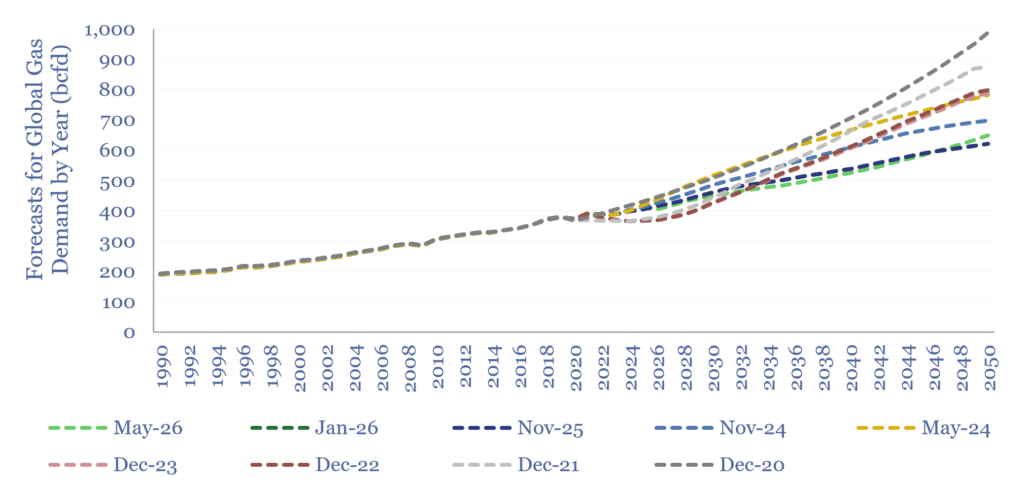
Gas demand growth has generally been revised lower, due to less coal-to-gas switching. In 2020, we saw +3% pa growth to 1,000 bcfd by 2050. In 2026, we see 1.8% pa growth to 650bcfd in 2050, with the most recent downgrades due to hesitations over price volatility.
Oil demand is coming in higher. From 2019-23, we thought demand would fall back from 100Mbpd to 85Mbpd by 2050. We now see demand remaining around 100Mbpd by 2050.
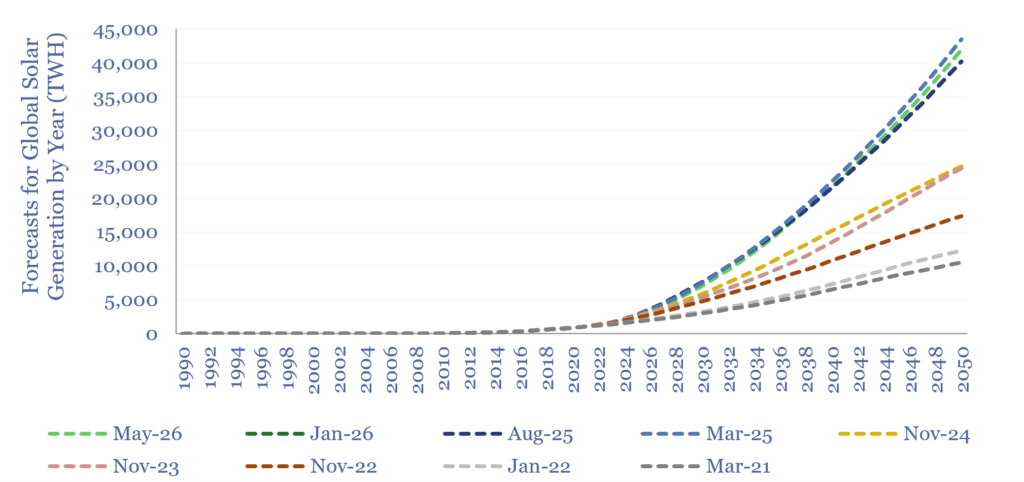
Solar generation has also seen stark upwards revisions, even more so than coal. We have increased our 2050 forecasts for total global solar generation from 10,000 TWH in 2021 to 40,000 TWH by 2026, on cost deflation and increasingly flexible grids.
Wind generation has seen fluctuating forecasts. Our 2050 forecasts rose from 9,000 TWH in 2021, to 12,000 TWH at peak in 2022, and then back to 8,000 TWH by 2026.
Nuclear generation has also seen fluctuating forecasts, but especially in the more recent revisions, we have worried that starting to de-risk SMRs or reaccelerate nuclear is taking longer.
Our forecasts for global EV sales in 2030 were consistently revised downwards, from 66M (Jun-23 forecasts) to 54M (Jun-24), to 40M (Feb-25), to 34M (Jan-26), although after recent disruption in the Middle East, we have recently made our first upwards revisions in a long time to 37.5M EVs sold in 2030.
This data-file is our chart book, acknowledging how we have revised our forecasts over time, by market and by region. Our goal is to learn from prior forecasts that turned not to pan out. Low costs and progressively falling costs have caused coal and solar to surprise. High costs and volatile prices have caused other markets to disappoint, and environmental policy has been unsuccessful in accelerating so-called cleaner technologies, over the 2019-26 timeframe. We will keep this data-file updated over time.