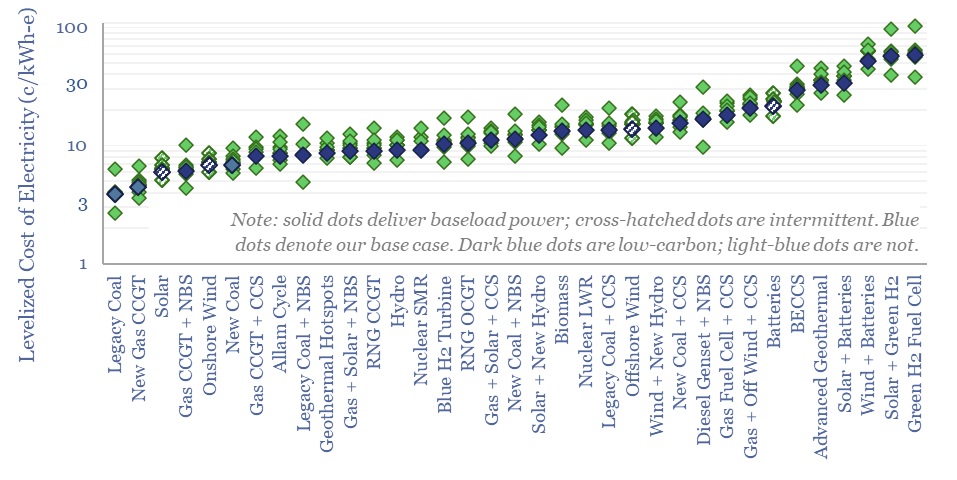
This data-file summarizes the levelized cost of electricity (LCOE), across 35 different generation sources, covering 20 different data-fields for each source. Costs of generating electricity can vary from 2-200 c/kWh. There is more variability within categories than between them. All the numbers can readily be stress-tested in the data-file.
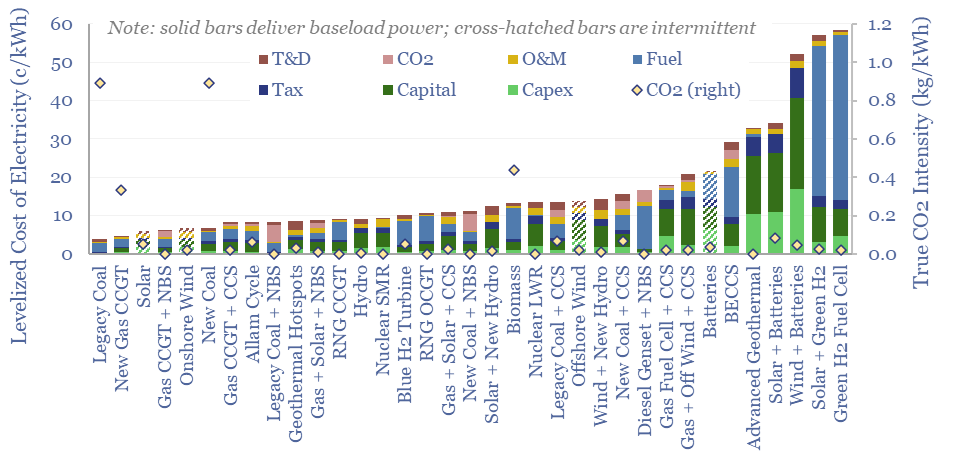
Levelized cost of electricity (LCOE) breaks down the costs of adding new electricity generation, across capex, capital, tax, fuel, O&M, CO2 and T&D, distilled down in c/kWh terms, or $/MWH terms.
We have constructed over 200 economic models calculating the specific levelized costs of onshore wind, offshore wind, solar, hydro, nuclear, gas power, coal power, biomass, RNG, diesel gensets, geothermal, hydrogen, fuel cells, power transmission, batteries, thermal storage, redox flow, pumped hydro, compressed air, flywheels, CCS and nature-based CO2 removals.
The goal in this data-file is to allow for easy comparisons between different power generation options, across 20 different dimensions. We have written that we hate levelized cost, because it is often portrayed as though one energy source will emerge “to rule them all”, whereas there is more variability within each category than between them (see below).
The simple chart below shows how our levelized cost estimates change if we make simple changes in this comparison file: flexing risk-free rates between 1-5%, flexing fuel costs +/- 50%, flexing capex costs by +/- 50%, or changing the distances needed for AC power transmission, CCS pipelines, or other variables.
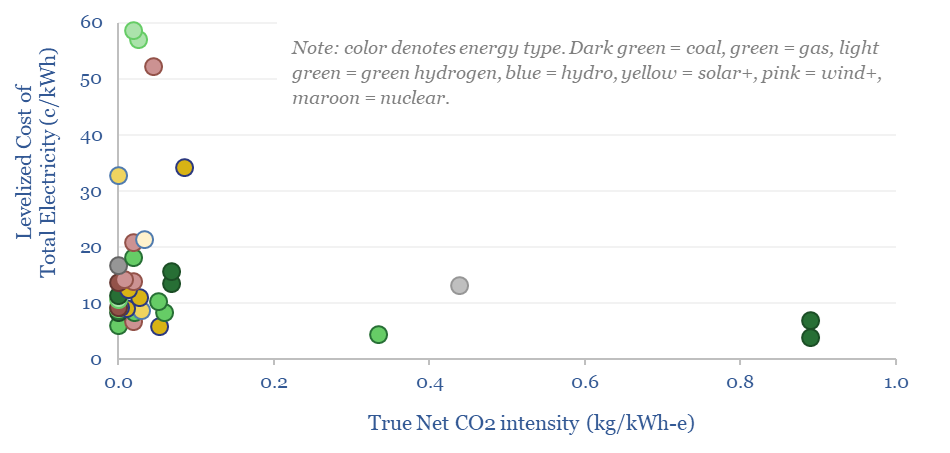
This kind of stress-testing is really the main point of the data-file, asking questions like: how do levelized costs change with WACCs? Or how do levelized costs change with higher gas prices? How do levelized costs change with capex deflation? What are the best options for lowering CO2 intensities of grids (chart below) without inflating total costs? The data-file answers these questions across several dimensions…
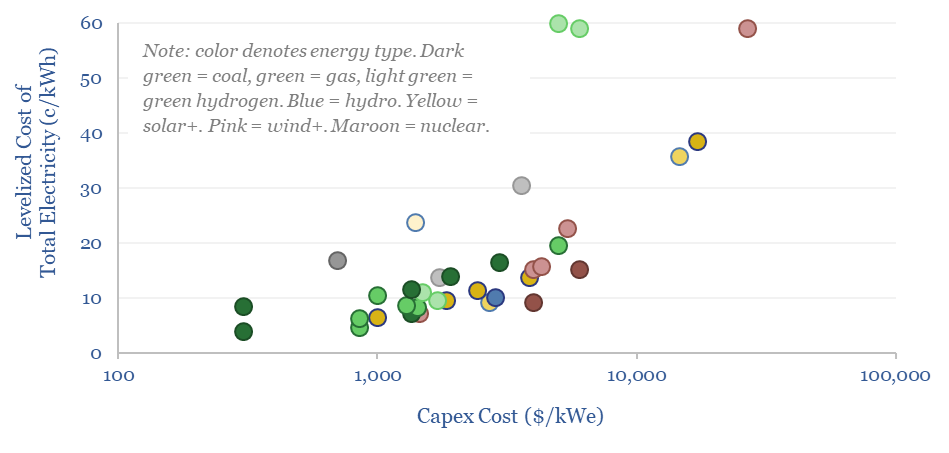
Capex costs are broken down for each category and are defined as the total installed capex, in $/kWe, which can then be divided by the total number of lifetime operating hours, yielding a number in c/kWh. Usually, the capex estimates in our underlying models draw from both top-down surveys of past projects and bottom-up build-ups.
Capital costs can be described as the after-tax income that needs to be earned on top of recovering the capex to derive a passable IRR (usually 7-12%), after whatever build-time is incurred prior to start-up (usually 2-6 years). We have taken this requisite after-tax income level from our individual underlying models, where it captures nuances such as time value of money, decline curves, and volatility.
Tax costs come on top of after-tax income. For simplicity, our models assume a 25% corporate tax rate across the board, but not tax breaks or changeable policies. Thus, we can think about the numbers in our data-file as being true economic costs.
Fuel costs cover the costs of buying gas for a gas plant, coal for a coal plant, hydrogen for a hydrogen plant, etc. By contrast, fuel costs are often zero for renewables. Again, these can readily be flexed in the model, which is especially important for gas value chains, amidst high dispersion in global gas prices.
O&M costs cover operations and maintenance; and are generally going to be lowest for large and simple systems.
T&D costs cover transmission and distribution, to move power to the load center. An advantage for on-site generation is that power can be used directly, whereas the average offshore wind farm in the North Sea needs to be transmitted 20km back to shore, then onwards. AC transmission costs 1.5c/kWh/100km at large scale. For CCS value chains, we also include $3/ton/100km for CO2 transport in the T&D line.
CO2 costs cover the cost for offsetting or disposing of gross CO2 emissions: either via nature-based CO2 removals, using high-quality reforestation at $50/ton; or for CO2 geological disposal in subsurface reservoirs with a base case cost of $15/ton. Otherwise, for CCS value chains, additional costs are reflected in higher up-front capex, higher fueling costs due to energy penalties, and higher maintenance costs.
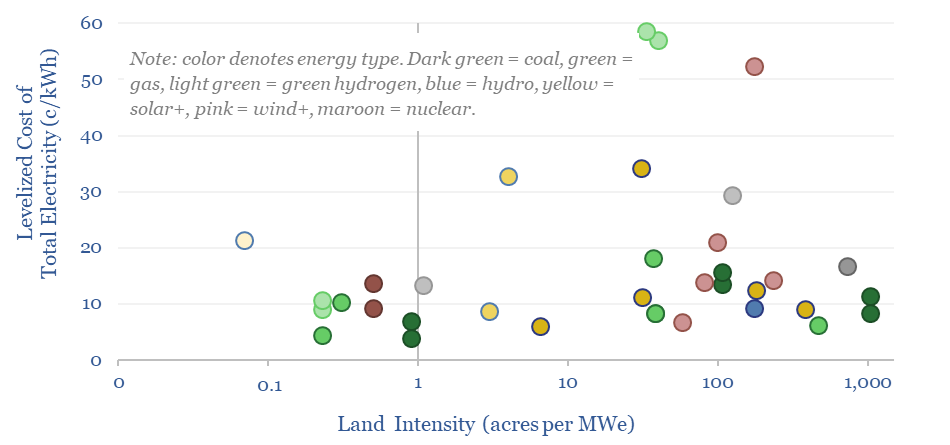
Other dimensions are also compared for all of the generation sources in our database: TRLs, logistical risks, development times, efficiency factors, CO2 intensity (kg/kWh), typical load factors (%) and land intensity (acres per MW) (see below).