Vertical greenhouses: the economics?

Economic costs of vertical greenhouses

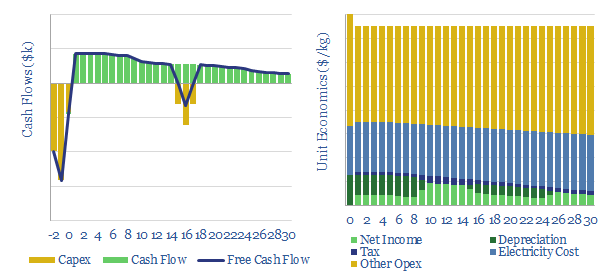
This data-file models the vertical greenhouse costs, an emerging method for growing greens, fruits and vegetables close to the consumer, in large multi-story facilities, lit by LED lighting. Economics can be attractive, with 10% IRRs in our base case condition, off 50kg/m2/year yields and $7.5/kg produce pricing.


Vertical greenhouses achieve 10-400x greater yields per acre than field-growing, by stacking layers of plants indoors, and illuminating each layer with LEDs. The opportunity is covered in our vertical greenhouse research note.

The main rationale for vertical greenhouses is to maximize land productivity, situate production closer to the consumer and earn a premium from fresher produce.

Historically, vertical farming was first described in 1915 by American geologist, Gilbert Ellis Bailey. The first vertical farms were actually built in the 1950s, to grow cress indoors at large scale. LED application for plant growth was first studied in the 1990s, as part of NASA’s preparations for future Moon and Mars bases. And modern experiments with vertical farms go back to 2009, when Sky Green Farms designed a 9-meter arrange of 120 aluminium towers to grow 0.5T of leafy vegetables per day.

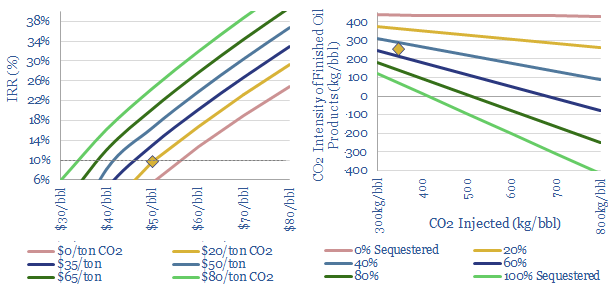
Economics of vertical greenhouses can be attractive, with 10% IRRs in our base case condition, off 50kg/m2/year yields and $7.5/kg produce pricing.

However the CO2 intensity will depend heavily upon the CO2 intensity of the underlying grid,  as our numbers assume 1,000kWh/m2/year of LED light is required.

LED-lighting vertical greenhouses takes 1,000kWh of electricity per m2 per year, emitting 3kg of CO2 per kg of food, if the grid is 50% gas and 50% renewables.

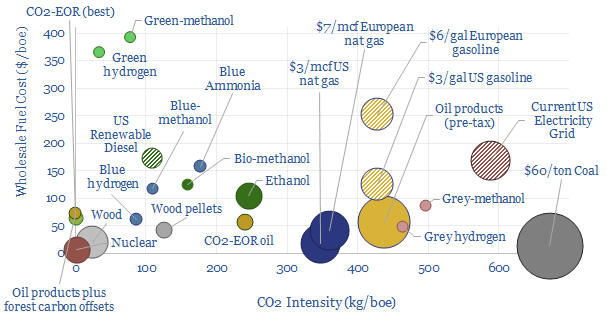
CO2 costs of vertical greenhouses can also be compared with field crop production.

Data in thos models cover the typical capex, opex, energy costs and other vertical greenhouse costs, sourced from technical papers, which are also summarized in the final three tabs of the model.

Backstopping renewables is another opportunity for vertical greenhouses, as LED lights can readily be turned on and off, adding flexibility to power grids.

Vertical greenhouses could become carbon negative, if they are >75% powered by renewables, and increase yields per acre by c300x, as claimed by some

CO2 enrichment is another opportunity, absorbing excess CO2 to improve yields, as a variant on other CCS value chains.

Energy efficiency of household appliances?

Energy efficiency of household appliances

What is the typical range of energy efficiencies for household appliances, such as air conditioners, clothes dryers, refrigerators, dishwashers, lighting, et al? To answer this question, we have tabulated almost 20,000 data-points from the US EPA’s excellent ENERGY STAR program, and other technical papers.

We estimate a house equipped with modern appliances will likely have 60% lower energy demand versus 30-years ago. However, c30% of tyipcal household hold appliances are more than 10-years old, and 5% are more than 20-years old, so there may be very large savings still to come from upgrading.

Even today, the best appliances have c30% lower energy consumption than the worst appliances (90th percentile versus 10th percentile), so it would be helpful to prioritize efficient purchasing decisions.

China: can the factory of the world decarbonize?

Decarbonization of China's economy?

China now aspires to reach ‘net zero’ CO2 by 2060. But is this compatible with growing an industrial economy and attaining Western living standards? The best middle ground that balances these objectives sees China’s coal phased out, oil demand plateauing at 20Mbpd, gas rising by a vast 10x to 300bcfd, and 9GTpa of gross CO2 emissions being captured or offset. The biggest challenges are geopolitics and sourcing enough LNG.

Electric trucks: what battery sizes?

Battery sizes for electric semi-trucks

This data-file models the possible battery sizes in a fully electric semi-truck. Lithium ion batteries up to 15 tons are considered, which could deliver 2,500 miles of range, comparable to a diesel truck.

However, large batteries above c8-tons in size detracts around 10% from the fuel economy of electric trucks, and may cause trucks to exceed regulatory weight limits, lowering their payload capacities.

4-6 ton batteries with 700-1000km ranges and 5-8% energy penalties may be best, and would likely add $110-170k of cost at 2020 battery costs. 

Our roadmap to decarbonize trucking most prefers carbon-offset diesel, then hybridization with super-capacitors, then electric semi-trucks, and least prefers hydrogen trucks.

Companies in drones and drone services for construction?

screen of companies manufacturing drones

The aim of this data-file is a simple screen of companies manufacturing drones and commercializing drone software. In includes 12 private companies and 4 public companies. For each company, we have tabulated their history, geography, number of patent filings and a short description.

China Energy Demand and CO2 Emissions, 2000-2060

China energy model

This data-file is our China Energy Model and CO2 Model, disaggregating China’s energy demand by industry, across coal, oil, gas, wind, solar, hydro and nuclear, across c200 lines, from 2000-2060, with 20-input variables that can be stress-tested.

In our base case scenario, total useful energy demand rises 1.5x by 2050, gas demand rises 3.5x to displace coal, wind and solar reach 50% of the final electricity grid, while gross CO2 emissions fall back from 10.5GTpa in 2022 to 8GTpa, and the remainder must be met by (a) waiting until 2060 (b) CCS and (c) CO2 removals.


The goal of our China energy model is to track China’s historical energy demand and CO2 emissions, and stress-test different scenarios for China’s future energy demand and CO2 emissions. How do the different variables need to look, for China’s future energy use and CO2 emissions to be consistent with our broader global energy models and global roadmap to net zero?

China matters as it contains 17.5% of the world’s people, consumes 20,000 TWH pa of useful energy (25% of the global total), 4GTpa of coal (50% of the global total) and emits 10.5 GTpa of CO2 (30% of global total energy-related CO2 emissions). There is no route to global decarbonization without China decarbonization. So what do we need to model?

Demographic changes. The latest forecasts from the World Bank are that after rising at a 20-year CAGR of 0.5% pa, China’s total population peaked in 2022 at 1.4bn people and will gently decline back to 1.2bn by 2050. GDP growth slows from 9% pa in the past 20-years to 4.5% pa through 2060. Our models increasingly suggest a sustained era of painful energy shortages yielding high energy prices. Hence useful non-industrial energy per capita is only able to rise by about 50% from 5MWH pp pa today to 8MWH pp pa by 2050, compared to around 20 MWH pp pa in the developed world today. And no rebound effects are included.

This sees China’s total energy demand levelling off at 30,000 TWH per year, 1.5x higher than today’s levels and the gross CO2 intensity of GDP sustaining its recent 5% pa decline.

China energy model
China CO2 intensity of GDP over time
China energy model
China useful energy demand from 2000 to 2060

Electrification, solar and wind would also need to step up enormously. Electricity is 45% of China’s useful energy today, which rises to 67% in our base case scenario, increasing China’s total grid by 2.5x from 2.7 TW today to 7 TW by 2060 (for comparison, the total US grid today is 1.3 TW, which rises 2.5x to 3TW in our US decarbonization model). These are astronomical numbers.

China energy model
China power grid in GW as a function of coal, oil, gas, hydro, solar, wind and nuclear from 2000 through 2060

China’s solar generation and wind generation thus ramp up to provide 50% of all of China’s electricity and about 80% of the total grid capacity. This means 40% of the world’s entire wind and solar capacity additions through 2050 would need to occur within China. And this must all happen despite the inflationary impacts of China’s total grid utilization falling from 60% at peak in 2004 to 30% in the 2040s, in an economy where costs matter, as manufacturing is 30% of GDP and 65% of all energy use.

China energy model
China power grid over time

China’s coal consumption currently runs above 4GTpa, providing 60% of China’s useful energy, 15% of the world’s energy, and equivalent to 4 Saudi Arabia’s worth of oil. Coal is the highest carbon combustion fuel, 2x more CO2 intensive than natural gas. Hence decarbonization aspirations require coal to be phased out.

China energy model
China coal demand in an energy transition scenario

China’s gas demand must therefore rise by 3.5x, from 35bcfd in 2022 to 130bcfd by 2050, even despite the large renewables ramp. Per the second chart below, this requires a very large acceleration in gas and LNG imports in the 2030s.

China energy model
China gas demand in an energy transition scenario

China’s oil demand reaches a new peak above 16Mbpd in 2023, then continues rising to a plateau of 18Mbpd by 2040, in this model, which assumes that oil is phased out from industry, and ultimately over 80% of transportation miles becomes electrically powered, including effectively all urban vehicles, while transportation-related oil demand becomes dominated by jet fuel, long-distance trucks and shipping.

China energy model
China oil demand in a decarbonization scenario

Overall, China’s gross CO2 emissions are seen falling back from 10.5GTpa in 2022 to 8GTpa in 2050, while full decarbonization will require a mixture of CCS, nature-based removals and waiting until 2060. The numbers can be very different with subtle changes of assumptions. Please download the data-file to flex different scenarios in the model.

CO2-EOR: well disposed?

CO2-EOR economics to decarbonize oil

CO2-EOR is the most attractive option for large-scale CO2 disposal. Unlike CCS, which costs over $70/ton, additional oil revenues can cover the costs of sequestration. And the resultant oil is 50% lower carbon than usual, on a par with many biofuels; or in the best cases, carbon-neutral. The technology is fully mature and the ultimate potential exceeds 2GTpa. This 23-page report outlines the opportunity.

Fuel costs and CO2 intensities?

Costs and CO2 intensity of fuels

This data-file compares fuel costs and CO2 intensities for 20 different fuels. Clean fuels are not a black-and-white category, but fall along a spectrum. CO2 intensity is -35% associated with costs. Switching coal to gas actually achieves more decarbonization than switching gas to green hydrogen.


Included in the file are different oil products, gas markers, coal, wood, nuclear, biofuels, methanol, hydrogen, CO2-EOR products and the US electricity grid for comparison.

Good rules of thumb are that $60/ton coal equates to thermal energy at 1c/kWh-th, while emitting over 600 kg/boe of CO2 intensity; while $3/mcf gas also equates to thermal energy at 1c/kWh, while CO2 intensity is around 50% lower at 350kg/boe.

The straight line average fuel in the global energy system costs $100/boe and has a CO2 intensity of 350kg/boe.

There is a -35% correlation between different fuel costs and CO2 intensities, as many of the lower carbon fuels in the mix are more expensive than these low cost alternatives. Simply in terms of thermodynamics, fuels with more energy transformations will embed higher costs and possibly also higher CO2 intensities, unless they are combined with CCS.

Three stand-out opportunities in the energy transition, in our view, are switching coal to gas and LNG, later switching gas to blue hydrogen, and combining low-carbon gas with nature-based CO2 removals. All of these options yield large-scale decarbonization at passable incremental costs.

Beware oversimplified levelized cost analysis. Our research into this topic is linked here and here. Our cross plot of different countries’ electricity prices and CO2 intensities is linked here.

This data-file simply contains the numbers behind the cross-plot shown above, for anyone looking to interrogate the data or re-format the chart. The workings behind each number are linked in other data-files.

For an overview of energy units, how they work, and what they mean, we recommend our primer into global energy units: life, the universe and everything.

CO2-EOR: the economics?

Economic costs of CO2 enhanced oil recovery EOR

This data-file captures the economics of CO2-enhanced oil recovery, which can lower the total CO2 intensity across the oil industry by 50-100%.


We calculate 10% IRRs are attainable under our base case assumptions at $50/bbl oil prices and $20/ton CO2 prices, however the economics are sensitive to field-by-field variables.

The data-file includes a full cost build-up, segmented across over 20 cost lines (capex in $M/kboed and opex in $/boe), as derived from past project parameters (charts above), plus half a dozen detailed papers from the technical literature, which are also summarized in the file.

Carbon negative construction: the case for mass timber?

Cross laminated timber costs in carbon negative construction

The construction industry accounts for 10% of global CO2, mainly due to cement and steel. But mass timber could become a dominant new material for the 21st century, lowering emissions 15-80% at no incremental costs. Debatably mass timber is carbon negative if combined with sustainable forestry. This could disrupt global construction. This 17-page note outlines the opportunity and who benefits.

Copyright: Thunder Said Energy, 2019-2024.