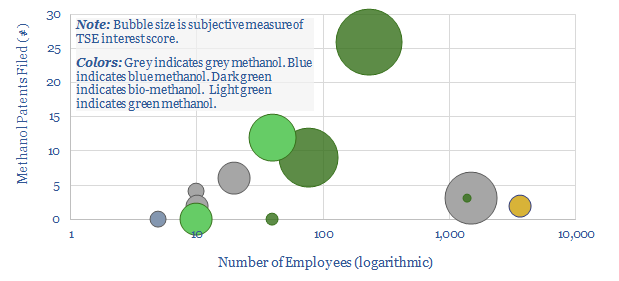
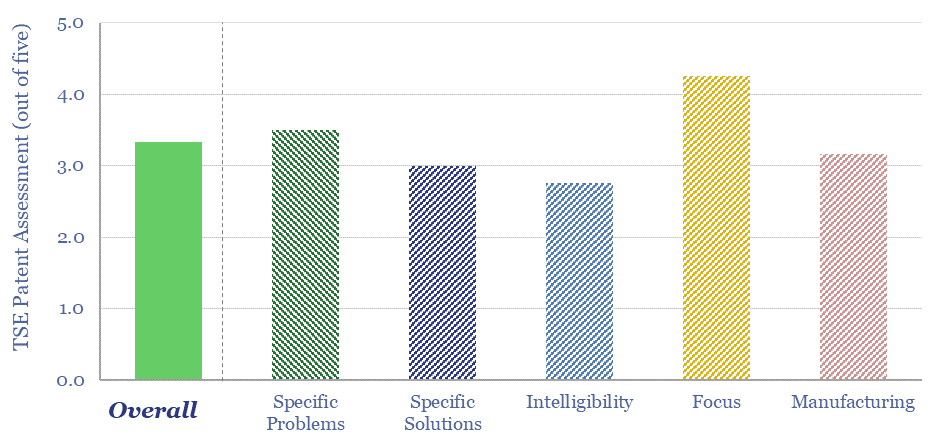
This data-file tabulates the details of companies in the methanol value chain. For incumbents, we have quantified market shares. For technology providers, we have simply tabulated the numbers of patents filed into methanol production since the year 2000. For new, lower-carbon methanol producers, we have compiled a screen, noting each company’s size, patent library and a short description (chart above).
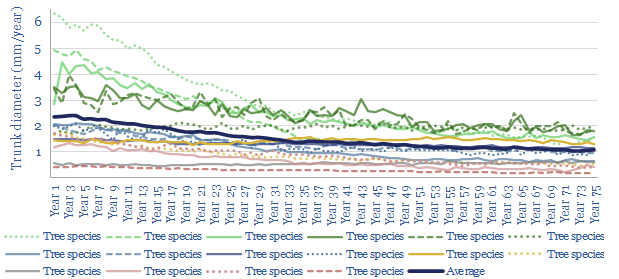
Managed reforestation: growth rates by tree species over time?
We have tabulated data into the growth rates of over 2,500 trees, in over a dozen locations globally, based on tree ring measurements, reported by the National Center for Environmental Information.
The objective is to assess whether growth rates are faster at younger or older trees, given that biomass accumulation is correlated with tree widths. We find that tree widths continue rising steadily over 100-500 years, with radiuses growing at an average pace around 2mm per year.
However, growth rates are fastest in early years. As a rule of thumb, they will slow down by 25% after 20-years, 40% after 40-years and 50% after 60-years. This may be an argument for forest management and sustainable harvesting as more reforestation projects are undertaken to combat climate change (note here).
Relatively faster growing species tend to remain relatively faster growing even after longer time-frames. This may be an argument for rigorous species selection, as discussed further in our data-file here.
Costs of climate change: a paradox?
The unmitigated costs of climate change will likely reach $1.5trn per annum after 2050, exerting an enormous toll on the world. However, the costs of the energy transition will exceed $3trn per annum. Unfortunately, this might seem to undermine the economic justification for combatting climate change. Does this matter and what does it mean?
Economic costs of climate change?
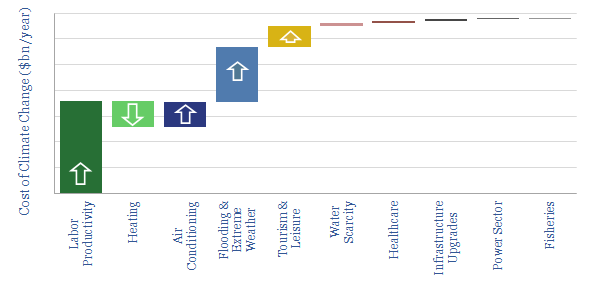
This data-file contains our estimates into the economic costs of unmitigated climate change, using the latest disclosures from the IPCC as a framework. We estimate the total costs could reach $1.5trn per annum.
Our numbers include losses of labor productivity in hot countries, increased air conditioning demand (offset by lower heating demand), granular data into the cost of natural disasters, which could become increasingly prevalent (chart below), losses in the tourism industry, water scarcity, healthcare costs, et al.
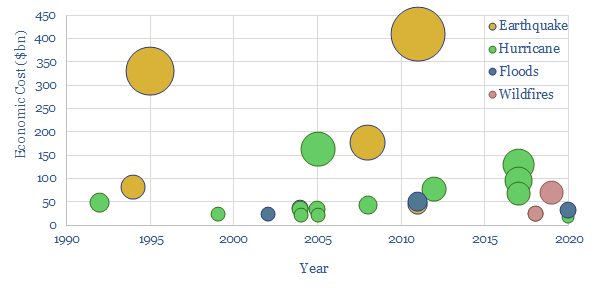
Numbers in the data-file are discussed in more detail in our recent research report, into the paradoxical costs of climate change.
CO2 electrolysis: the economics?
Carbon monoxide is an important chemical input for metals, materials and fuels. Could it be produced by capturing CO2 from the atmosphere or using the amine process, then electrolysing the CO2 into CO and oxygen?
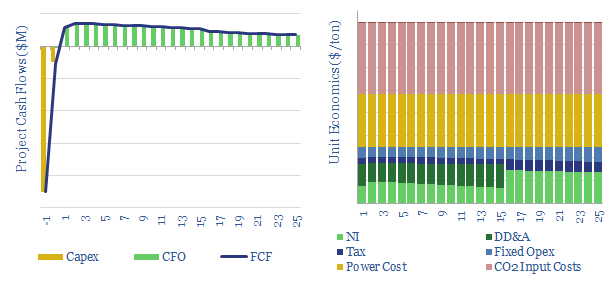
This data-file models the economics of CO2 electrolysis, including recent advances from leading industrial gas companies, and by analogy to hydrogen electrolysis.
10% IRRs can be achieved at $800/ton carbon monoxide pricing, which can be competitive with conventional syngas production, and far more economic than small-scale distribution of CO containers.
The data-file contains input assumptions, detailed notes from half-a-dozen recent technical papers, and short summary of different companies’ initiatives, including Haldor Topsoe, Siemens, Covestro, Methanex and Carbon Recycling.
Electric vehicle charging: the economics?
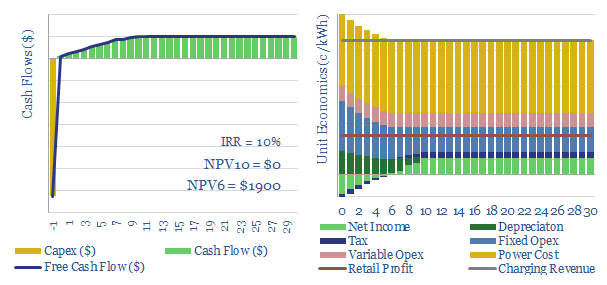
This data-file models the economics of electric vehicle chargers. First, we disaggregate costs of different charger types across materials, electronic components, labor, permitting, fees, opex and maintenance (below).
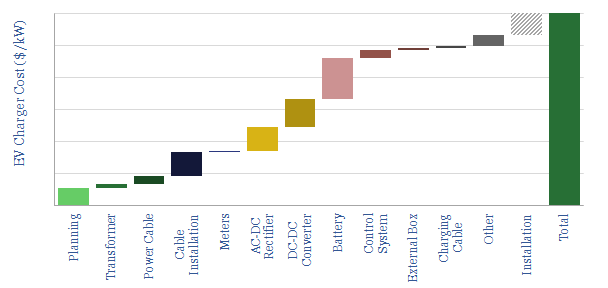
Next we model what fees need to be charged by the charging stations (in c/kWh) in order to earn 10% IRRs.
Economics are most favorable where they can lead to incremental retail purchases and for larger, faster chargers.
Economics are least favorable around multi-family apartments, charging at work and for slower charging speeds.
An economic increment can also be added to reflect the benefits of demand shifting to backstop increasingly renewable-heavy grids.
Enhanced geothermal: technology challenges?
This data-file tabulates the greatest challenges and focus areas for harnessing enhanced geothermal energy, aka deep geothermal technology, based on reviewing patents from 20 companies in the space. In particular, we have focused in upon Eavor Technologies, which has a clear moat around its drilling, sealing and working fluid technologies.
Enhanced geothermal energy projects aim to access 50-300ºC temperatures in the sub-surface by drilling down to 2,000-6,000m total vertical depths. Our recent research has covered the emerging opportunities in enhanced geothermal.
But what are the key challenges for enhanced geothermal technologies? To answer this question, we have reviewed the challenges that are cited in recent patents (chart below).
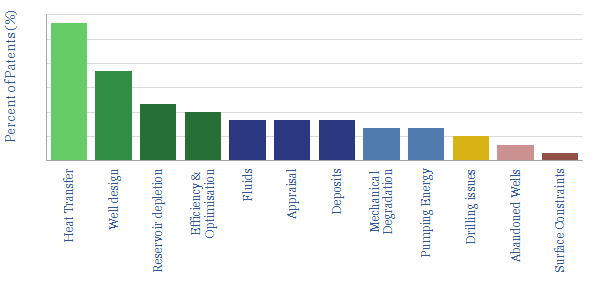
The patents confirm that the largest challenges for deep geothermal are drilling long multi-lateral wells, which contact sufficient reservoir volumes to transfer heat from the subsurface into the working fluids, without depleting the geothermal resource.
Recent advances from the unconventional oil and gas industry are likely to be a crucial enabler from deep geothermal, based on the comments made in the patents.
Eavor Technologies is the company that stood out most in our overview of the geothermal industry. Eavor Technologies is a private company founded in 2017, headquartered in Calgary, Alberta, employing c100 people, in order to develop a next-generation, closed-loop geothermal energy technology.
Eavor’s aspiration is that its geothermal systems can be deployed anywhere, to harness the Earth’s geothermal gradient, and provide clean, reliable, flexible baseload heat and power, without geological/exploration risk. The closed loop system does not use hydraulic fracturing, does not exchange fluids with the formation, and thus does not suffer a risk of causing water contamination or Earthquakes. Hence we have reviewed 20 patent families from Eavor.
Based on reviewing its patents, we conclude that Eavor has developed proprietary technologies to drill deep wells, into hot formations, seal them using silicates/aluminosilicates, and keep them sealed via additives in the working fluid. Specific chemical additives are clear from the patents. The full details are in the Eavor-Conclusions and Eavor-Patents tabs.
The remaining risks for enhanced geothermal technology are also discussed, based on the evidence in the patents.
Ten Themes for Energy in 2021?
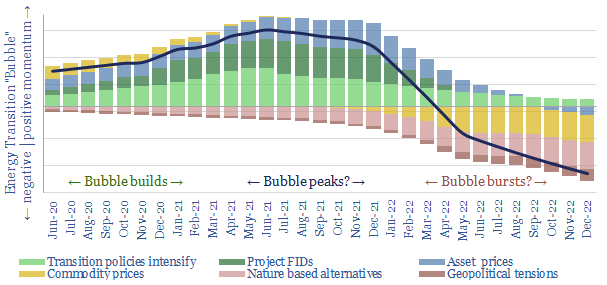
This 25-page note outlines our top ten themes for 2021. We fear Energy Transition will continue building into an investment bubble. But also appearing on the horizon this year are three triggers to burst the bubble. We continue to prefer non-obvious opportunities in the transition and companies with leading technologies.
Energy economics: energy content of combustion fuels?
The purpose of this data-file is to disaggregate the energy content of combustion fuels, including natural gas, different oil products, NGLs, coal, hydrogen, methanol, ammonia et al.
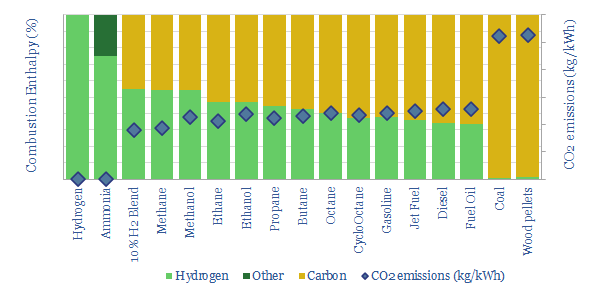
In each case, this data-file derives the fuel’s enthalpy of combustion from first principles, the contributing share of carbon and hydrogen oxidation, and thus the CO2 emissions per unit of energy. We also derive the fuels’ energy density, expressed in kWh/kg, kWh/mcf and kWh/gallon.
For example, natural gas combustion releases 850kJ/mol of net energy when combustion, of which c54% derives from hydrogen in CH4 forming water vapor, and c46% derives from the carbon in CH4 forming CO2. Thus methane has an energy content of 304kWh/mcf and a CO2 intensity of 0.19kg/kWh.
Similar calculations are contained in the data-file for hydrogen, ammonia, methanol, ethane, ethanol, propane, butane, octane, gasoline, jet fuel, diesel, fuel oil, coal and wood pellets.
There is recent enthusiasm to lower combustion emissions by blending hydrogen into gas grids. But materially greater decarbonization occurs by replacing coal/biomass with gas, or even replacing oil products with NGLs.
For an overview of bond enthalpy, and how it determines the energy content of combustion fuels, while also forming H2O and CO2, please see our overview of energy units, and our discussion of coal versus gas.
Energy transition market sizing: hydrocarbon, new energies, capital goods and materials?
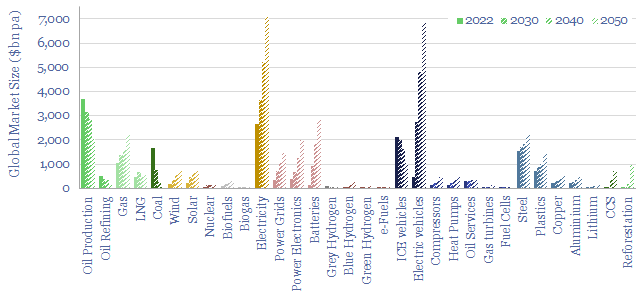
This data-file contains energy transition market sizing analysis, for hydrocarbons, new energies, capital goods and materials in $bn pa, integrating over 1,000 items of energy transition research and our latest roadmap to net zero. In aggregate, energy, materials and transition-related markets double from $25 trn pa to $50 trn pa. Conclusions below.
Energy transition market sizing. How big will the markets be for energy commodities, materials, manufactured products and clean technologies, as part of the energy transition?
Our energy transition research has been boiling the ocean, looking at individual markets, for the past five years. However, this data-file is intended as a useful reference file, to compare the volumes, prices and thus market sizes for different markets.
Is your energy transition market sizing realistic? Well-established capital goods sectors include oil services ($300bn pa), compressors ($140bn pa), switchgear ($110bn pa), industrial valves ($100bn pa), gas turbines ($30bn pa) and power semiconductors ($30bn pa). We think this data-file is worth considering, to ensure forecasts for the ultimate market sizing are realistic, especially for some highly-hyped and early stage technologies.
Electricity will become the biggest energy commodity by market value, in absolute terms, by 2050, surpassing $7 trn per year, which is 2x higher than the total market value of oil, the leader in 2022. More granular details are available in our power grid research.
Electric vehicles become the second largest market in the data-file, also reaching close to $7 trn per year, if EV sales ramp up to around 200M vehicles per year at an average price around $35k per vehicle. These are huge numbers, with embedded risks, and also pull on commodities such as batteries ($3trn pa, some also used ex-EVs) and battery materials such as lithium ($150bn pa).
Wind and solar enjoy vast ramp-ups too, and the ultimate capex spent on both are likely to surpass $700bn pa. For perspective, note that the entire oil service market today is around $300bn pa. The outlook for wind and solar differs however. We see much greater volume growth for solar (in GW pa), combined with much faster future cost deflation (in $/kW), and these two trends balance out to yield a similar market size (in $bn pa).
Hydrocarbons retain enduring value, declining from a total market value of $7 trn per year in 2022 to $5 trn per year in 2050. But the biggest reason for the decline is that 2022 was a year of energy shortages, with abnormally high energy prices. Within the mix, we also see a major shift from coal to gas, if the world is serious about decarbonization.
Global materials markets at least double, due to rising volumes and CO2 abatement costs. The largest materials markets in the world today include steel ($1.5 trn pa), plastics ($750bn pa) and copper ($250bn pa). We actually have a more detailed data-file, looking into more underlying materials, and our thesis on each one, linked here.
The biggest gains in market size are seen for reforestation (reaching $1trn pa in value by 2050), CCS value chains ($700bn pa by 2050) and blue hydrogen ($250bn pa by 2050), if the world is actually serious about decarbonization.
Why are your numbers so low for XYZ? Our models prefer low cost decarbonization options over high cost decarbonization options. For example, in hydrogen value chains, we estimate that ultimately the produced volumes of blue hydrogen ($1/kg) will be 10x higher than green hydrogen ($8/kg) specifically because blue hydrogen is less expensive. Market size = volume x price. Hence if the volumes were the same, then green hydrogen markets would be 8x larger than blue hydrogen markets simply because green hydrogen is more expensive. But energy is unlikely to become a Giffen good !!
Please download the data-file to flex the underlying assumptions for market volumes, unit prices and future market sizes of different energy transition verticals. We would note that this data-file also contains links to a lot of our other data-files and therefore may be more useful for TSE subscription clients than as a one-off download.

