Biogas: the economics?

Biogas costs are broken down in this economic model, generating a 10% IRR off $180M/kboed capex, via a mixture of $16/mcfe gas sales, $60/ton waste disposal fees and $50/ton CO2 prices. High gas prices and landfill taxes can make biogas economical in select geographies. Although diseconomies of scale reward smaller projects?


Biogas is a mixture of 50-70% methane and 30-50% CO2, produced from the anaerobic digestion of organic matter, such as manure, sewage or crop residues, or other organic waste. Archaea notes that 72% of US renewable natural gas comes from landfills, 20% from livestock, 5% from organic waste and 3% from wastewater.

This economic model captures the costs of biogas production, informed by 20 case studies, covering yields, capex, opex, IRRs and sensitivities.

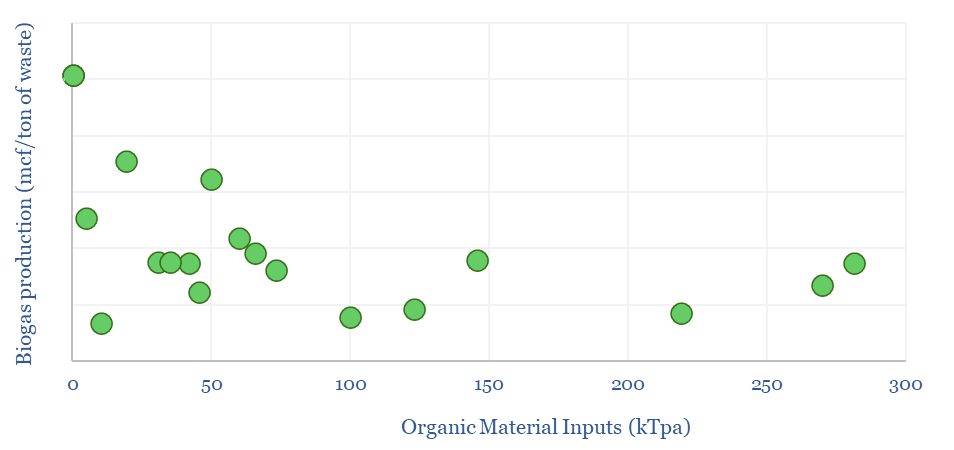
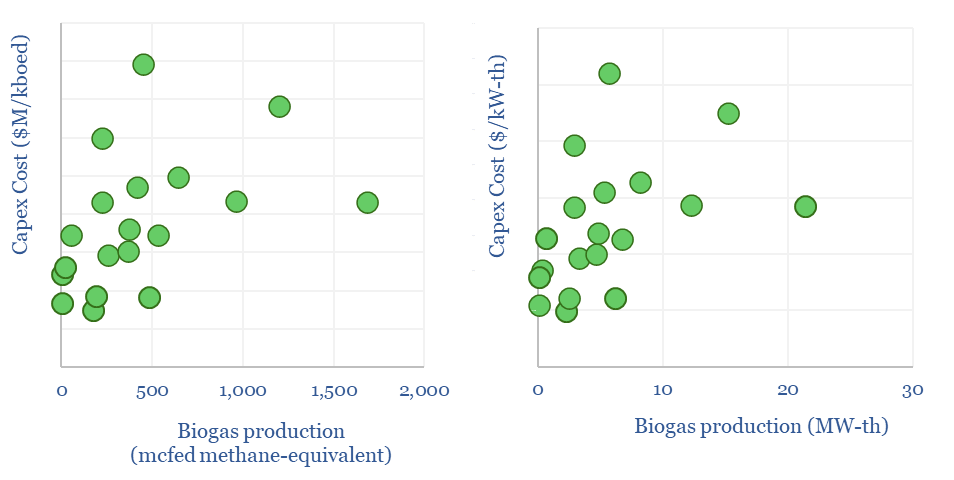
Biogas yields average around 4 mcf per ton of input material, although smaller plants may find it easier to source high-quality feedstocks, with greater quantities of volatile organic matter, and greater conversion of that matter into biogas (chart below).

The capex costs of biogas plants are also tabulated from the 20 case studies in this data-file. Costs vary. But good rules of thumb might be $200/Tpa of feedstocks. In energy industry terms, this is equivalent to around $180M/kboed, or around 6x the costs of offshore hydrocarbons, or around $2,500/kW-th, which again is around 2x higher than the per kW-e costs of solar or onshore wind.

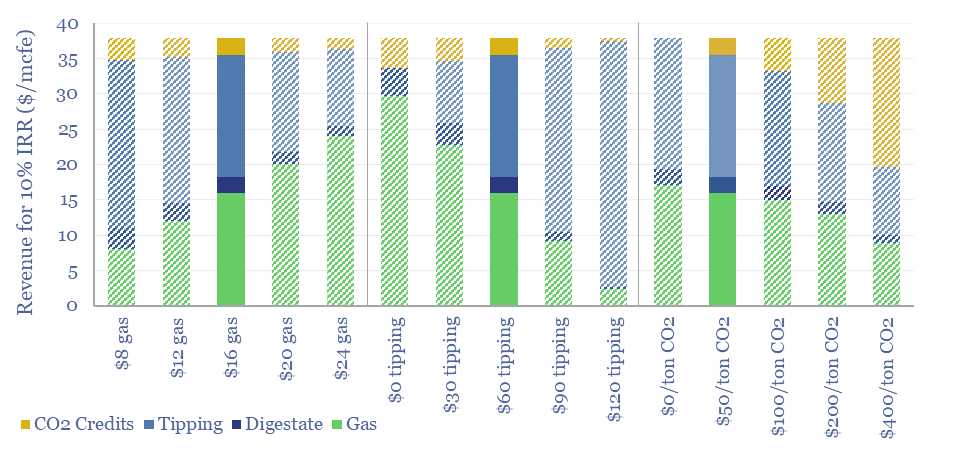
Biogas production facilities need to earn around $35-40/mcfe of methane-equivalent production in order to generate a 10% IRR on their up-front capex. There are four main revenue streams: gas, waste disposal fees, CO2 prices or incentives, and the value of residual digestate, which can be used as fertilizer or bedding in agriculture.

Our base case biogas cost model sees a 10% IRR from a combination of $16/mcf methane, $60/ton disposal fees and a $50/ton CO2 incentive. However, $120/ton landfill taxes can take the methane-equivalent price down to as little as $2.5/mcf. Hence the economics depend on landfill taxes and gas prices in different countries.

Revenue breakdown at 10% IRR for biogas production depending on the price of methane, disposal fees, and carbon tax. This suggest greatly varying profitability in different geographies.

Biogas production in Europe currently comprises around 1-2% of the total gas grid, although some studies have estimated that total biogas production could reach 10-20% of total, or around 50-100bcm pa in Europe, via a “huge scale-up”.

One interesting observation from the charts above is that unlike other economic models in our library, biogas facilities may not benefit from economies of scale. Smaller facilities seem to cost less in capex terms and achieve higher yields. This suggests an opportunity for middle-markets private equity and companies with many small facilities?

Please download the data-file to stress-test biogas production costs. We are also constructive on some of the economic opportunities in landfill gas and biochar.

Hydrogen: what GWP and climate impacts?

Hydrogen GWP versus methane

This data-file aggregates technical data into the Global Warming Potential (GWP) of hydrogen, in order to draw conclusions for decision-makers in the energy transition. So what is hydrogen GWP versus methane?


(1) Hydrogen is not a direct GWP, as H-H bonds in the hydrogen molecule do not directly absorb infrared radiation, indeed nor do other symmetrical diatomic molecules like N2 or O2 (no permanent dipole moments).

(2) But hydrogen is an indirect GWP, as it breaks down in the atmosphere over 1-2 years, and its reaction products increase the GWP impacts of other GHGs, such as methane, tropospheric ozone and stratospheric water vapor.

(3) The best estimates we have tabulated in our data-file give a 100-year GWP for hydrogen that is 11x stronger than CO2 and for methane that is 34x stronger than CO2 (please download the data-file for the details).

(4) Concerns? In other words, if you are worried about the climate impacts of leaking 0.6 – 3.5% methane across global gas value chains, the climate impacts are effectively the same for leaking 2 – 10% hydrogen across a hydrogen value chain.

(5) 3x higher hydrogen leakage rates are not an unjustified concern, because the radius of an H2 molecule is about 3x smaller than the radius of a CH4 molecule, and the boiling point is -253C (versus -162C for methane) resulting in more boil-off, and thus upper estimates for H2 leakage rates as high as 20% have crossed our screen.

(6) The hydrogen industry might adapt: by monitoring and mitigating its leakage rates, much like the gas industry needs to do; and by preferring shorter and simpler value chains, direct substitution for pre-existing hydrogen in industry; or transporting hydrogen in carrier molecules (toluene, ammonia, electrofuels are less likely to result in hydrogen emissions, even if they are more expensive).

(7) CH4 Condemnation? Over 50% of the GWP impacts of hydrogen arise because hydrogen mops up hydroxyl radicals, which in turn, prevents these hydroxyl radicals from breaking down methane molecules. Thus the 100-year warming impacts of methane are exacerbated. In other words, the climate impacts of atmospheric hydrogen directly link to the atmospheric impacts of methane. The more worried you are about one, then logically, the more worried you should be about the other. Hydrogen and methane are “in it together” when it comes to GWP.

(8) CH4 Collaboration. Atmospheric methane is around 1,900 ppb, 160% above pre-industrial levels. Every year, about 40% of the world’s methane emissions comes from natural sources like wetlands, 25% from agriculture, cow burps and rice, 25% from coal, oil and gas and c10% from waste landfills. H2’s GWP can be improved by encouraging better methane management in all of these other categories.

Recent Commentary: please see our article here.

Methane emissions from pneumatic devices: by operator, by basin?

Methane emissions from pneumatic devices across the US onshore oil and gas industry comprise 50% of all US upstream methane leaks and 15% of all upstream CO2. This data-file aggregates data on 800,000 pneumatic devices, from 300 acreage positions, of 200 onshore producers, in 12 US basins.


Pneumatic devices are valves and pumps that are actuated by pressurized natural gas, widely used in the oil and gas industry, and numbering around 800,000 in the US in 2021, across 22Mboed of production that we are tracking, acreage position by acreage position, based on EPA disclosures.

The problem with pneumatic devices is that they leak methane, a greenhouse gas, emitting an average of 1 ton of methane per device per year, explaining 20MTpa of US CO2e emissions, equivalent to 2.5 kg/boe of Scope 1 CO2 emissions, or around half of the CO2 attributed to methane leaks in the US upstream oil and gas industry.

So over time, we expect bleeding pneumatic devices to be phased out in the US, especially ‘high bleed’ pneumatic devices, which emit around 5 tons of methane per device per year, as part of the industry’s growing efforts to mitigate methane. (This note also covers companies in the supply chain to help mitigate methane emissions from pneumatic devices, including a switch to electrically actuated devices, example here).

We have been tracking methane emissions from pneumatic devices in the US oilfield since 2018, although the latest data from 2021 do not show much improvement in aggregate (chart above).

The average well that is in operation in the US oilfield is associated with 1.4 bleeding pneumatic devices, although it is highest in basins that produce similar quantities of both oil and gas, at 2-3 pneumatic devices per well in the MidCon, Anadarko basin and Eagle Ford, while it is lowest in the Marcellus and Utica, at 0.75 pneumatic devices per well, as pure-play gas producers primarily aim to monetize not leak their gas.

Methodology. Note that in the chart above we have adjusted the data into ‘intermediate equivalents’. For example, the average low-bleed pneumatic device emits 9x less methane than the average intermediate-bleed device, and so we consider 9 low-bleed devices “equivalent” to one intermediate bleed device.

Pneumatic devices per well also vary vastly by operator. The best operators have well below 0.5 pneumatic devices per well, while some have shifted almost entirely to electrically actuated devices that use no methane.

Leaders include Pioneer, EOG, Diamondback, with no high-bleed pneumatic devices, and very few intermediate-bleed pneumatic devices across their portfolios.

On the other side of the spectrum are operators with 2-7 bleeding pneumatic devices per well. We have wondered in the past whether regulations are going to tighten and clamp down upon bleeding pneumatic devices, especially high bleed pneumatic devices, and create large capex burdens on companies with methane-leaking assets.

In one case, it is surprising to us that a well-known E&P company, advertising itself as one of the ‘greenest’ operators in the US still has over 1,000 high-bleed pneumatic devices across its asset base, or over 10% of all the high-bleed pneumatic devices in the US.

Underlying data into the CO2 intensity of US oil and gas producers is aggregated by basin, by producer and by acreage position here. Another large source of methane leaks is flaring, covered in our note here.

Fugitive methane: what components are leaking?

Components leaking methane in oil and gas

This data-file looks through 35 different technical papers and data-sources to tabulate the methane leaks from different components around the oil and gas industry.


The largest leaks per event are from losses of well control, which can emit 10-1M tons per annum. Next are mid- and downstrseam facilities at 1-10kTpa.

The largest leaks by upstream component are compressor seals (1-100Tpa) and millons of pneumatic devices (0.01-10Tpa), which each comprise c20-30% of total upstream leaks.

Potentially overlooked categories include wellheads, storage tanks and workover practices. All are quantified in the data-file. The theme is addressed in detail in our note, mitigating methane.

Methane Leaks from Downstream Gas Distribution

Methane Leaks from US Dowsntream Gas Distribution

This data-file tabulates the methane emissions from downstream gas distribution across 160 US gas networks, which cover 1.1M miles of mains, 61M metered customers and >90% of the country’s retail gas demand.

Downstream US methane leakages average 0.2% by volume, explaining 5.7kg/boe of emissions. Two thirds of these leaks can be attributed to gas mains. Leakages are correlated with the share of sales to smaller customers. And state-owned utilities appear to have 2x higher leakage rates than public companies.

US gas utilities’ performance is screened to assess c80 distinct companies, including: Altagas, Atmos, Centerpoint, CMS, Dominion, DTE, Duke, Edison, National Grid, PG&E, Sempra, Southern Co, Spire, UGI, WEC & Xcel.

Screen of companies detecting methane leaks?

Screen of companies detecting methane leaks

This data-file is a screen of companies detecting methane leaks and manufacturing equipment to minimize methane leaks. Mitigating methane is an important theme do ensure low carbon intensity as natural gas scales up and displaces coal in the energy transition. So how is this done? And which companies are enabling progress?


Methods available to monitor for methane emissions include Method 21, Optical Gas Imaging, Laser Based Imaging, Fixed Sensors, Ground Labs, Aircraft Flyovers, Drone Surveys and Satellite imagery. Technical data are presented on these different topics in the data-file, for example, on spatial resolution, costs and success rates of some of these different options. Some examples are below.

But the main purpose of the file is to aggregate details, into a screen of companies detecting methane leaks and manufacturing equipment to minimize methane leaks.

Looking across the screen, 50 companies are noted in the data-file. Around one-third are public, and two-thirds are private. Around two-thirds are deploying technically ready solutions today, while others are in the trial phase. 

More detailed case studies are also provided in the data-file. For example, we include a case study of Qube, which is an exciting company in advanced sensors, alongside peers such as Soofie and Earthview. Likewise, we included a case study of QLM, which is an exciting company in laser imaging, alongside peers such as Longpath and Mirico.

Operators are also screened, across the dozen largest Energy Majors, to estimate their methane leaks and broader methane intensity across the supply chain.

We have been adding to this screen continuously since 2019. Our sense is that the space is evolving very quickly. For example, in 2021-22, the EPA proposed new regulation, requiring operators to survey for methane leaks, bi-monthly, at 10kg/hr resolution, then to follow up with more sensitive methods to remediate any diagnosed leaks. Many of the companies that are now at commercial stages were founded in the 2015-20 timeframe. This suggests that as we continue updating the screen, more and more companies will be emerging.

Our note into mitigating methane in the energy transition remains a useful reference for the importance of this theme, and our key conclusions.

Methane emissions detract from natural gas?

Impact of Methane on Natural Gas Emissions

This short model calculates the impact of methane emissions on the CO2/boe of burning natural gas, compared against coal. With methane emissions fully controlled, burning gas is c60% lower-CO2 than burning coal.

However, taking natural gas to cause 120x more warming than CO2 over an immediate timeframe, the crossover (where coal emissions and gas emissions are equivalent) is 4% methane intensity. i.e., if 4-20% of methane is leaked, then the total warming from burning natural gas is equivalent to coal’s.

Permian CO2 Emissions by Producer

Permian CO2 Emissions by Producer

This data-file tabulates Permian CO2 intensity based on regulatory disclosures from 20 of the leading producers to the EPA in 2018. Hence we can  calculate the basin’s upstream emissions, in tons and in kg/boe.

The data are fully disaggregated by company, across the 20 largest Permian E&Ps, Majors and independents; and across 18 different categories, such as combustion, flaring, venting, pneumatics, storage tanks and methane leaks.

A positive is that CO2 intensity is -52% correlated with operator production volumes, which suggests CO2 intensity can be reduced over time, as the industry grows and consolidates into the hands of larger companies.

Copyright: Thunder Said Energy, 2019-2024.