This model sets out our US shale production forecasts by basin. It covers the Permian, Bakken, Eagle Ford, Marcellus/Utica and Haynesville, as a function of the rig count, drilling productivity, completion rates, well productivity and type curves. The data-file was last updated in May-2025, revising liquids growth negative in 2025-26, which in turn tightens US gas markets?
What outlook for shale in energy transition?
Shale is a technology paradigm where well productivity has risen by 3-7x over the past decade, through ever greater digitization. Shale economics are very strong, with 20% IRRs at $50/bbl oil on shale oil (model here) or at $2.8/mcf on shale gas (model here). We think 100bn bbls of recoverable shale resources remain in the US and ultimately, liquids production could be ramped up from 10Mbpd in 2023 to 15Mbpd by 2030 (note here).
However the US shale industry has shifted its focus towards capital discipline and ESG. US shale averages 10kg/boe on a Scope 1 upstream basis (data here), shale oil averages 25kg/boe on a full Scope 1&2 basis running up to the refinery gate (data here) and 55kg/boe on a refined basis running up to the point of combustion (data here). The spread is wide, after comparing and contrasting 425 companies here and here. The best decarbonization opportunities for shale are mitigating flaring and methane leaks followed by electrification. Ultimately, we think the best operators could reach CO2 neutrality.
The most important questions on shale are how the resource base and well productivity will trend. This has been the topic of our shale research, and our latest views are covered in our 2024 shale outlook. Historically, we have also undertaken large reviews of the pace of shale technology progress, based on technical papers (examples here and here). There are fifty variables to optimize. And we are most excited about big data techniques, fiber optics and shale-EOR.
Modelling US shale production by basin?
Our model for US shale production looks at each of the main basins, using a factor breakdown. Total production in month T1 = Total production in month T0 + new additions – base declines. To calculate new monthly additions, we multiply (a) number of rigs running (b) wells drilled per rig per month (c) wells completed per well drilled (d) initial production of newly completed wells (IP30). And to calculate the base declines, we fit a best-fit type curve onto the new additions from past months. This model has worked quite smoothly for 6-years now, including history going back to 2011 and forecasts going out through 2030.
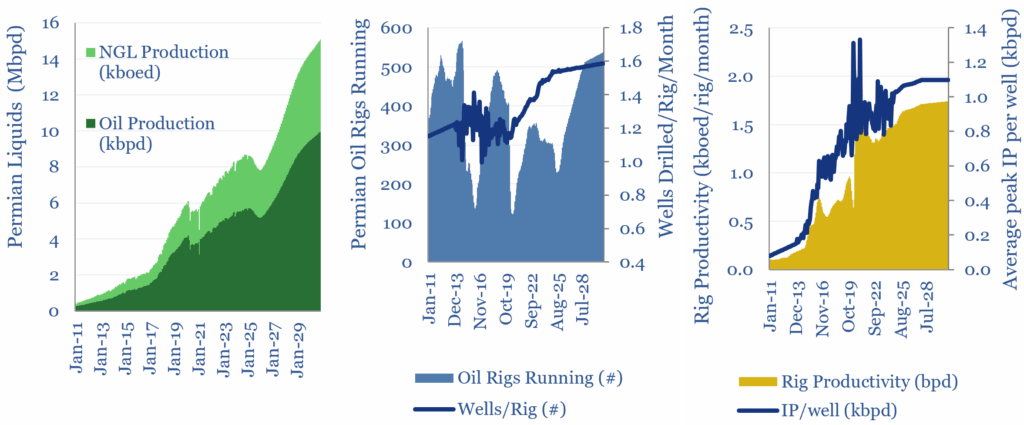
The Permian basin is the largest US shale oil basin, with 8.4Mbpd of total liquids production in 2024. Over the past eight years from 2017-2024, the Permian basin has seen an average of 320 rigs running, drilling an average of 1.3 wells per rig per month, completing 1.05 wells for every well drilled (DUC drawdown) at an initial production rate of 800bpd (IP30 basis), adding +740kbpd/year of new supply to global oil markets. We still see strong growth potential, and the Permian could reach 14Mbpd of total liquids production by 2030, if oil prices recover. All of these variables can be stress-tested in the model.
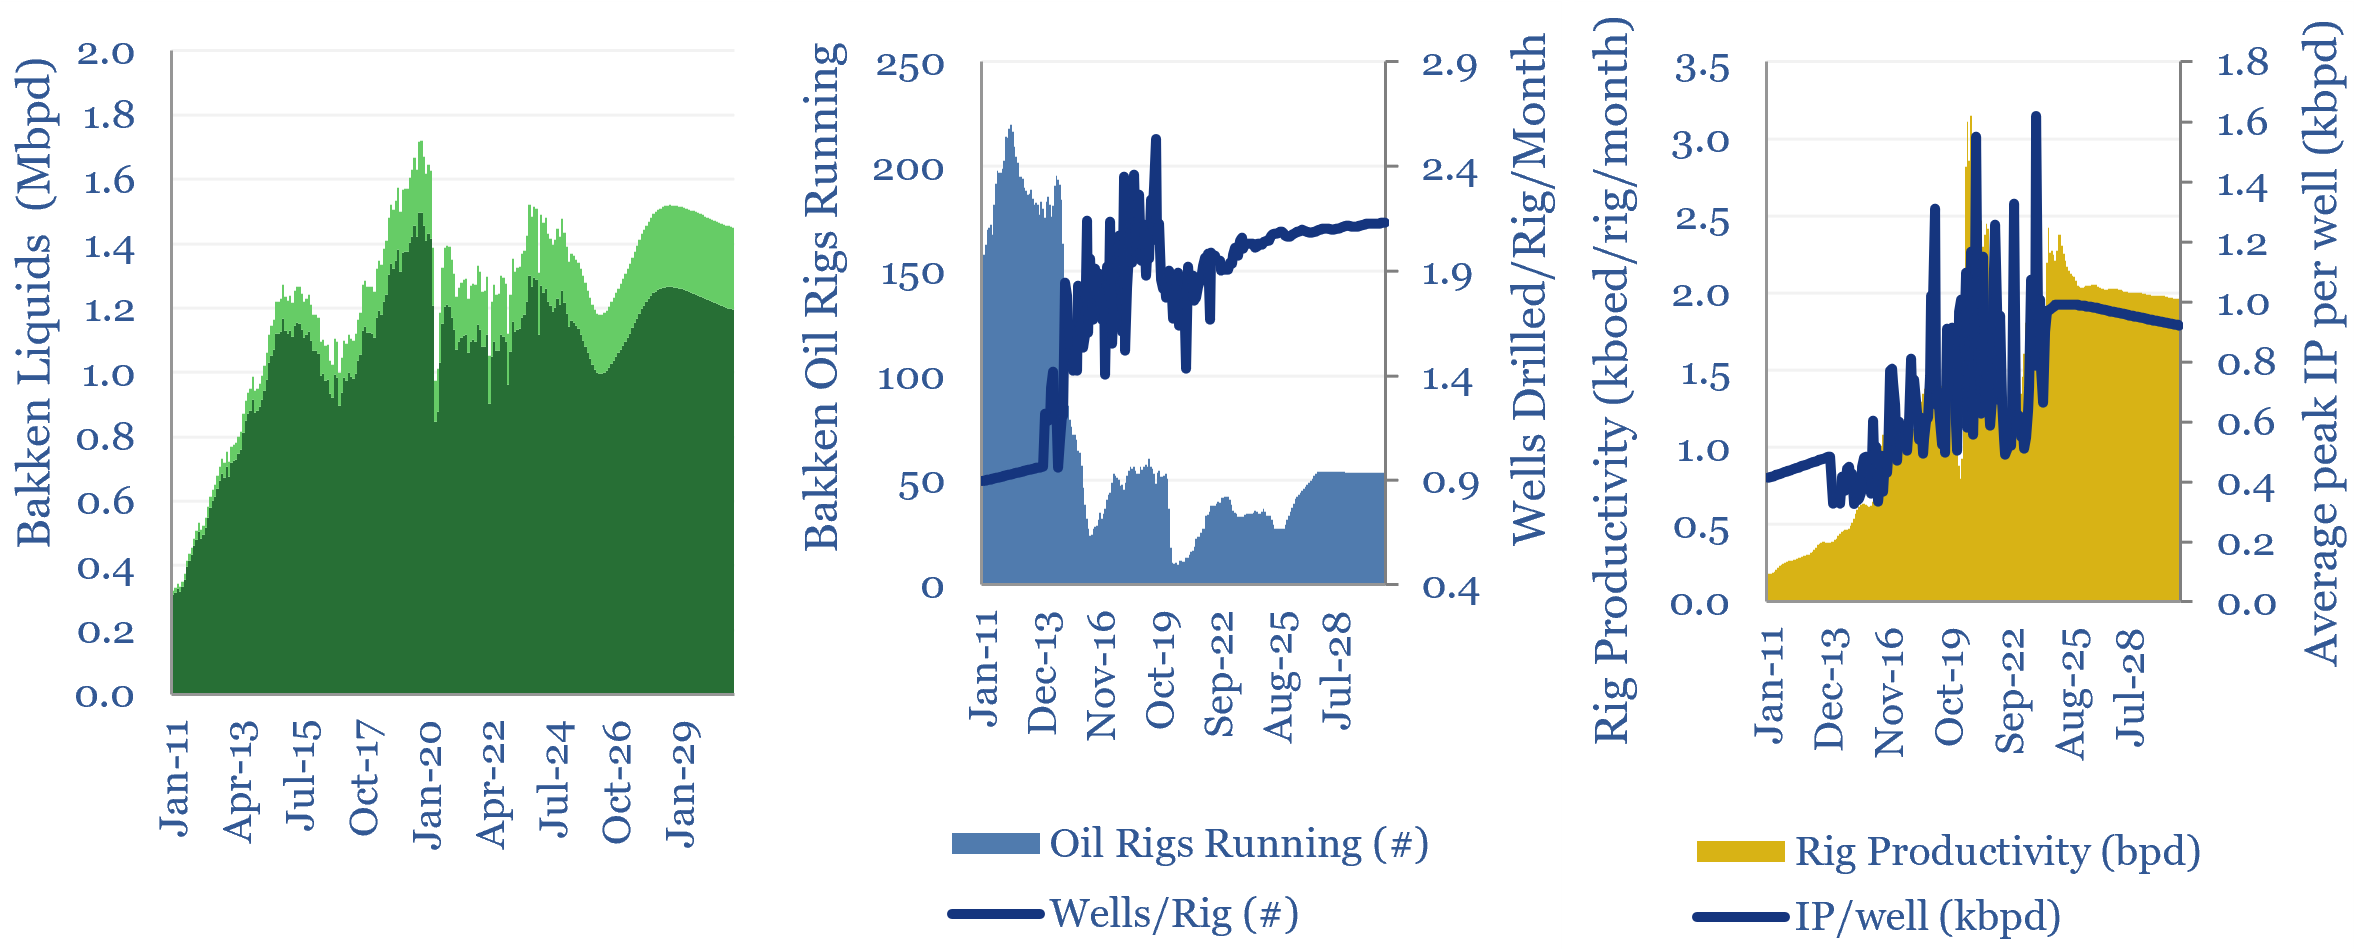
The Bakken is the second largest US shale oil basin, with 1.4Mbpd of total liquids production in 2024. Over the past eight years from 2017-2024, the Bakken has seen an average of 40 rigs running, drilling an average of 1.9 wells per rig per month, completing 1.15 wells for every well drilled (DUC drawdown) at an initial production rate of 770bpd (IP30 basis), adding +40kbpd/year of new supply to global oil markets. We see a plateau through 2030.
The Eagle Ford is the third largest US shale oil basin, with 1.2Mbpd of liquids production in 2024. The Appalachian, comprising the Marcellus and Utica shale plays, is the US’s largest shale gas region, producing 6.3Mboed in 2024. And the Haynesville, at 2.6Mboed in 2024, is a particularly important contributor to future US LNG projects. The same charts and forecasts, by rig count, drilling productivity, IP well productivity and decline rates are available for each of these basins too, in the data-file.
Challenges and controversies for US shale?
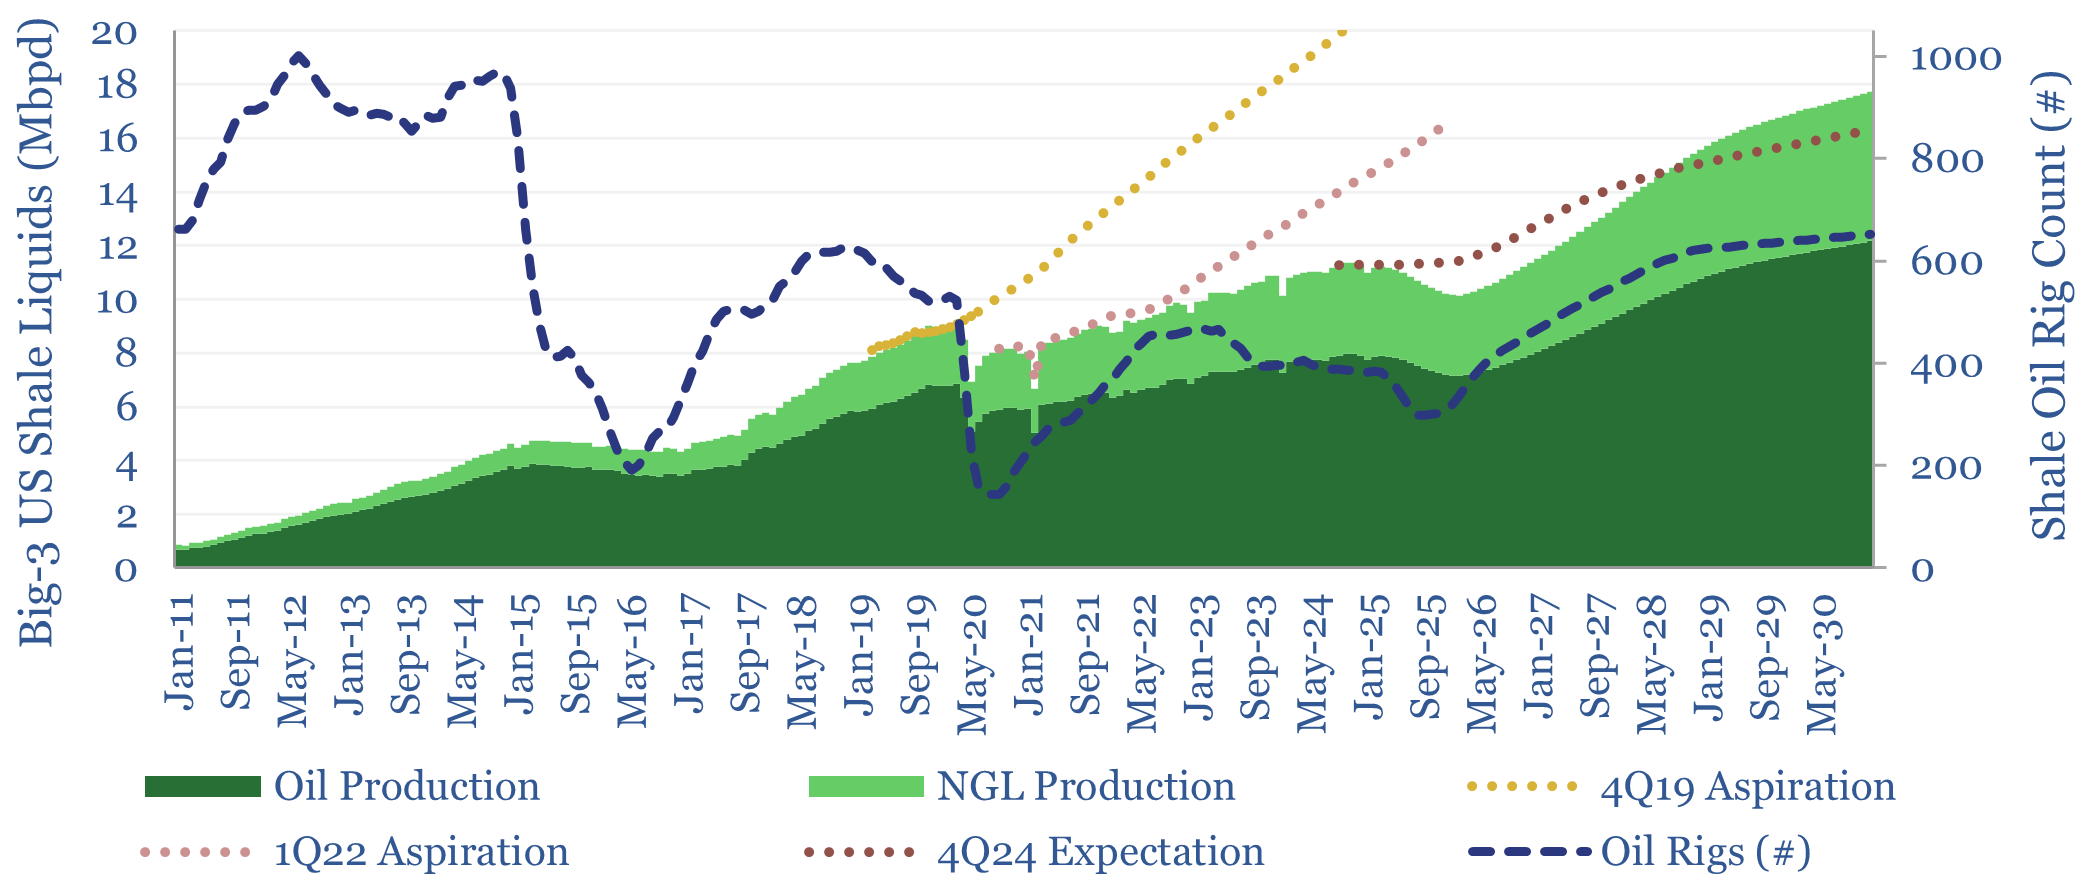
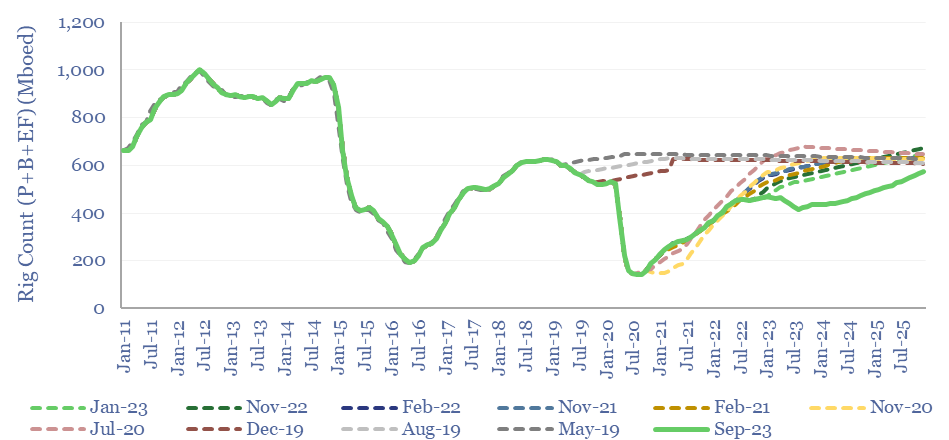
The main revisions to our shale production models have been because of lower activity, as capital discipline has entrenched through the shale industry. The chart below shows our forecasts for activity levels at different, prior publication dates of this model. We have compiled similar charts for all of the different variables and basins, in the ‘revisions’ tab, to show how our shale numbers have changed.
A weak macro environment and falling oil prices are signalling to short-cycle shale producers that their barrels may not be needed this year. Hence we are revising our forecasts. Does weaker oil strengthen US gas ?!
In 4Q24, we saw the ‘Big Three’ shale basins adding +125kbpd of output YoY in 2025, and +600kbpd in 2026, amidst a gently rising rig count. We now see the rig count falling -15% in 2025, then recovering +20% in 2026. This leads to liquids output falling -200kbpd/year in both 2025 and 2026.
One reason for this situation is continued productivity growth. Permian IPs at 1.03kbpd/well in 1Q25, up from 0.94Mbpd/well in 1Q24. And each rig is currently drilling 1.53 wells/month, up from 1.48 well/month in 1Q24.
This is all unexpectedly constructive for US natural gas, which forms the bottom of the cost curve for US power generation. We previously saw the Permian growing and adding 1bcfd/year, which helped meet growing gas demand. But our new outlook sees Permian dry gas production falling by -1.5bcfd YoY in the next twelve months, from 20.1bcfd in March-2025 to 18.6bcfd in March-2026. In turn this would pull harder on US gas basins.
International shale? We have found it harder to get excited about international shale, but there is strong potential in other large hydrocarbon basins, if European shale is ever considered to rescue Europe from persistent gas shortages, and less so in China.
Please download the data-file to stress-test our US shale production forecasts by basin.