Search results for: “renewables”
-
Turbo-charge gas turbines: the economics?
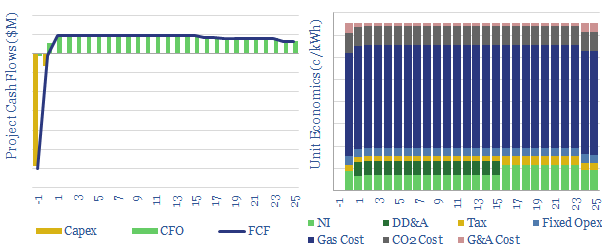
This data-file models the economics of turbo-charging gas turbines, which increases the mass flow of combustion air, to improve their power ratings by c10-20%. IRRs are solid. Turbo-charged gas turbines could thus gain greater share as grids become saturated with renewables
-
China Energy Demand and CO2 Emissions, 2000-2060
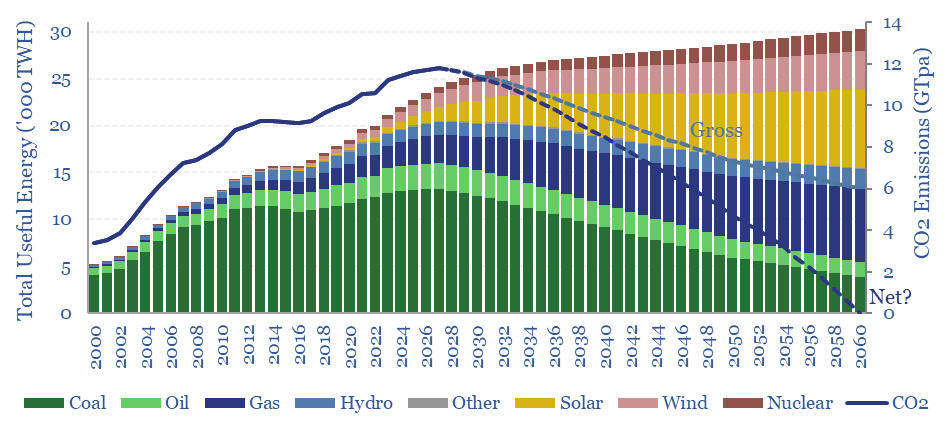
This data-file is our China Energy Model and China CO2 Model, disaggregating China’s energy demand by industry, across coal, oil, gas, wind, solar, hydro and nuclear, across c200 lines, from 2000-2060, with 20-input variables that can be stress-tested. There are routes to reach Net Zero in China by 2060, but it requires some heroic assumptions.
-
Vertical greenhouses: what future in the transition?
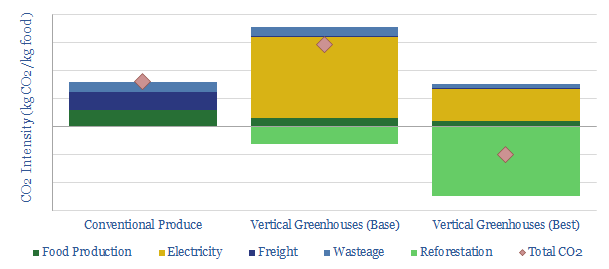
Vertical greenhouses achieve 10-400x greater yields per acre than field-growing, stacking layers of plants indoors, and illuminating each layer with LEDs. Economics are exciting. CO2 intensity varies. But it can be carbon-negative if powered by renewables. This 17-page case study outlines the opportunity.
-
Ethane cracking: the economics?
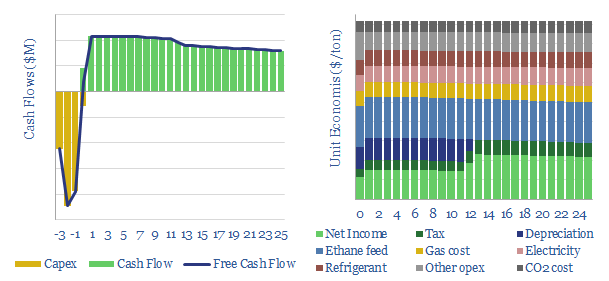
This data-file captures the economics of ethane-cracking to produce ethylene. A typical US Gulf Coast facility could generate 15% IRRs at typical capex cost of $1,135/Tpa. CO2 intensity can be as high as 1.7T of CO2 per ton of ethylene, or potentially much lower depending on the facility’s energy efficiency.
-
Cryogenic air separation: costs and energy economics?
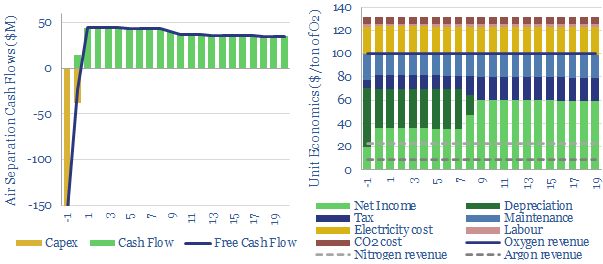
This data-file calculates the costs of cryogenic air separation units, which are important in the production of industrial gases, ammonia, metals, materials, medical applications and new energy technologies such as blue hydrogen. Good base cases are $100/ton oxygen, $20/ton nitrogen, $200/Tpa capex and 60kWh/ton of electricity (on an input air basis).
-
Copper: global demand forecasts?
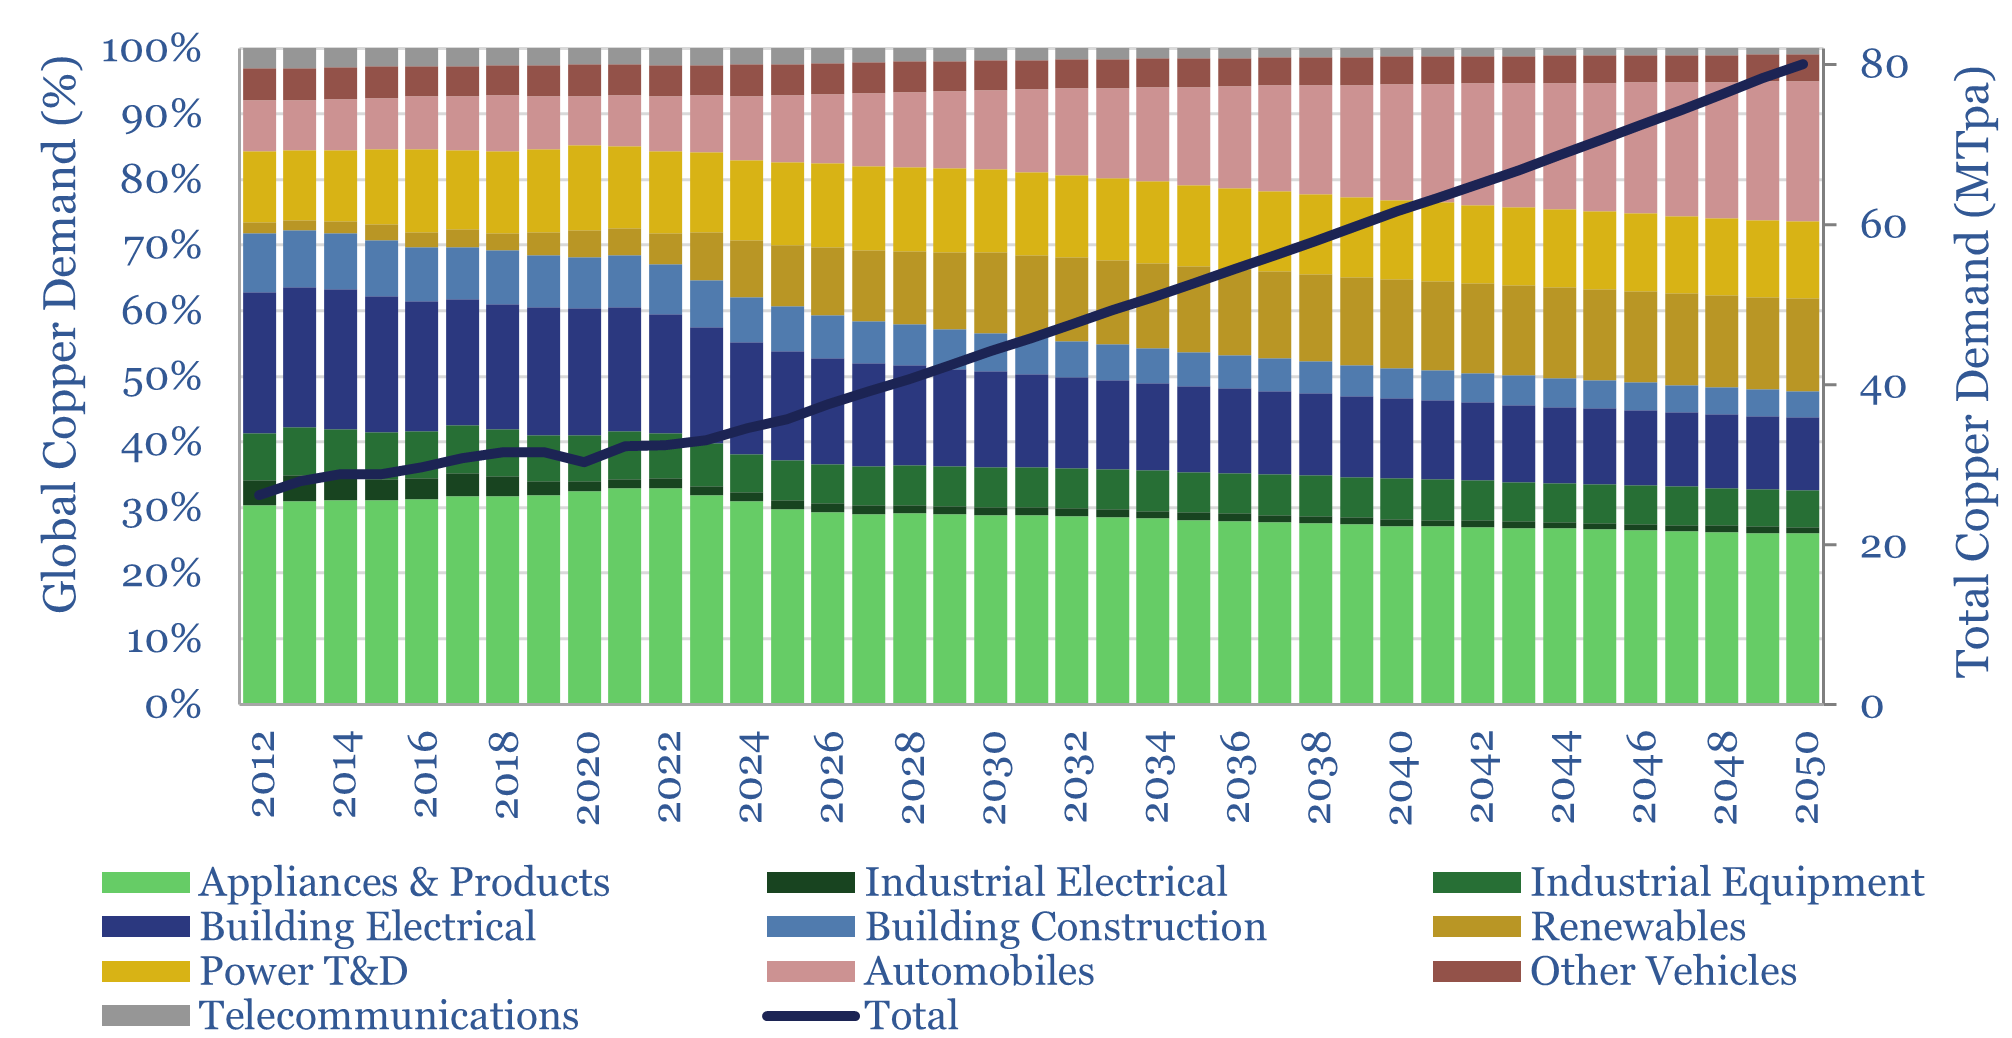
This data-file estimates global copper demand as part of the energy transition, rising from 33MTpa in 2023 to 44MTpa in 2030 and 80MTpa by 2050. Key demand drivers are solar, EVs, greater AC adoption and possibly drones and robotics. You can stress test half-a-dozen key input variables in the model.
-
Inter-correlations between offshore wind farms?
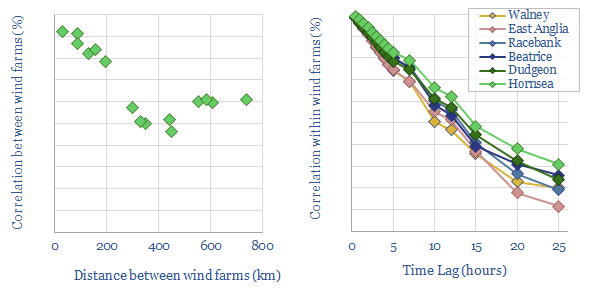
This data-file examines the correlations between different wind farms’ generation rates. The output from individual wind farms is 67% correlated on average, at any given point in time, and as high as 90% with a 100km x 100km area. Auto-correlation was also high, as windy/non-windy periods can last 2-10 days.
-
Power grids: hell is a hot, still summer’s day?
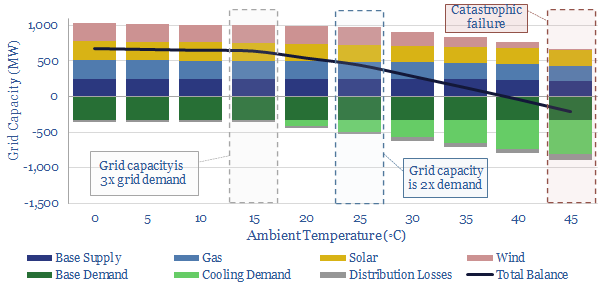
Ramping renewables to 50% of power grids is a growing aspiration in the energy transition. But in some markets, it may result in devastating blackouts during summer heatwaves, as power demand doubles exactly when wind, solar, gas, transmission losses and disruptions all deteriorate. This 15-page note assesses the implications.
-
Copper: the economics?
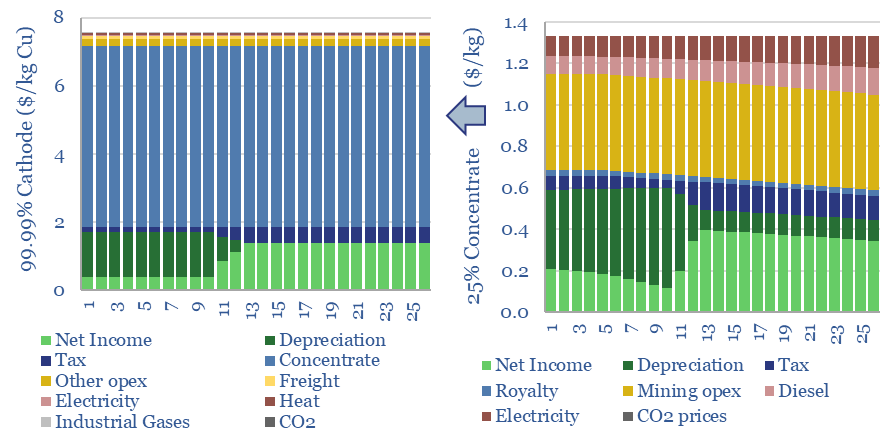
The economic cost of copper production is build up from first princples in this model, from mine, to concentrator, to smelter to 99.99% pure copper cathodes. Our base case is $7.5/kg copper cathode, with 4 tons/ton CO2 intensity, after starting from an 0.57% ore grade. Numbers vary sharply and can be stress-tested in the data-file.
-
TSE Patent Assessments: a summary?
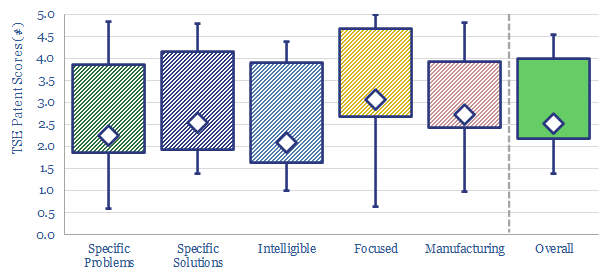
This data-file aggregates all of our patent assessments into a single reference file, so different companies’ scores can be compared and contrasted. Our average score is 3.5 out of 5.0. Skew is to the downside. Intelligibility is the biggest challenge. Scores correlate with TRL and revenues.
Content by Category
- Batteries (88)
- Biofuels (44)
- Carbon Intensity (49)
- CCS (63)
- CO2 Removals (9)
- Coal (38)
- Company Diligence (93)
- Data Models (831)
- Decarbonization (159)
- Demand (110)
- Digital (58)
- Downstream (44)
- Economic Model (203)
- Energy Efficiency (75)
- Hydrogen (63)
- Industry Data (278)
- LNG (48)
- Materials (82)
- Metals (77)
- Midstream (43)
- Natural Gas (148)
- Nature (76)
- Nuclear (23)
- Oil (164)
- Patents (38)
- Plastics (44)
- Power Grids (127)
- Renewables (149)
- Screen (114)
- Semiconductors (30)
- Shale (51)
- Solar (67)
- Supply-Demand (45)
- Vehicles (90)
- Wind (43)
- Written Research (351)