-
Aixtron: power GaN MOCVD technology?

Aixtron has a market leading position in GaN MOCVD technology, which is increasingly used in the power electronics of data centers, solar and EVs. This data-file assesses 20 patents from Aixtron and Veeco, to unpack how GaN MOCVD works, what are the key challenges, and to quantify Aixtron’s potential moat.
-
Development capex: long-term spending from Oil Majors?

This data-file tabulates the five ‘Big Oil’ Super-Majors’ development capex from the mid-1990s, in headline terms (billions of dollars) and in per-barrel terms ($/boe of production). Real development capex quadrupled from $6/boe in 1995-2000 to $24/boe in 2010-15, collapsed to $10/boe, then recovered to $13.5/boe.
-
Global oil demand: breakdown by product by country?
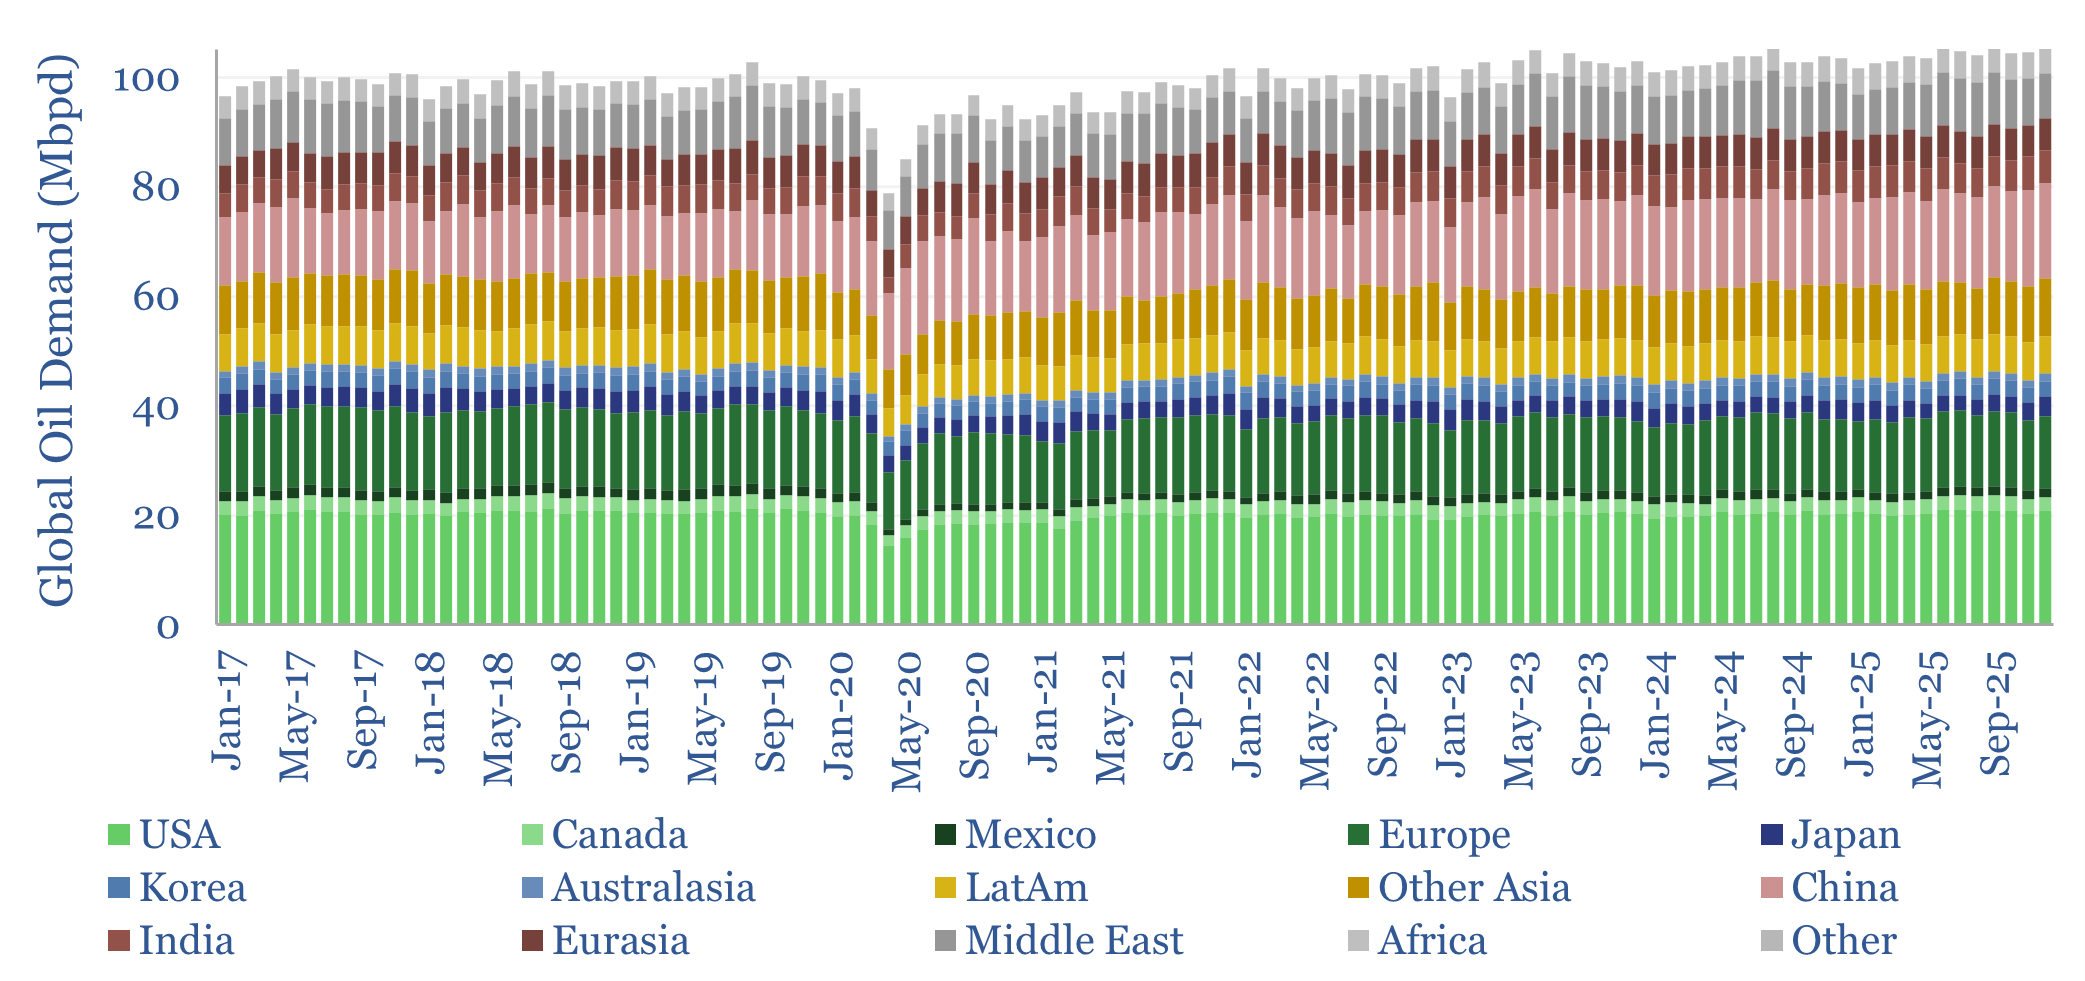
This data-file breaks down global oil demand, country-by-country, product-by-product, month-by-month, across 2017-2025. Global oil demand ran at 104 Mbpd in 2025, for +1.0 Mbpd of growth. For perspective, global oil demand rose at +1.2Mbpd per year in the 30-years from 1989->2019, so there is not much evidence, on face value, that “peak oil is nigh”.
-
Global commodity demand: sensitivity to GDP?
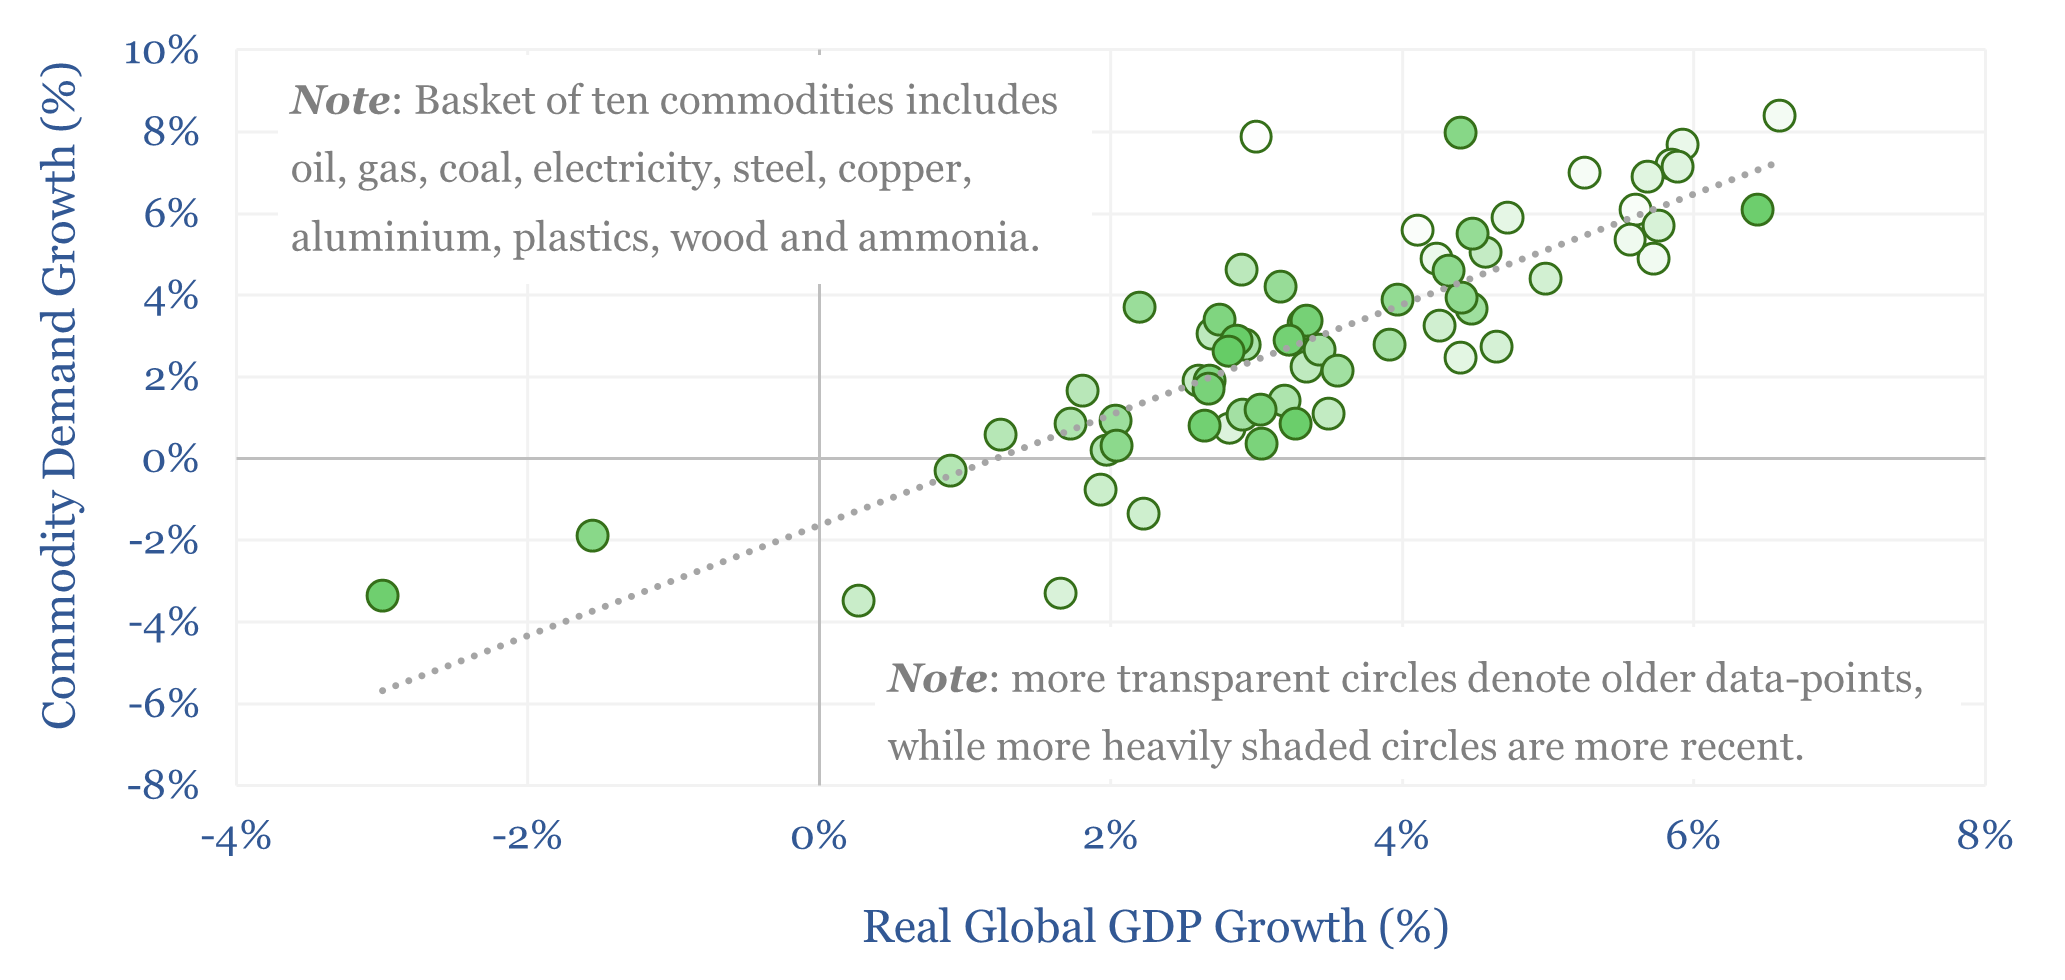
Global commodity demand is levered to GDP. Specifically, for each +/- 1% acceleration or deceleration in global GDP, commodity demand tends to accelerate or decelerate by +/- 1.4%, with a 70% R-squared, across 25 examples that are indexed in this data-file. Oil demand sensitivity to GDP is particularly interesting.
-
Wind turbine manufacturers: market share over time?
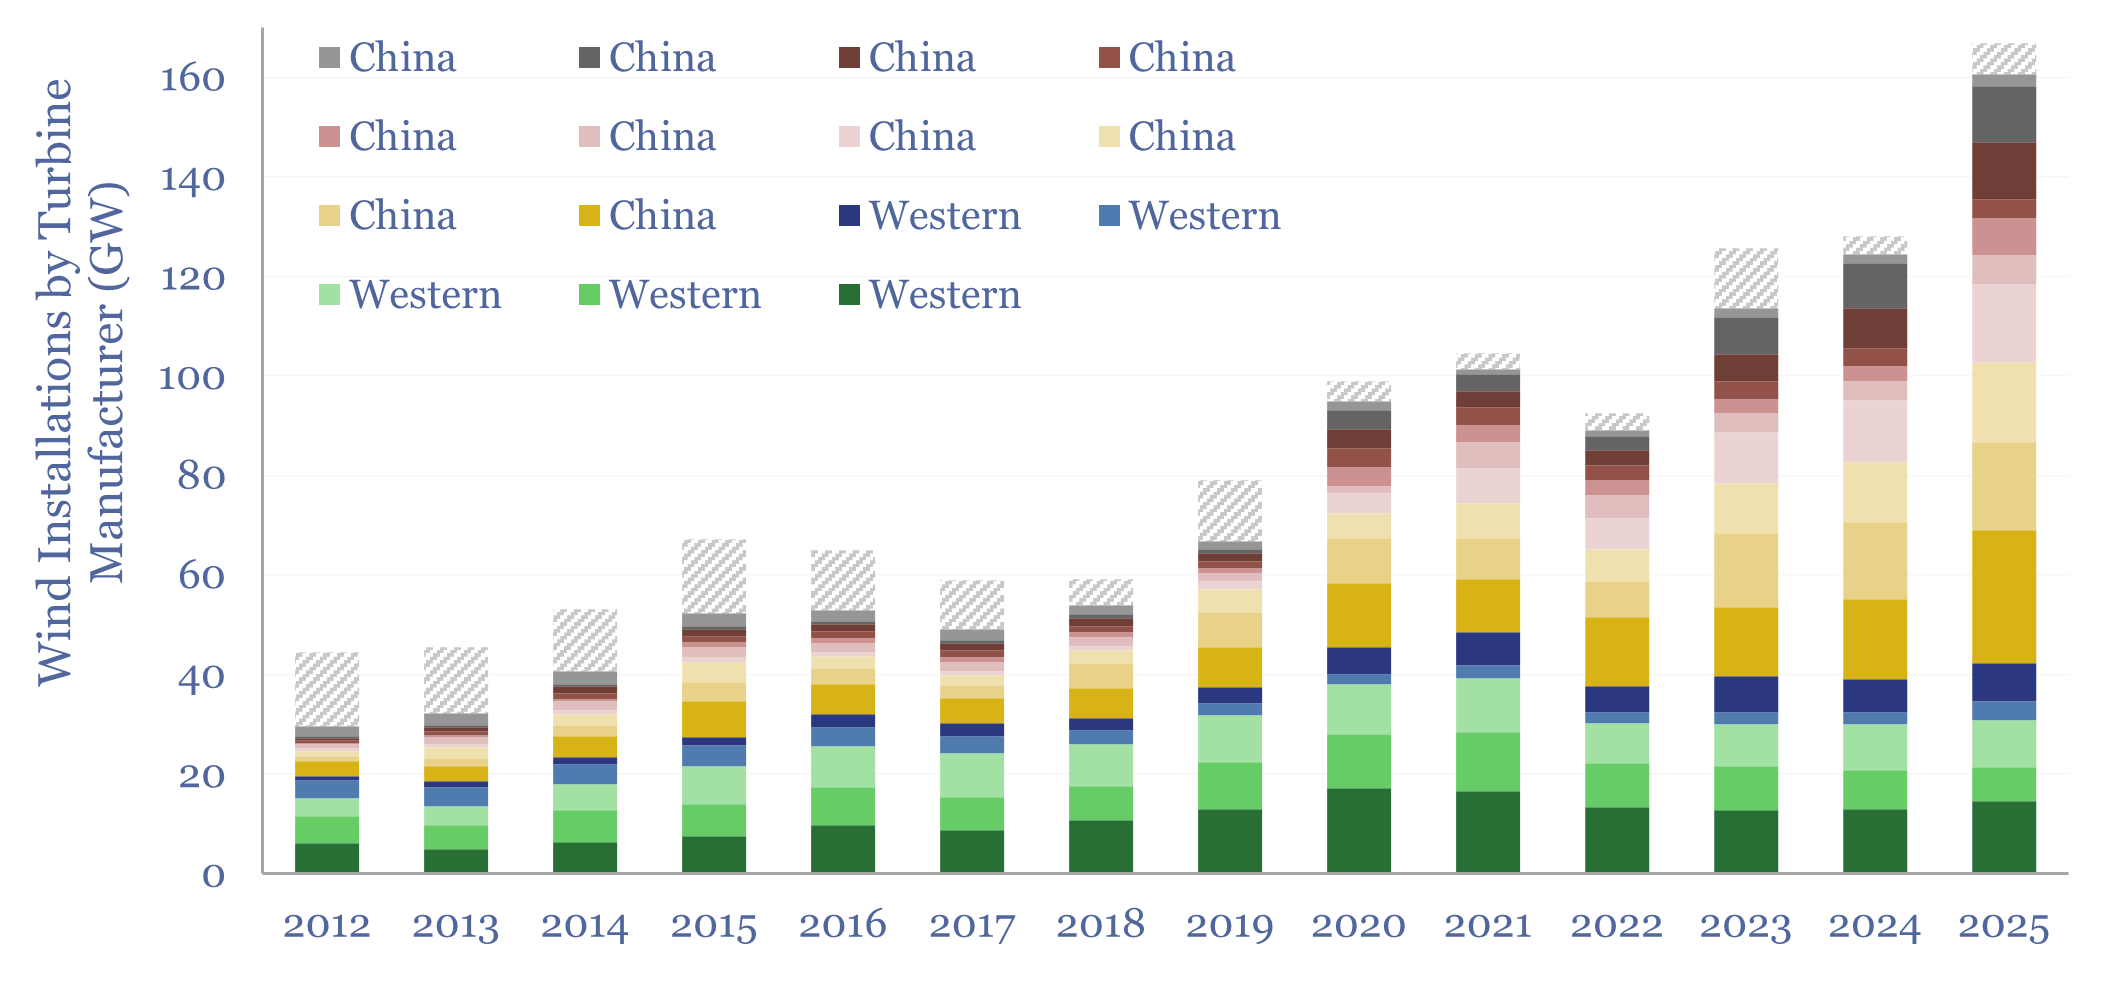
This data-file tracks wind turbine manufacturers, their market shares and their margins over time. By 2025, fifteen companies account for 95% of global wind turbine installations. This includes large Western incumbents, and a growing share for Chinese entrants, which now comprise 70% of the total market, with phenomenal growth in 2025 and continued low selling…
-
Marcellus shale: well by well production database?

This data-file tracks Marcellus shale well productivity, by tabulating the monthly output from 13,000 wells across the Pennsylvania Marcellus, from 2015 to mid-2024. Average IP rates across the basin have risen at a 12% pa CAGR, from around 5 mmcfd in 2015 to 18 mmcfd in 2025. However, activity and productivity differ starkly by operator.
-
Wind and solar capacity additions?
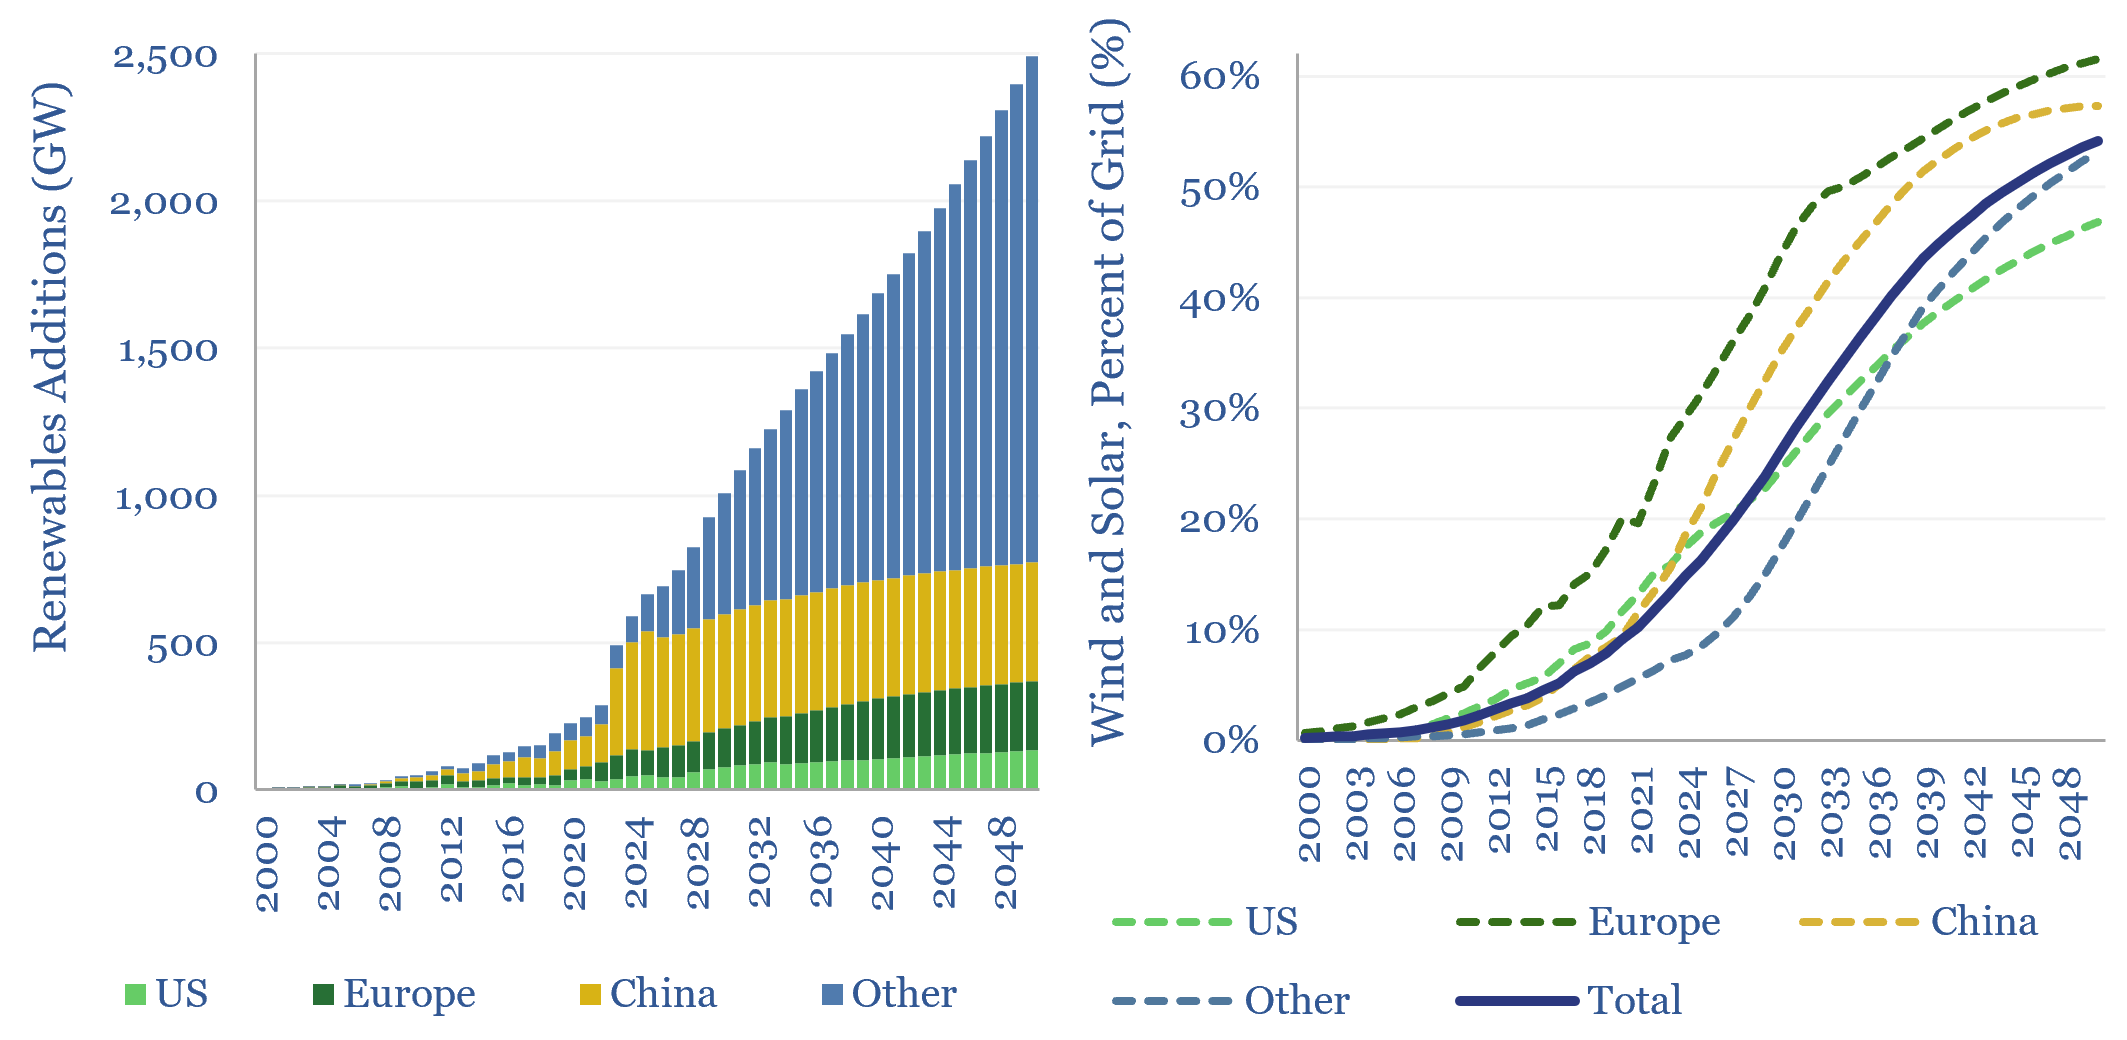
Global wind and solar capacity additions reached 630GW pa (AC-basis) in 2025, which is 3x 2020 levels and 10x 2011 levels. The pace of gross wind and solar capacity additions can rise by a further 3x by 2050, bringing wind and solar to 55% of a greatly expanded global power grid by 2050. Most of…
-
Flexible data centers: can AI load shift?
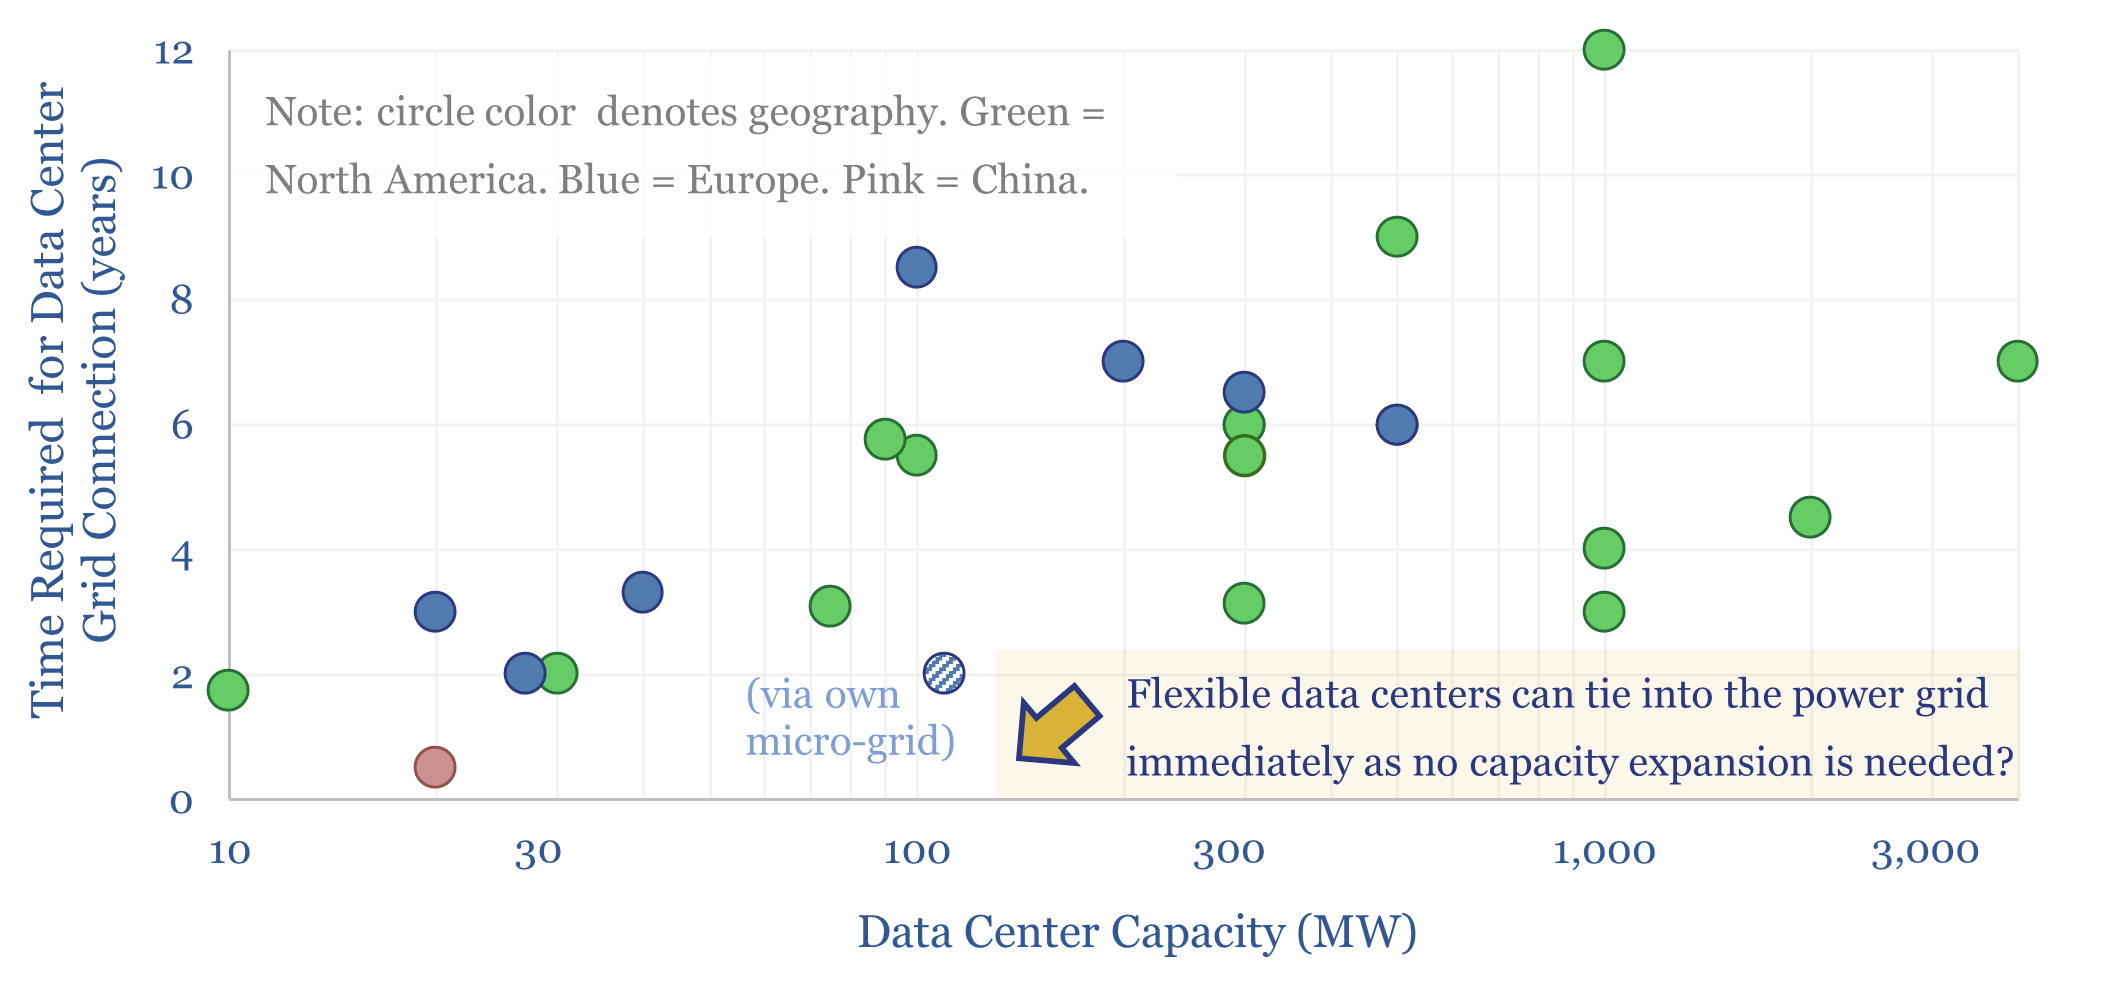
It can take 4-12 years to expand the grid and accommodate large new AI data centers. But what if more flexible data centers could be energized mostly via the pre-existing grid? This 15-page report shows how flexible AI data centers, which engage in demand shifting, are technically feasible, economically justified, and accelerating?
-
LNG bunkering vessel economics?
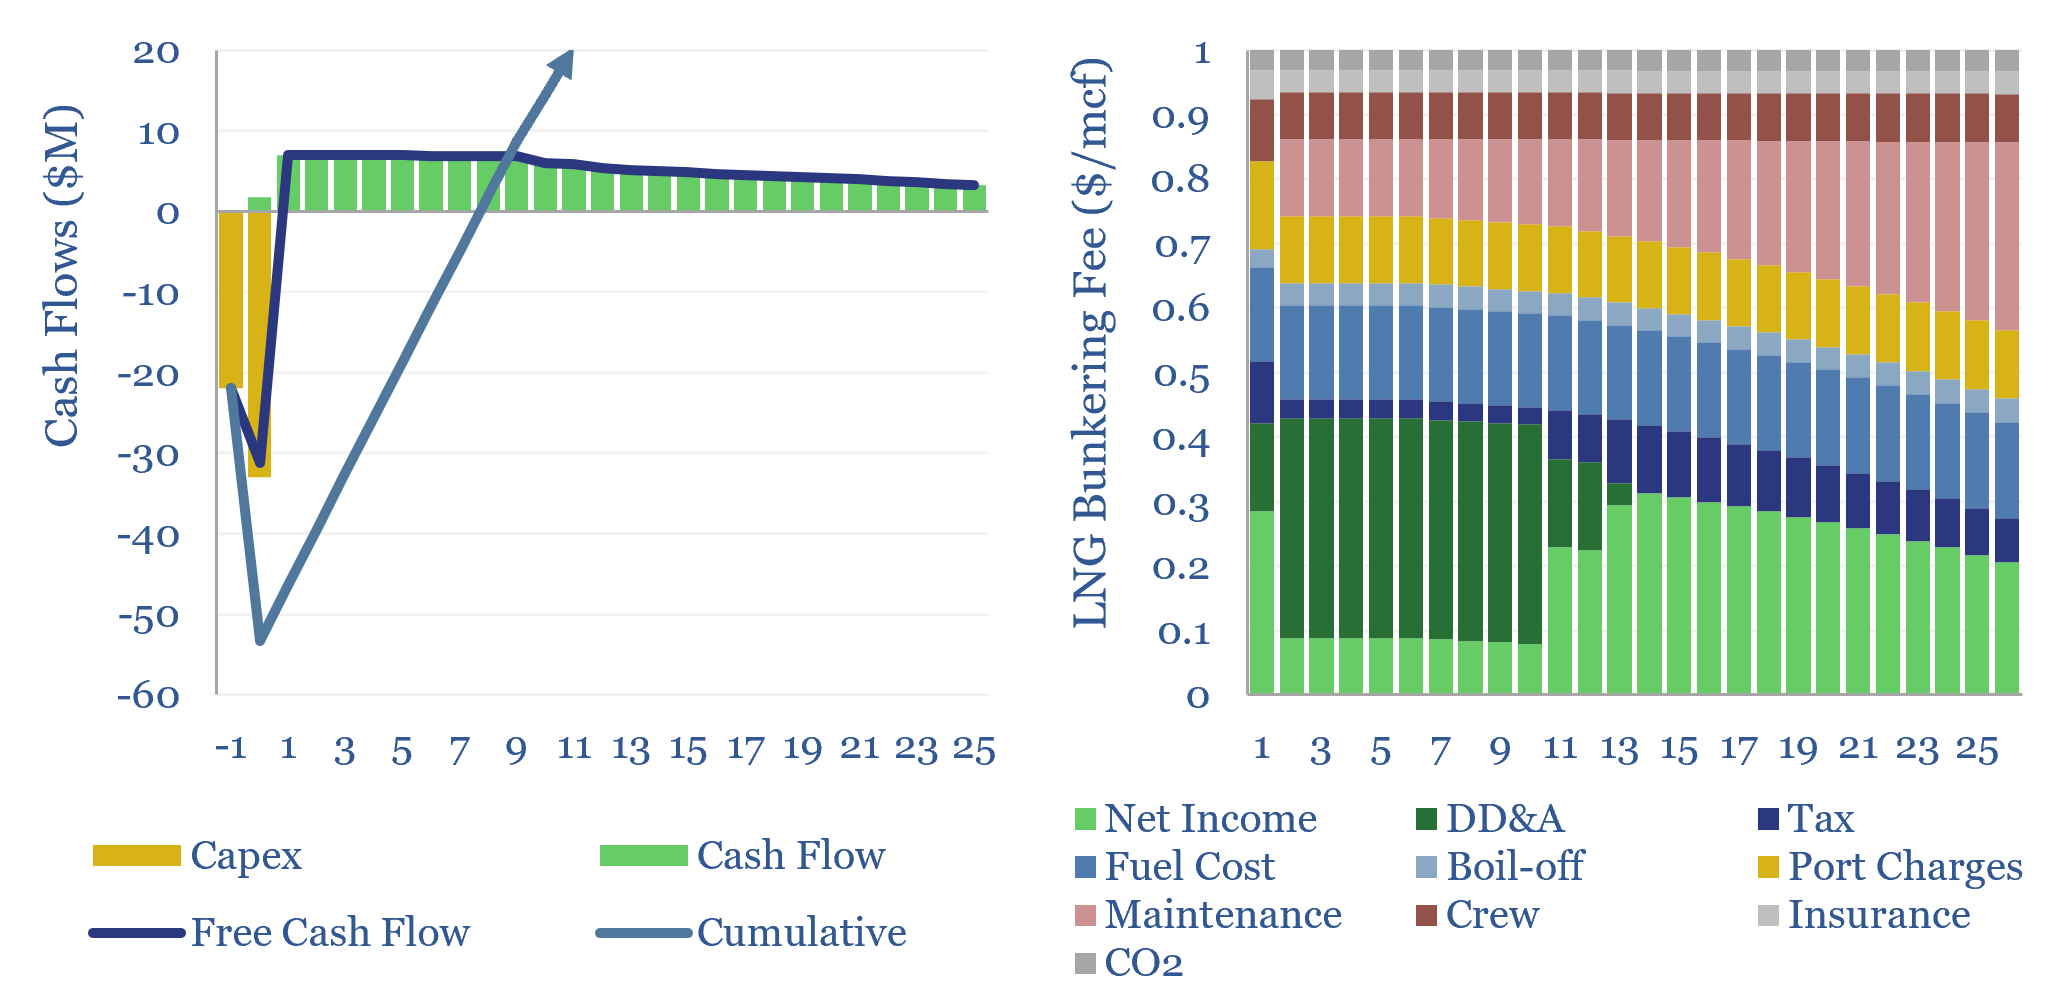
This data-file captures the economics of LNG bunkering vessels. LNG bunkering costs $1/mcf in well-utilized contexts, enabling LNG ship fueling at $8-10/mcf, which is 35% below $2/gal oil products at $70/bbl oil. A 1.5-year payback on dual-fuel vessels could thus see another 10MTpa of LNG used in shipping by 2030, displacing 250kbpd of oil?
-
Oil tankers: the economics?
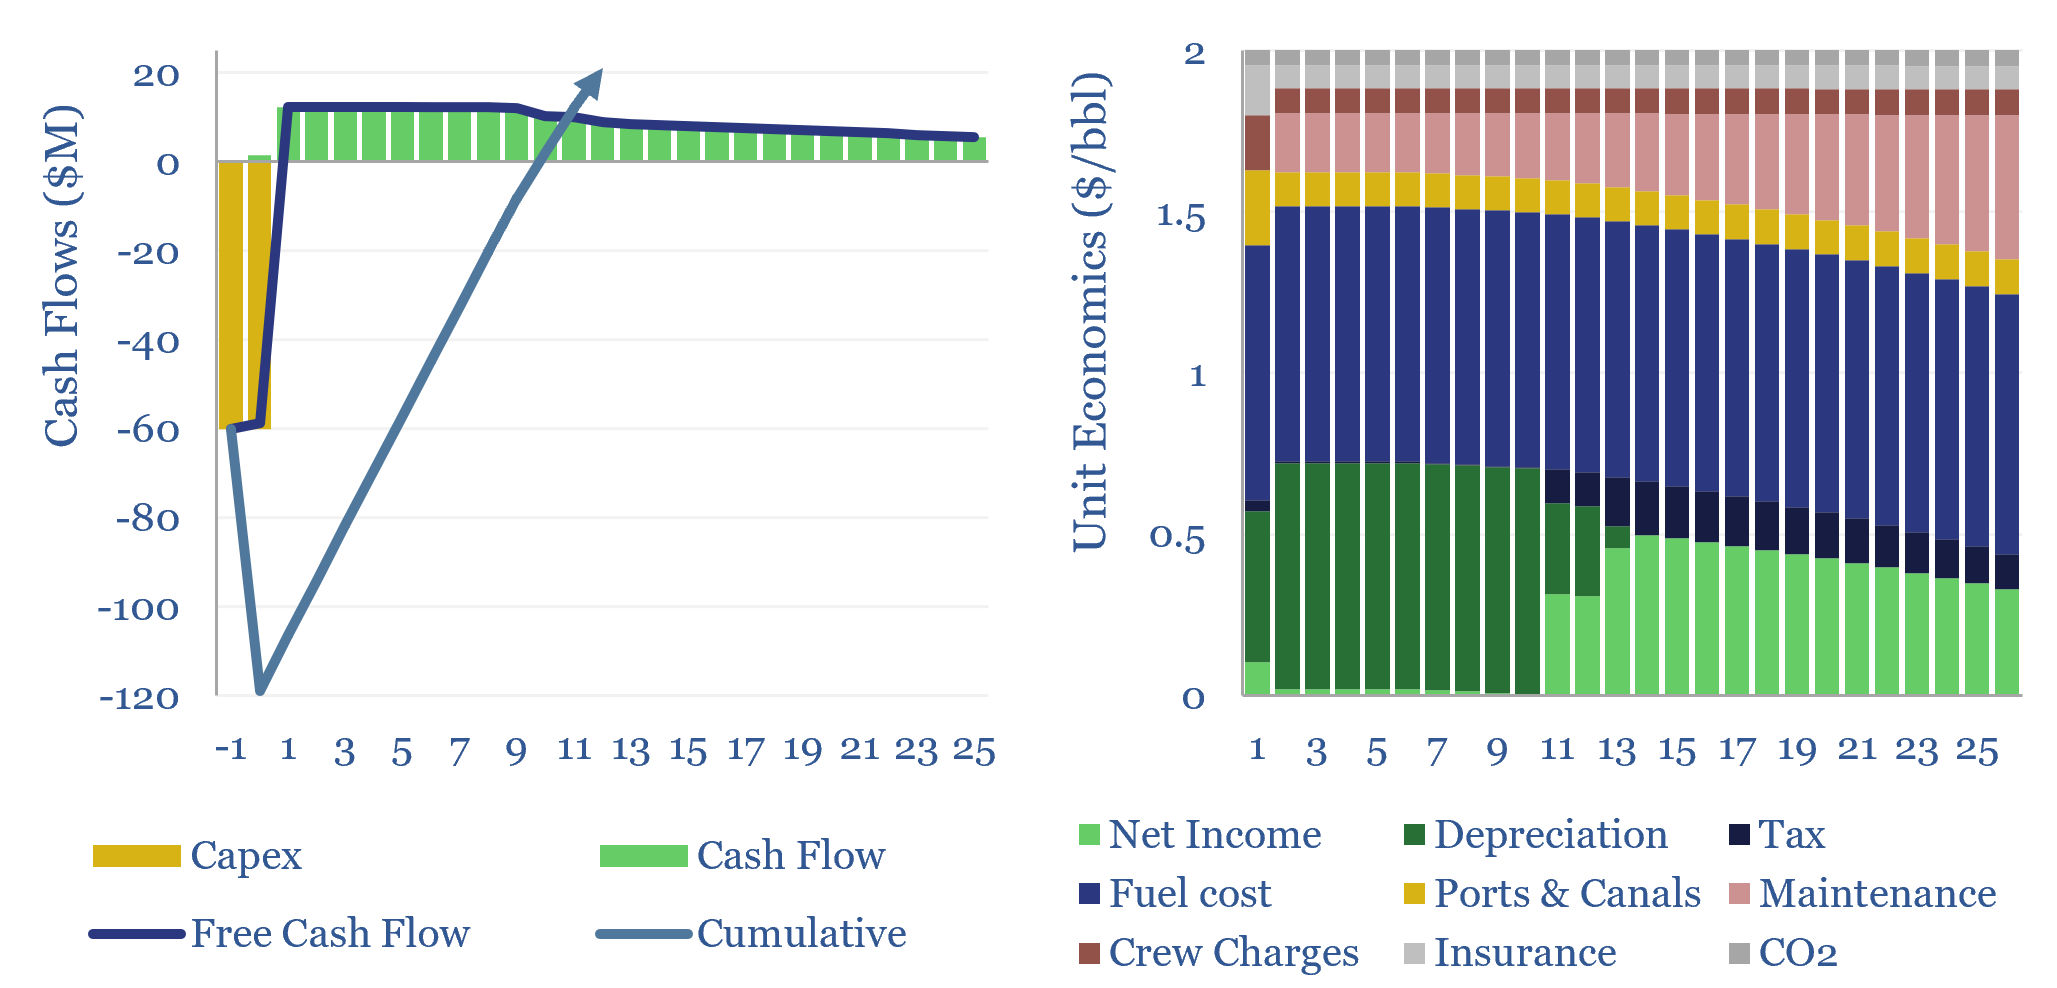
Oil tanker economics are captured in this model. A VLCC that carries 2.2Mbbls requiring a day rate of $100k/day to earn a 7-10% IRR, which equates to $2/bbl on cargoes moving from the Persian Gulf to China. Capex costs, fuel uses, engine sizes and other costs correlate with vessel size. The costs of oil tankers…
Content by Category
- Batteries (95)
- Biofuels (44)
- Carbon Intensity (48)
- CCS (64)
- CO2 Removals (9)
- Coal (41)
- Commentary (65)
- Company Diligence (104)
- Data Models (920)
- Decarbonization (162)
- Demand (129)
- Digital (86)
- Downstream (47)
- Economic Model (220)
- Energy Efficiency (76)
- Hydrogen (63)
- Industry Data (308)
- LNG (56)
- Materials (86)
- Metals (88)
- Midstream (45)
- Natural Gas (161)
- Nature (76)
- Nuclear (28)
- Oil (175)
- Patents (39)
- Plastics (44)
- Power Grids (155)
- Renewables (153)
- Screen (136)
- Semiconductors (35)
- Shale (58)
- Solar (72)
- Supply-Demand (53)
- Vehicles (95)
- Video (24)
- Wind (47)
- Written Research (405)