East to West: re-shoring the energy transition?

re-shoring the energy transition

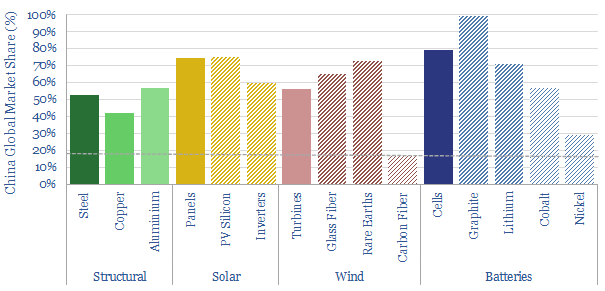
China is 18% of the world’s people and GDP. But it makes c50% of the world’s metals, 60% of its wind turbines, 70% of its solar panels and 80% of its lithium ion batteries. Re-shoring the energy transition will likely be a growing motivation after events of 2022. This 14-page note explores resultant opportunities.


World events in 2022 have created a new appetite for self-reliance; avoiding excessive dependence upon particular suppliers, in case that relationship should sour in the future. China’s exports are 5x Russia’s. And it dominates supply chains that matter for the energy transition. The trends and market shares are quantified on pages 2-4.

There are five challenges that must be overcome, in order to re-shore value chains from China to the West: input materials, energy costs, 2-3 re-inflation risks, dumping and general Western NIMBY-ism. We outline each challenge on pages 5-6.

Re-shoring the energy transition and its best opportunities are summarized, looking across all of our research, for metals and materials (page 7), wind (page 8), solar (page 9) and batteries (pages 10-11). In each case, where would be the most logical to site the infrastructure, and which companies are involved?

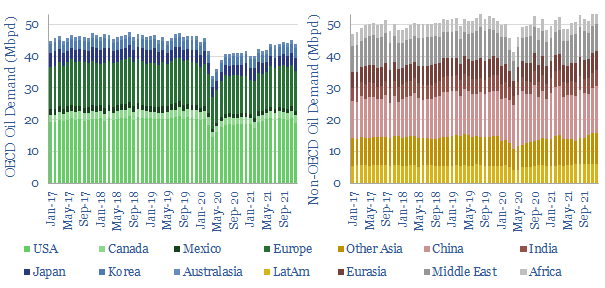
An unexpected implication of re-shoring these value chains is that their underlying energy demand would be re-shored too. Our current base case is that Western energy demand per capita has peaked and Western oil demand is in absolute decline. These markets may be re-shaped, with resultant opportunities for infrastructure investors (pages 12-14).

For an outlook on China’s coal industry and how we compare Chinese coal companies to Western companies, please see our article here.

Power transmission: raising electrical potential?

HVDCs in energy transition

Electricity transmission matters in the energy transition, integrating dispersed renewables over long distances to reach growing demand centers. This 15-page note argues future transmission needs will favor large HVDCs in energy transition, costing 2-3c/kWh per 1,000km, which are materially lower-cost and more efficient than other alternatives. What opportunities follow?


Long distance power transmission is likely to grow more important in the energy transition. There are six reasons for this claim, especially linked to wind and solar, which are laid out on pages 2-4.

The simple physics of power transmission are laid out on pages 5-7, with worked examples showing how the existing grid transmits relatively small power quantities over relatively low distances, but resistive power losses ‘blow up’ if we try to expand AC power lines.

Overcoming these challenges via higher voltages and thicker power cables is not really feasible, especially as reactive power consumption becomes the limiting factor on AC lines. Again, the techno-economic theory behind these claims is laid out on pages 8-11.

HVDC lines melt away many of the problems noted above. We outline the reasons on page 12, along with real-world data from world-leading HVDC projects that have been constructed in China since 2010.

Economics. We think HVDCs can deliver multi-GW power, over distances around 3,000km, for total transmission spreads of 5-10c/kWh. Underlying assumptions, and comparisons with other technologies — batteries, hydrogen — are given on page 13.

Who benefits? Some of the leading companies in HVDC, and interesting new project proposals are discussed on page 14.

To read more on HVDCs in energy transition and its leading companies, please see our article here.

Wood use: what CO2 credentials?

Wood use CO2 impacts

The carbon credentials of wood are not black-and-white. They depend on context. So this 13-page note, focusing on wood use CO2 impacts, draws out the numbers and five key conclusions. They highlight climate negatives for deforestation, climate positives for using waste wood and wood materials (with some debate around paper), and very strong climate positives for natural gas.


The CO2 accumulation profile of a forest is set out on pages 2-3. For example, a mature forest absorbs 90% less net CO2 each year than a young forest. This is our baseline for assessing carbon counterfactuals, and numbers can be flexed in our underlying data-file.

Deforestation has net climate negatives across the board. It even emits 35% less CO2 to burn coal (i.e., forests that have been dead for 100M years) than to cut down and burn living forests (page 4).

Conversely, gathering waste wood that has fallen to the forest floor and would otherwise decompose is ‘climate positive’ across every category that we assessed, with other hidden climate benefits (page 5).

Wood materials are the best use of wood, as each ton of sustainably harvested timber avoids 0.5 – 1.2 tons of net CO2 versus using other industrial materials. The note explores how wood product and chemicals companies might benefit from this theme, although paper is an exception and much more debatable (page 6-8).

Wood fuels are still used remarkably widely. But the carbon in lignin and cellulose is already part oxidized, so there is less energy “left to release” as it is converted to CO2. Whereas natural gas derives c54% of its energy release from hydrogen atoms converting to innocuous water vapor. This means each MTpa of LNG can displace an astonishing 10MTpa of CO2 where it prevents the burning of wood from deforestation (pages 9-11).

Biomass power can make sense in some contexts, but only when the wood is sustainably sourced, clearly substitutes coal and helps diversify energy sources/security (page 12).

Our key conclusions and implications for decision-makers are provided on page 13.

Direct lithium extraction: ten grains of salt?

Direct Lithium Extraction

Direct Lithium Extraction from brines could help lithium scale 30x in the Energy Transition; with costs and CO2 intensities 30-70% below mined lithium; while avoiding the 1-2 year time-lags of evaporative salars. This 15-page note reviews the top ten challenges that decision-makers need to de-risk, in order to get excited within the fast-evolving DLE landscape.


The need to ramp lithium 30x in the energy transition is re-capped on pages 2-3, including why this is one of the most explosive trajectories of any material we have tracked, and becoming a painful bottleneck in 2022-23.

Today’s production is dominated by mining (page 4) and evaporative salars (pages 5-6). Each of these has drawbacks, which are covered in the note.

Direct lithium extraction is a kind of holy grail for the lithium industry, a magic process that can separate all and only the lithium ions from the complex ionic soup, even at challenging geothermal brines (example charted above). However, there are ten challenges that need to be overcome before a DLE technology gets truly exciting. They are laid out on pages 8-12.

The extent of these challenges may benefit incumbents in the lithium industry (shown on page 13), as their era of excess returns persists for longer.

Promising DLE leaders are summarized on pages 14-15, along with each company’s recent progress, and the challenges we would focus upon.

For an outlook on mined lithium supply chain, please see our article here.

Energy security: the return of long-term contracts?

Energy commodities

Spot markets have delivered more and more ‘commodities on demand’ over the past half-century. But is this model fit for the energy transition? Many markets are now desperately short, causing explosive price rises. And sufficient volumes may still not be available at any price. So this 13-page note on energy commodities considers a renaissance for long-term contracts and who might benefit?


Liquid spot markets have long been seen as the apotheosis of commodities. Over time, small and immature markets are supposed to graduate towards ever-greater liquidity. Ultimately, the entire market is to be bought and sold at the prevailing prices on some highly liquid exchange, where any seller in the market can reach any buyer in the market, and vice versa. It is a kind of “commodities on demand” model. The history and evolution of this model is laid out on pages 2-3. But 2022 is showing its limitations.

Challenge #1 for liquid spot markets is that prices can explode in a shortage. We review energy costs, price elasticity factors, and their consequences on pages 4-6.

Challenge #2 for liquid spot markets is that even after prices explode, sufficient supplies may still not be available at any price. We zoom in on LNG as an example on pages 7-8. A country that has 90% of its supplies locked in on contracts is clearly going to fare very differently in 2022-23 than one that had planned to source 90% of its supplies from the spot market.

Challenge #3 is securing future supplies amidst uncertainty. No one wants to finance a 20-year project where prices could collapse, volumes could collapse or the commodity in question could even be banned outright. As an OPEC oil minister recently stated “it isn’t going to work like that”.

Could all of this point to a renaissance for long-term contracts? On pages 11-13, we outline what this might look like, who might benefit, and some possible pushbacks.

For an outlook on our top 10 energy commodities with upside in the energy transition, please see our article here.

Graphite: upgrade to premium?

Graphite opportunity in energy transition

Global graphite volumes grow 6x in the energy transition, mostly driven by electric vehicles, while marginal pricing also doubles. We see the industry moving away from China’s near-exclusive control. The future favors a handful of Western producers, integrated from mine to anode, with CO2 intensity below 10kg/kg. This 10-page note on graphite opportunity in energy transition concisely outlines the opportunity.


What is graphite and why does it matter? We outline some history, some chemistry, some market-sizing and the main sources of industrial demand growth on pages 2-3.

The supply chain is explained on page 4-5. Specifically, how is battery-grade graphite made via mined graphite (natural route) and petcoke/coal (synthetic route), and what are the respective CO2 intensities?

Our base case economic model requires $10/kg for a greenfield production facility to earn a 10% IRR. We outline what drives these numbers on pages 6-7.

Surprise bottlenecks? We cannot help wondering whether there is a surprise bottleneck waiting in battery-grade graphite. The rationale is laid out on page 8.

Western companies are described on pages 9-10, including summary profiles of the four leading listed companies, ramping up Western graphite facilities in 2022-25.

To read more about our outlook on graphite opportunity in energy transition, please see our article here.

Finnish forests: a two billion ton CO2 case-study?

Finland forests CO2 removals

Can forestry remove CO2 from the atmosphere at multi-GTpa scale? This 19-page note about Finland forests CO2 removals is a case study , where detailed data goes back a century. 70% of the country is forest. It is managed sustainably, equitably, economically. And forests have sequestered 2GT of CO2 in the past century, offsetting two-thirds of the country’s fossil emissions.


Nature-based carbon removals underpin 25% of all the decarbonization in our roadmap to net zero. The key debate is whether they can scale to this level, measurably, reliably, as covered on pages 2-3.

Finland makes for an excellent case study. An overview of the country, its forests and its forest-centric culture is set out on pages 4-6.

The structure of Finnish forestry is broken down on pages 7-10. Our data are aggregated from Natural Resources Institute Finland, and offer the best, most comprehensive breakdown we have ever encountered on the costs of forest management (across 20 line items), harvesting practices and realized pricing for different categories of wood.

Carbon credentials are calculated on pages 11-12, explaining the maths above: 2GT of CO2 sequestered in the past century, versus 3GT of nationwide fossil emissions.

Productivity data are also excellent, improving at 1% per year over the past century, with biomass yields per hectare almost doubling since the first half of the 20th century. This is mainly through improved forestry practices (pages 13-16).

Conclusions of Finland forests CO2 removals are spelled out on pages 17-19. 110 countries, with 5bn acres of land, have a 1-5x better environment for growing forests than icy Finland. For Brazil, for example, to get repeatedly ‘trounced’ by Finland should be as surprising in forestry as it would be in soccer.

To read more of our outlook on Finland’s forestry product business that aspires to be a leading provider of renewable products, please see our article here.

Nickel solutions: unblocking a battery bottleneck?

Nickel upside energy transition

The global nickel market will grow from $30bn pa to $300bn pa as part of the energy transition, including a 5x increase in volumes and 2x increase in prices. This 15-page note evaluates the nickel supply chain for electric vehicle battery cathodes. Deficits are looming, plus inflationary feedback loops, hence we end by screening nickel names.


An overview of global nickel demand is set out on pages 2-4. We see stainless demand growing with GDP and EV battery demand rising c30x through 2050.

An overview of global nickel supply is set out on pages 5-9. This is a complex supply chain. Only a subset of processes and nickel grades can satiate demand for EV cathodes. We focus in on a laterite – HPAL – MHP – nickel sulphate pathway in this work.

Nickels and dimes. Economics of producing battery grade nickel (in $/ton) are captured on page 10, as a function of a dozen input variables, which can be stress-tested. Our marginal cost estimate is around $11,500/ton with a CO2 intensity of 15 tons/ton.

Nickel bars. There are three bottlenecks to ramping up battery grade nickel production, outlined on pages 11-12. We argue these may settle long-term future prices closer to $20,000/ton.

Upside for nickel in the energy transition is compared with other materials that have crossed our screens on page 13. It is one of the toppier examples.

A screen of nickel companies is presented on page 14-15, covering incumbents, diversified miners, specialists and growth projects.

To find out which companies dominate the world’s nickel production, please see our article here.

Global oil demand: rumors of my death?

Oil demand during COVID

‘Rumors of my death have been greatly exaggerated’. Mark Twain’s quote also applies to global oil consumption. This note aggregates demand data for 8 oil products and 120 countries over the COVID pandemic. We see 3.5Mbpd of pent-up demand ‘upside’, acting as a floor on medium-term oil prices.


We have compiled a database covering the entire global oil market, month by month, product by product, country by country, from 2017 through the end of 2021. We explain our database and some data quality issues on page 2.

The COVID pandemic is quantified in oil market terms on page 3. Global oil demand fell -22Mbpd at trough in April-2020, -9Mbpd YoY in 2020 as a whole. The declines were about 2x steeper in OECD countries versus non-OECD countries. Although global oil demand had returned above 2019 levels in Nov-Dec 21, there is still 3.5Mbpd of pent up demand.

Jet fuel is the biggest source. This is pretty clear from the charts on page 4.

Low income countries are the second largest source. Again, this is clear from the charts on page 5.

The gasoline market is bifurcating. OECD consumers have not fully resumed travelling, while EM demand is now 1Mbpd above 2019 levels, per page 6.

Another c20Mbpd of other oil products have shown inexorable increases throughout COVID-times, per page 7.

Our conclusions for oil demand during COVID are outlined on pages 8-9. Pent-up demand suggests oil prices must rise to whatever level prevents the demand from coming back.

A final post-script shows that Russia cannot win the war in Ukraine. The analogy from COVID is that OECD countries could displace all Russian exports from the market 1.5x over, if the political will was there for behavioral changes c65% as extreme as during COVID.

To see our calculations for the long-run oil demand to 2050, please see our article here.

Energy transition: the world turned upside down?

Alleviate energy shortages

This 14-page note evaluates short- and medium-term options to alleviate energy shortages, which are now the second largest problem in the world. Despite a lot of posturing, we see ‘new energies’ slowing down in 2022-23. The world is upside down and somehow coal is going to be an unexpected savior.


What happens in an energy shortage? In 2022, energy will absorb the largest share of GDP and consumer expenditures on record. We present the data on pages 2-3 and the challenges thereby created.

Curtailing demand is the only short-term option to alleviate energy shortages. There are three possible mechanisms of demand destruction, described on pages 4-5. There are no good options here, only ‘less bad’ ones.

Increasing energy supplies will be determined by what can actually increase. The largest option is coal, then short-cycle shale, as quantified on pages 6-8.

Doubling down on new energies may paradoxically exacerbate the energy shortages, as many of these technologies have ‘energy paybacks’ over 1-2 years (chart above). We want to do these things in the long-run. But they become harder in the short-run (pages 9-12).

Seven predictions are offered for decision-makers on pages 13-14. These are our best ideas for positioning in the current environment and also putting ‘energy transition’ back on track.

To read more about the options to alleviate energy shortages, please see our article here.

Copyright: Thunder Said Energy, 2019-2024.