-
Development capex: long-term spending from Oil Majors?

This data-file tabulates the five ‘Big Oil’ Super-Majors’ development capex from the mid-1990s, in headline terms (billions of dollars) and in per-barrel terms ($/boe of production). Real development capex quadrupled from $6/boe in 1995-2000 to $24/boe in 2010-15, collapsed to $10/boe, then recovered to $13.5/boe.
-
Global oil demand: breakdown by product by country?
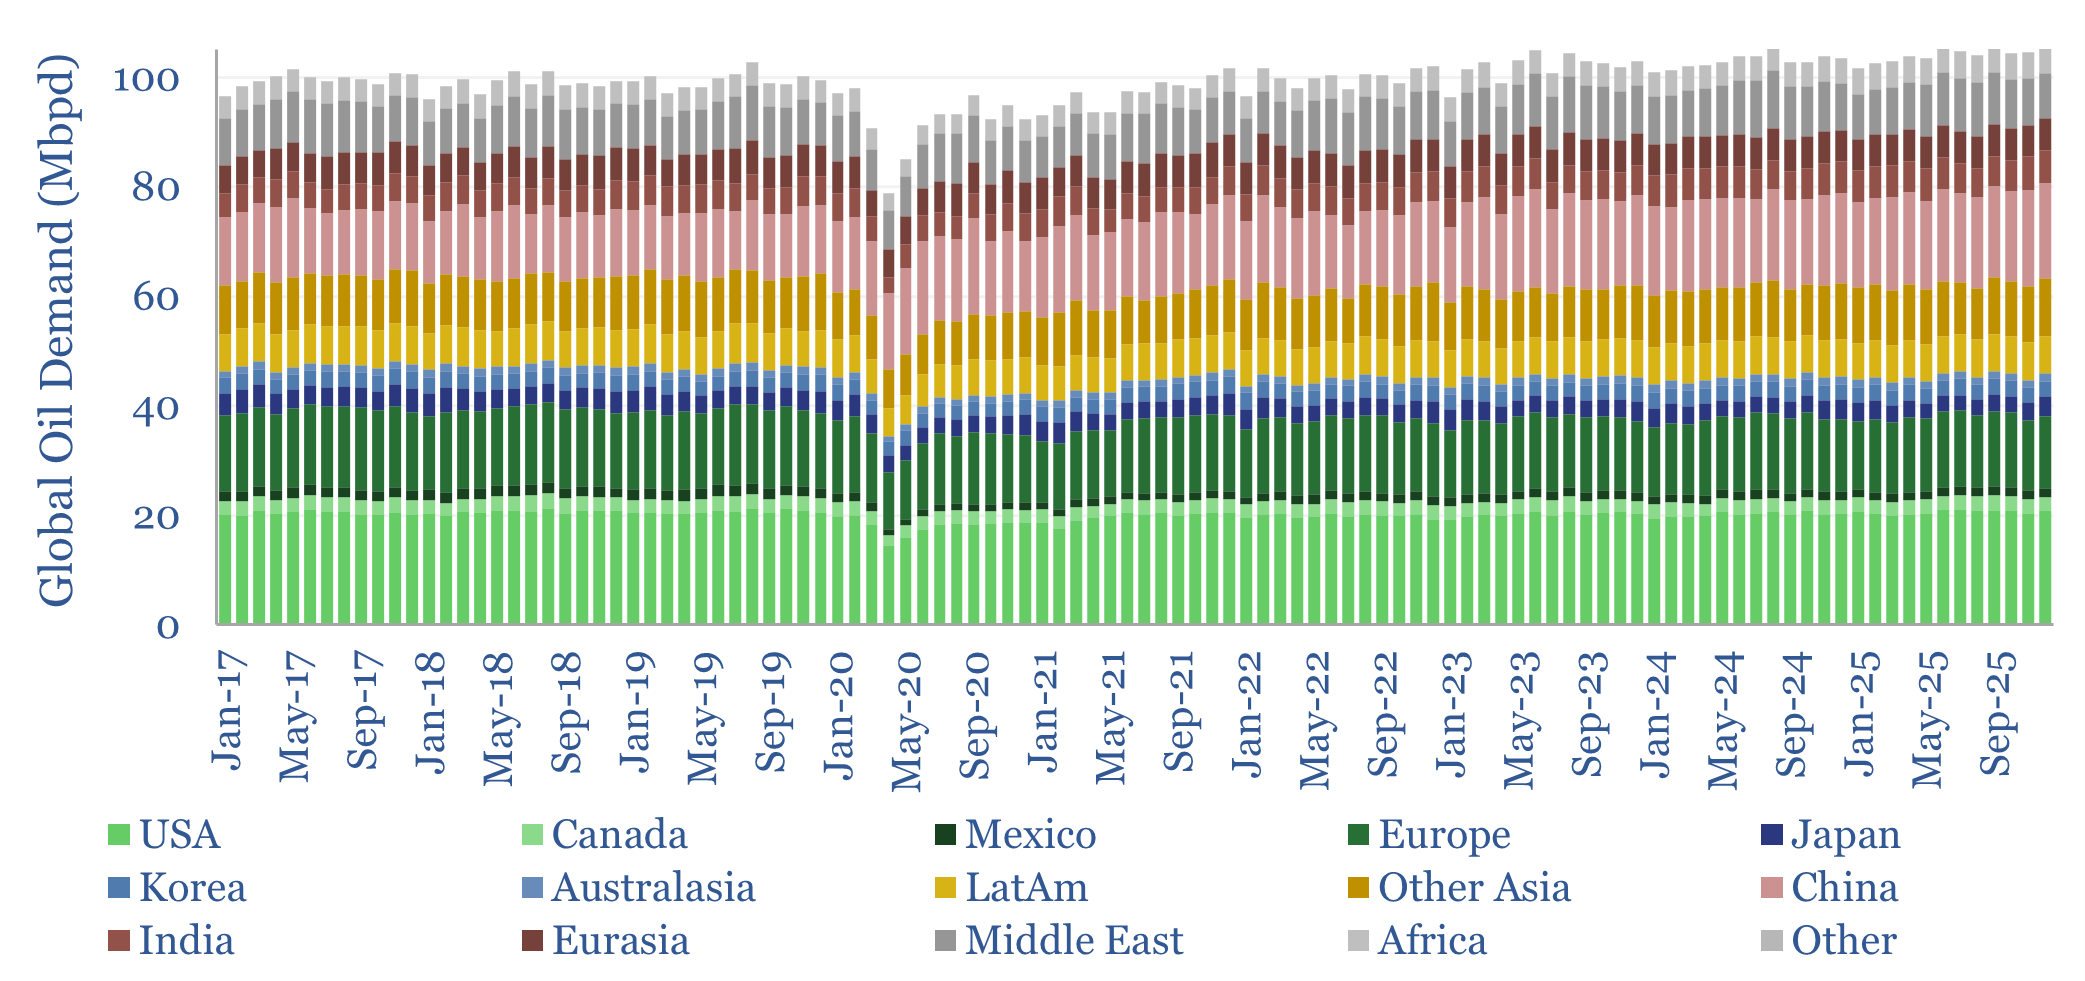
This data-file breaks down global oil demand, country-by-country, product-by-product, month-by-month, across 2017-2025. Global oil demand ran at 104 Mbpd in 2025, for +1.0 Mbpd of growth. For perspective, global oil demand rose at +1.2Mbpd per year in the 30-years from 1989->2019, so there is not much evidence, on face value, that “peak oil is nigh”.
-
Global commodity demand: sensitivity to GDP?
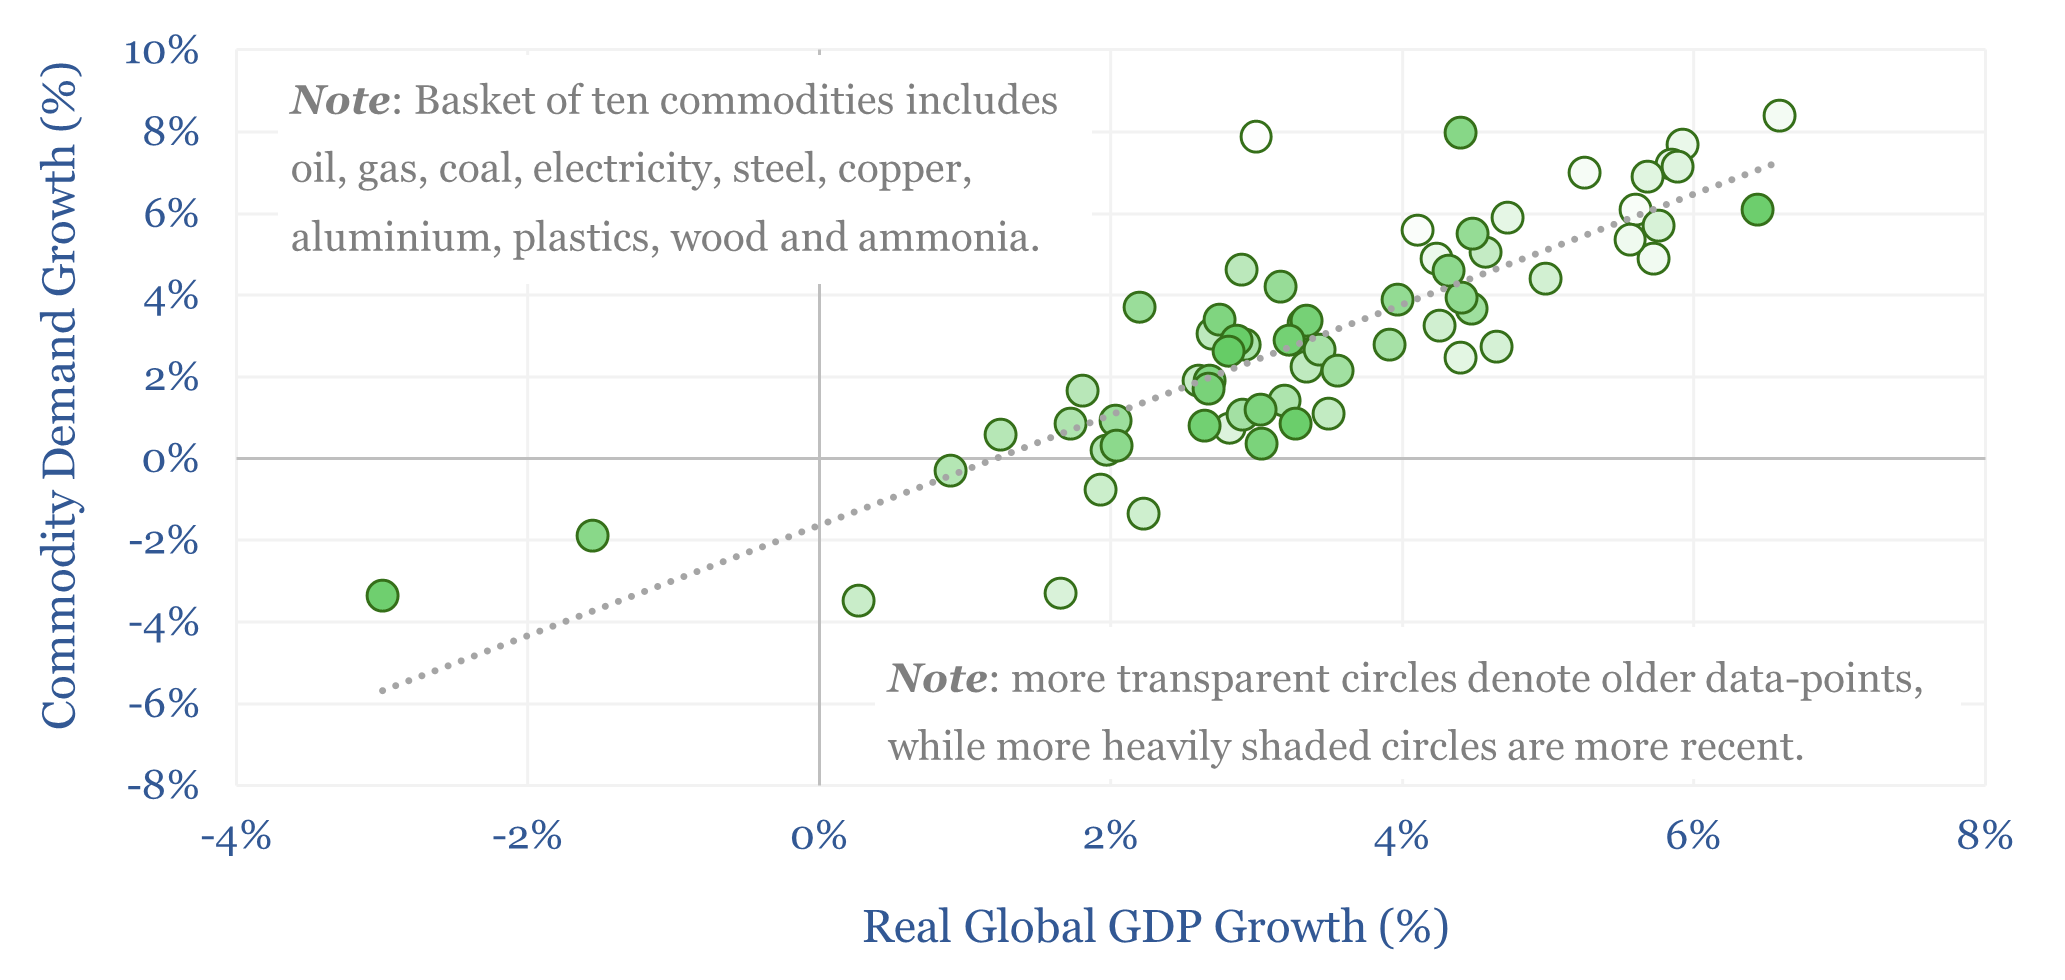
Global commodity demand is levered to GDP. Specifically, for each +/- 1% acceleration or deceleration in global GDP, commodity demand tends to accelerate or decelerate by +/- 1.4%, with a 70% R-squared, across 25 examples that are indexed in this data-file. Oil demand sensitivity to GDP is particularly interesting.
-
Wind turbine manufacturers: market share over time?
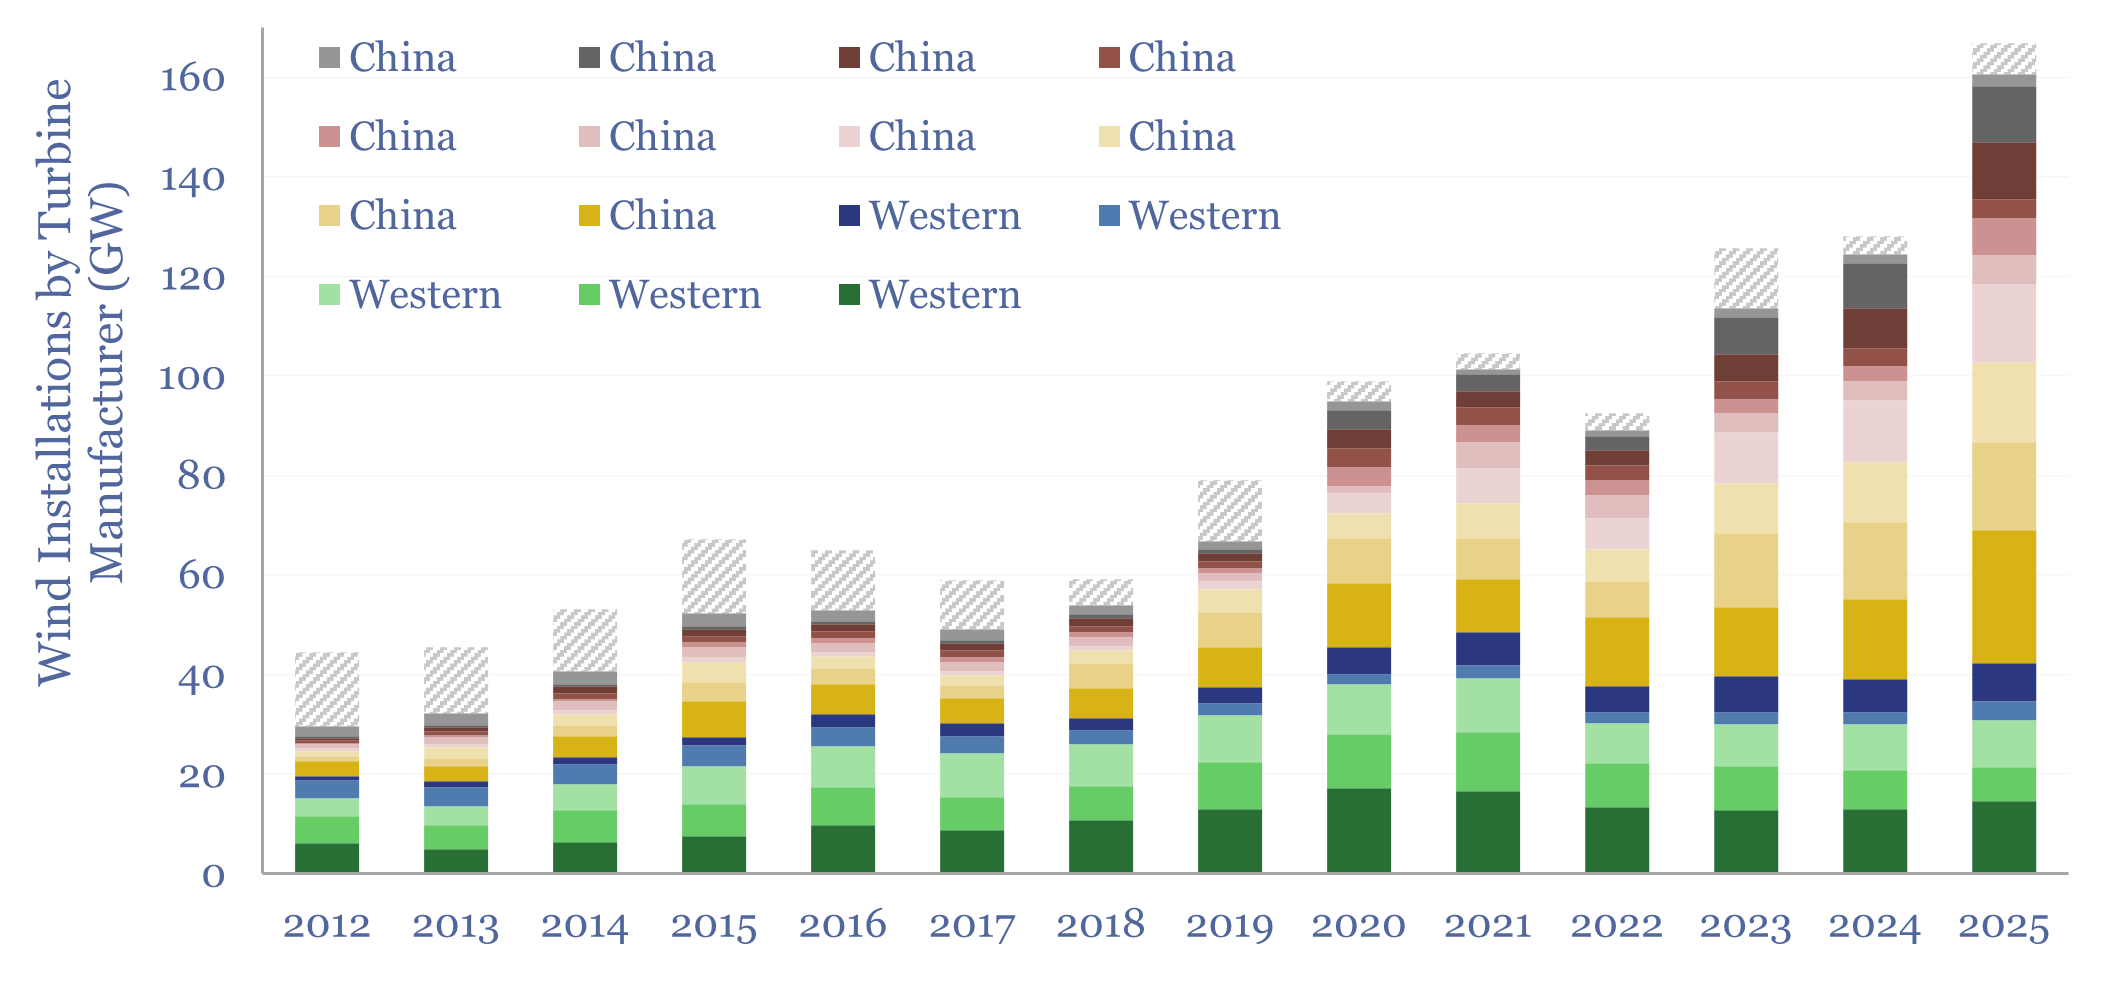
This data-file tracks wind turbine manufacturers, their market shares and their margins over time. By 2025, fifteen companies account for 95% of global wind turbine installations. This includes large Western incumbents, and a growing share for Chinese entrants, which now comprise 70% of the total market, with phenomenal growth in 2025 and continued low selling…
-
Marcellus shale: well by well production database?

This data-file tracks Marcellus shale well productivity, by tabulating the monthly output from 13,000 wells across the Pennsylvania Marcellus, from 2015 to mid-2024. Average IP rates across the basin have risen at a 12% pa CAGR, from around 5 mmcfd in 2015 to 18 mmcfd in 2025. However, activity and productivity differ starkly by operator.
-
Wind and solar capacity additions?
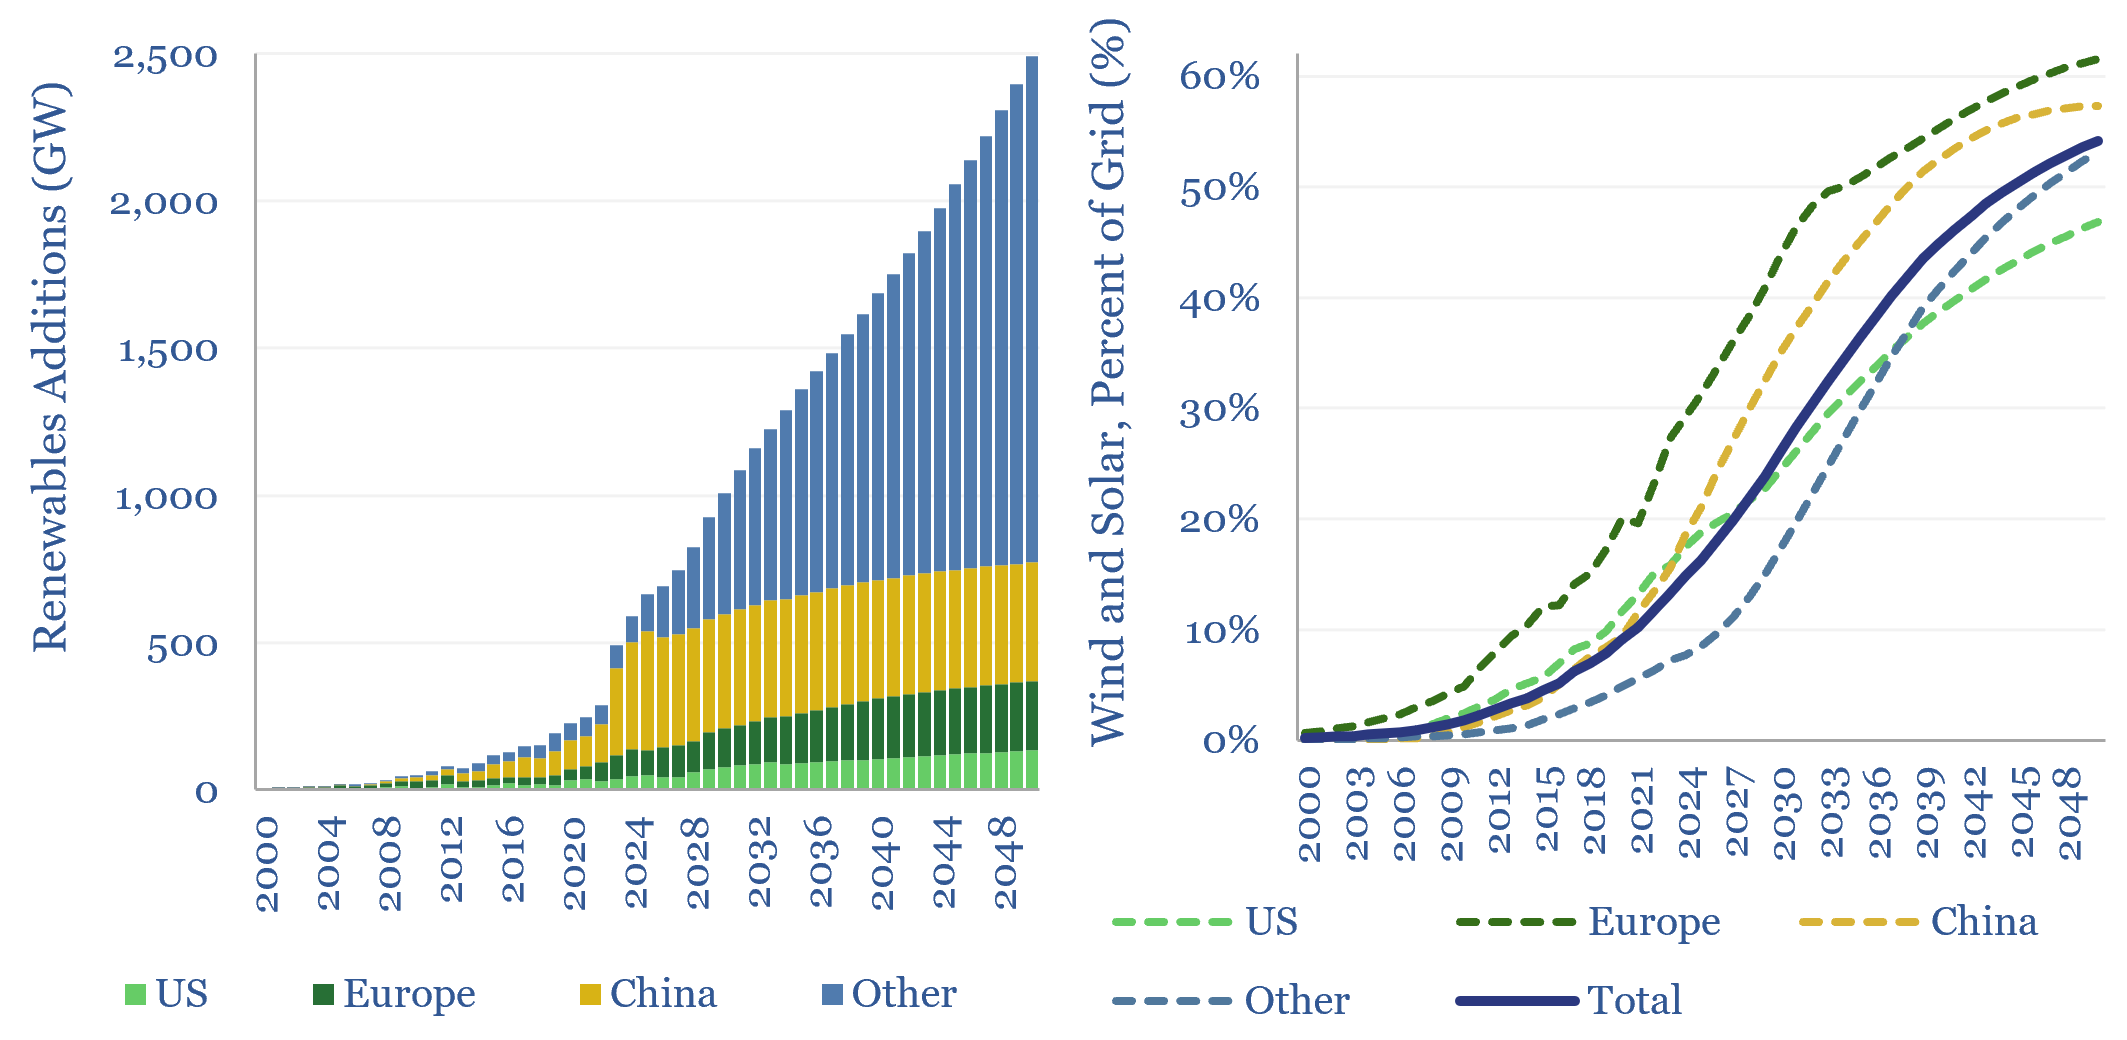
Global wind and solar capacity additions reached 630GW pa (AC-basis) in 2025, which is 3x 2020 levels and 10x 2011 levels. The pace of gross wind and solar capacity additions can rise by a further 3x by 2050, bringing wind and solar to 55% of a greatly expanded global power grid by 2050. Most of…
-
Flexible data centers: can AI load shift?
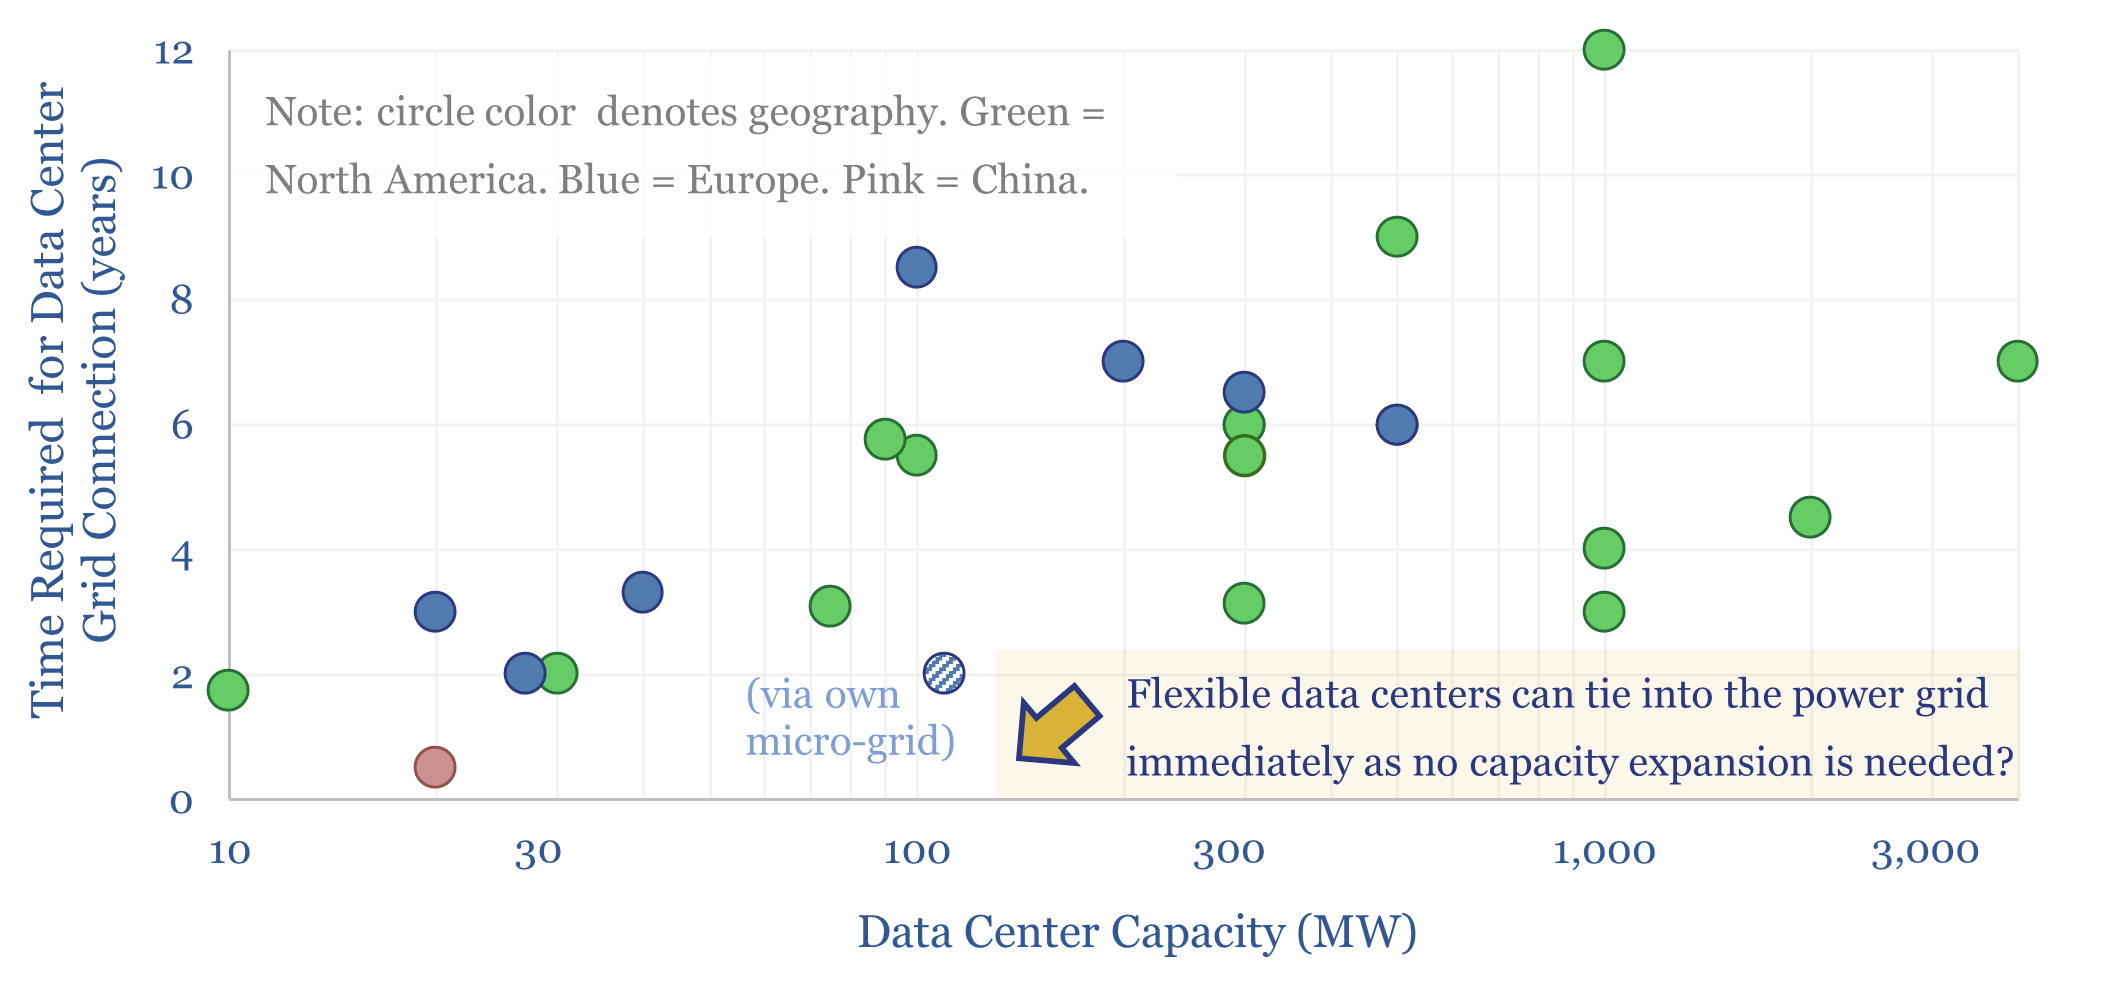
It can take 4-12 years to expand the grid and accommodate large new AI data centers. But what if more flexible data centers could be energized mostly via the pre-existing grid? This 15-page report shows how flexible AI data centers, which engage in demand shifting, are technically feasible, economically justified, and accelerating?
-
LNG bunkering vessel economics?
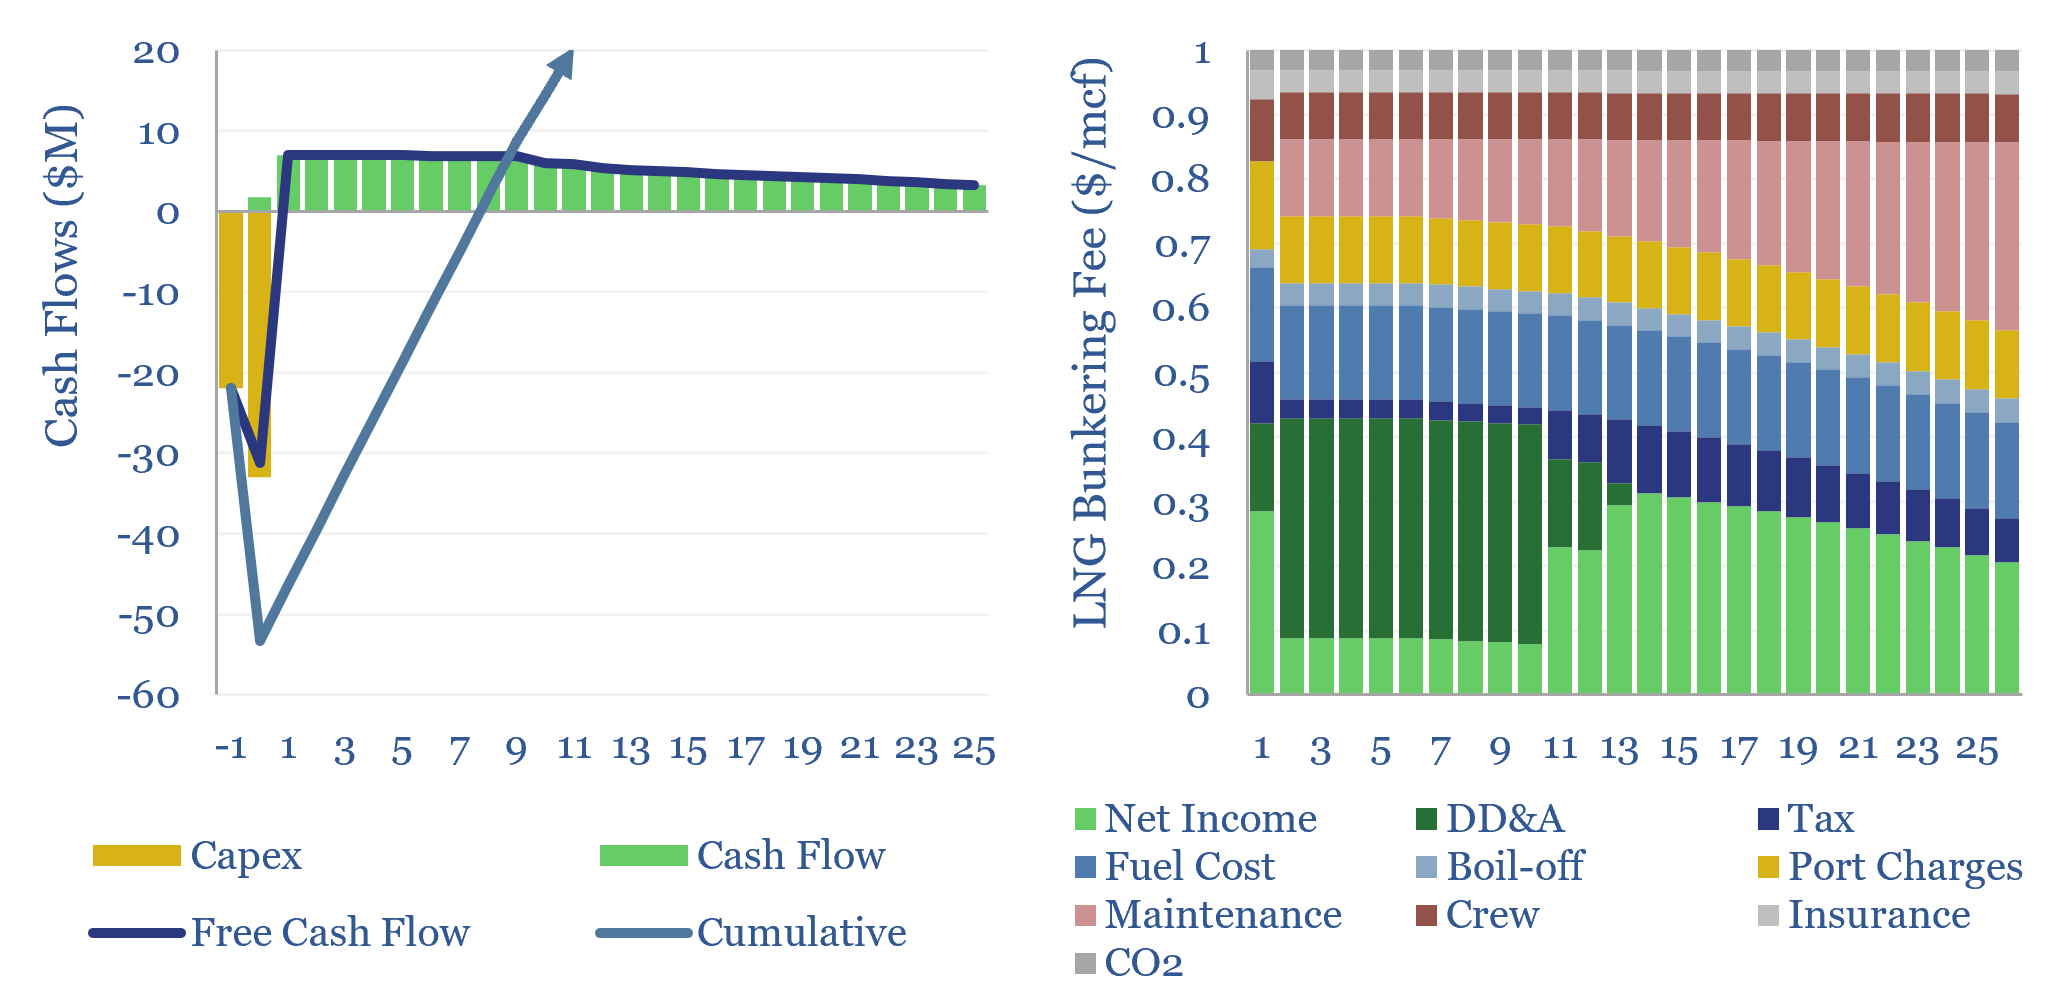
This data-file captures the economics of LNG bunkering vessels. LNG bunkering costs $1/mcf in well-utilized contexts, enabling LNG ship fueling at $8-10/mcf, which is 35% below $2/gal oil products at $70/bbl oil. A 1.5-year payback on dual-fuel vessels could thus see another 10MTpa of LNG used in shipping by 2030, displacing 250kbpd of oil?
-
Oil tankers: the economics?
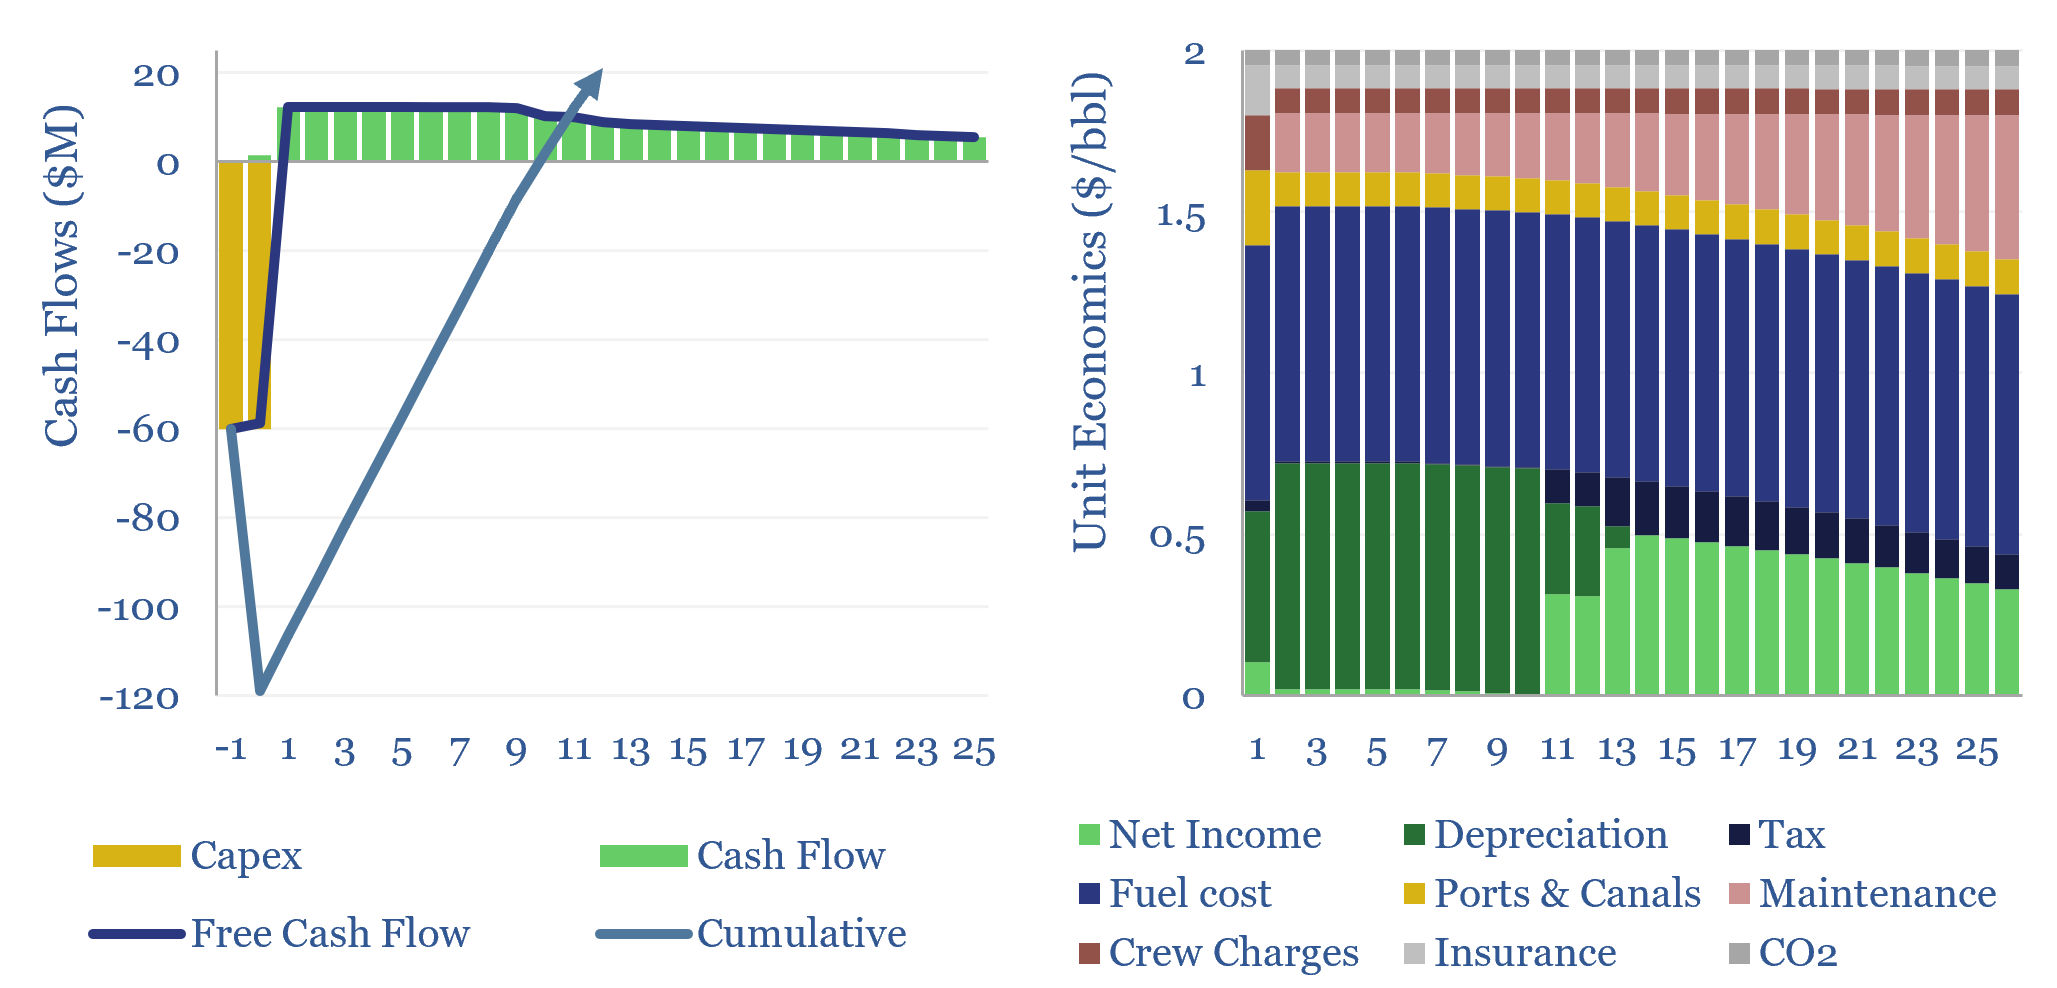
Oil tanker economics are captured in this model. A VLCC that carries 2.2Mbbls requiring a day rate of $100k/day to earn a 7-10% IRR, which equates to $2/bbl on cargoes moving from the Persian Gulf to China. Capex costs, fuel uses, engine sizes and other costs correlate with vessel size. The costs of oil tankers…
-
Qatari LNG: the worst supply disruption in LNG history?
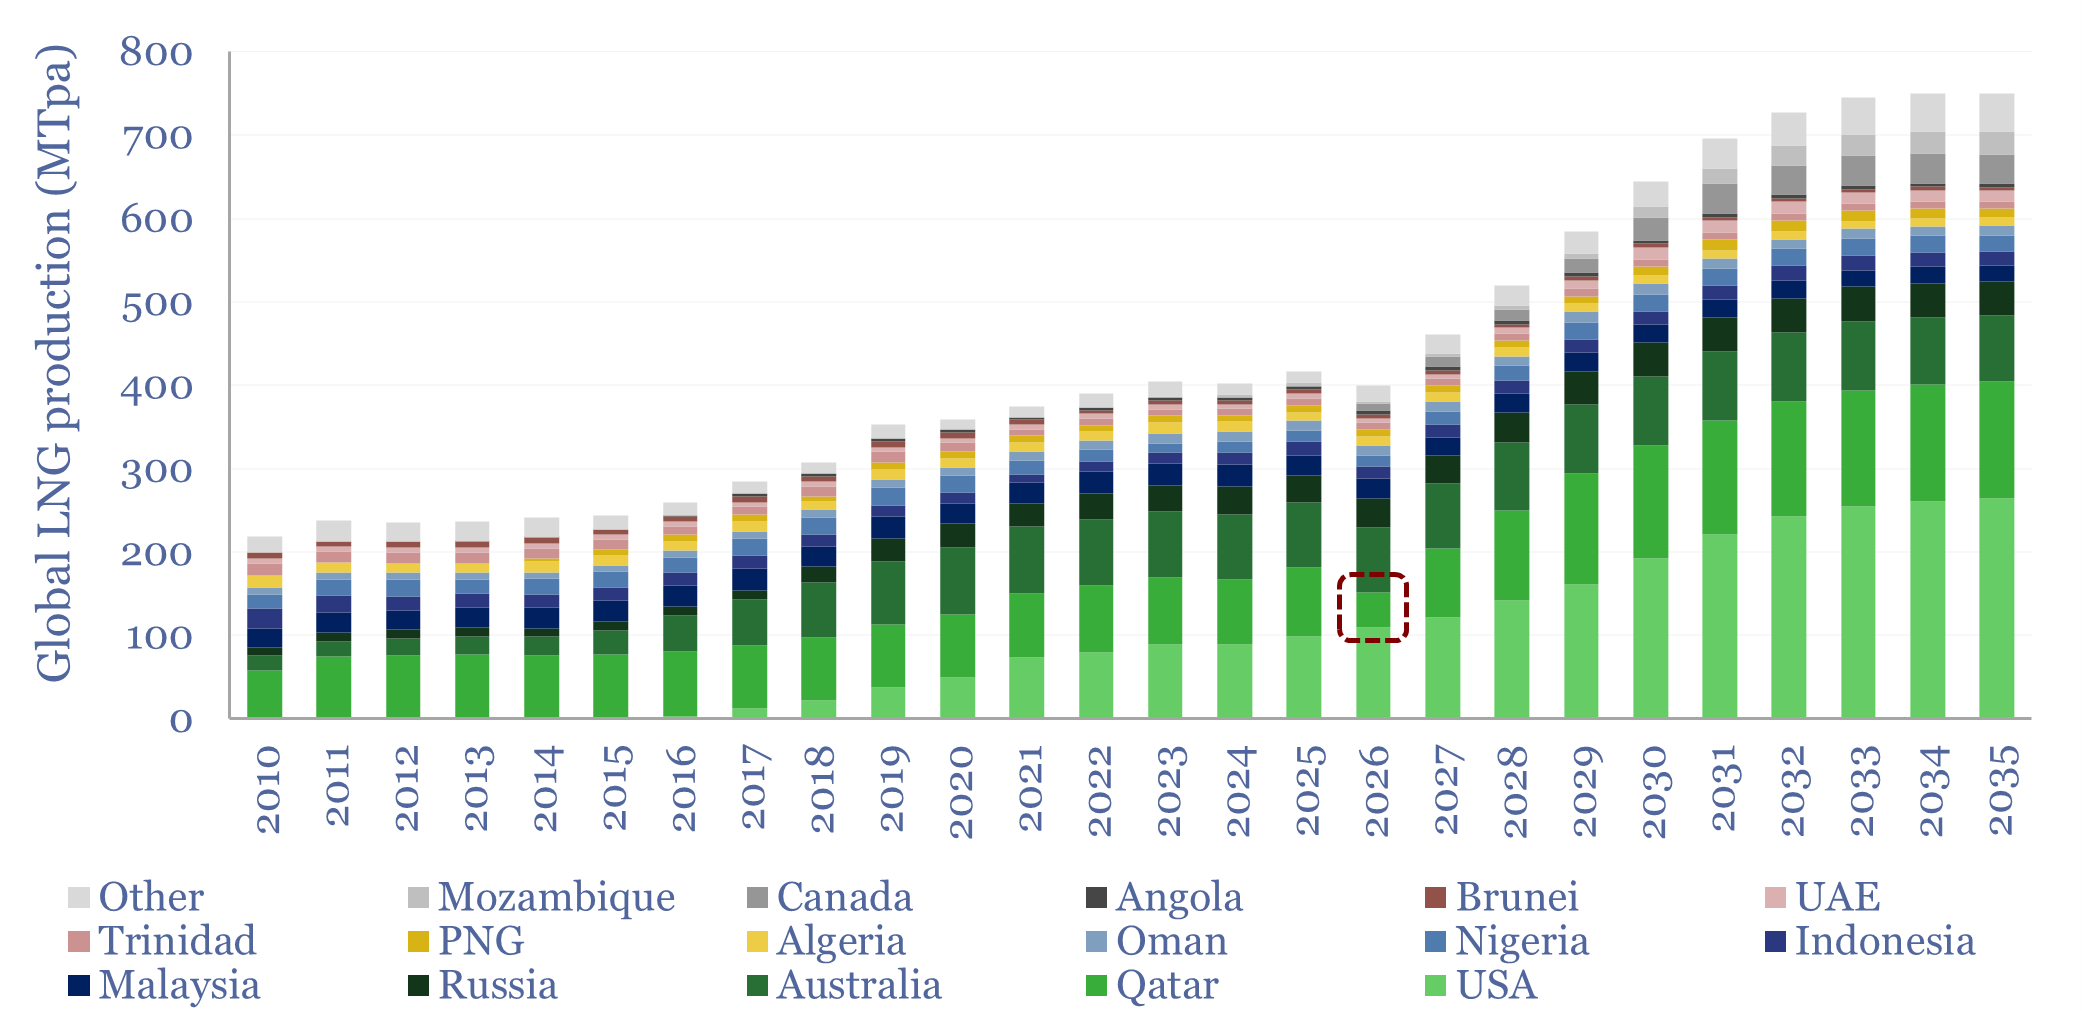
What if Qatar’s LNG output falls by -50% YoY in 2026, i.e., by -40MTpa, which is equivalent to a -0.4% reduction in useful global energy supplies? This 11-page report revisits all of our regional energy models, predicts how each Qatari LNG customer will fill the shortfall, and the implications for global energy markets.
Content by Category
- Batteries (96)
- Biofuels (44)
- Carbon Intensity (48)
- CCS (64)
- CO2 Removals (9)
- Coal (41)
- Commentary (65)
- Company Diligence (105)
- Data Models (924)
- Decarbonization (162)
- Demand (131)
- Digital (87)
- Downstream (47)
- Economic Model (221)
- Energy Efficiency (76)
- Hydrogen (63)
- Industry Data (308)
- LNG (56)
- Materials (86)
- Metals (88)
- Midstream (45)
- Natural Gas (161)
- Nature (76)
- Nuclear (28)
- Oil (176)
- Patents (39)
- Plastics (44)
- Power Grids (156)
- Renewables (153)
- Screen (138)
- Semiconductors (35)
- Shale (58)
- Solar (72)
- Supply-Demand (53)
- Vehicles (94)
- Video (24)
- Wind (47)
- Written Research (407)