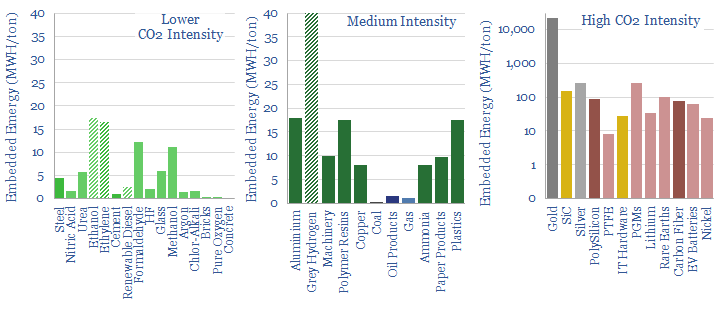
This data-file tabulates the energy intensity and CO2 intensity of materials, in tons/ton of CO2, kWh/ton of electricity and kWh/ton of total energy use. The build-ups are based on 160 economic models that we have constructed, and the data-file is intended as a helpful summary reference. Our key conclusions on the CO2 intensity of materials are below.
Human civilization produces over 60 bn tons per year of ‘stuff’ across 40 different material categories, accounting for 40% of all global energy use and 35% of all global emissions.
Rules of thumb. Producing the average material in our data-file consumes 5,000 kWh/ton of primary energy and emits 2 tons/ton of CO2.
Energy breakdowns. As another rule of thumb, 30% of the energy inputs needed to make a typical material are electricity, 25% are heat and 45% are other input materials.
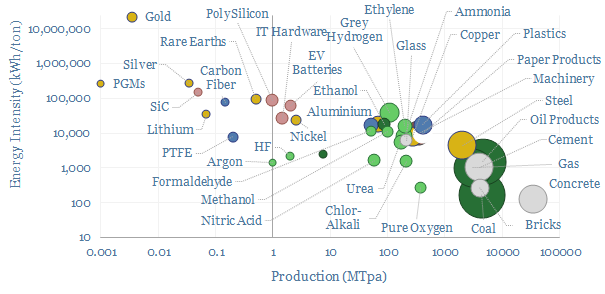
Ranges. All of these numbers can vary enormously (chart below). Energy intensity of producing materials ranges from 300 kWh/ton (bottom decile) to 150,000 kWh/ton (upper decile).

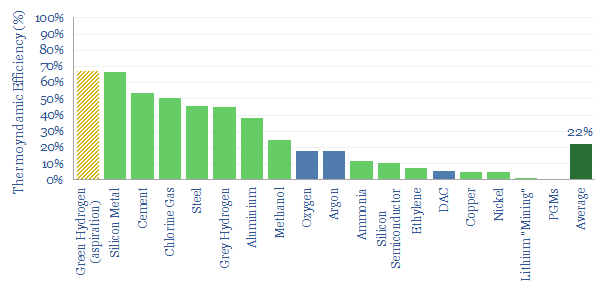
The average thermodynamic efficiency of producing these industrial materials is quantified at c20%, with an interquartile range from 5% to 50%. This is shown in the chart below and discussed in more detail here.

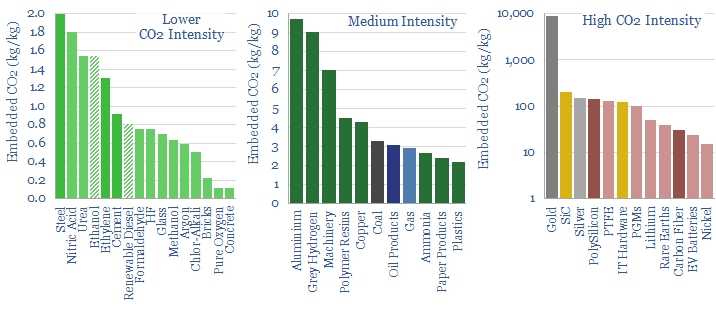
CO2 intensity of producing different materials also ranges from 0.5 tons/ton (bottom decile) to 140 tons/ton (upper decile).
Strictly, many of the largest contributors to global CO2 emissions, such as steel and cement, are not ‘carbon intensive’ (i.e., emissions are <2 tons/ton), they are simply produced in very large volumes.

Ironically, while we want to achieve an energy transition, it does require ramping up production of materials value chains that truly are CO2 intensive (i.e., emissions are above 20 tons/ton or even 100 tons/ton). This includes PV silicon and silver for solar panels; carbon fiber and rare earths for wind turbines; and lithium and SiC MOSFETs for electric vehicles. Ultimately these value chains also need to decarbonize in some non-inflationary way, which is a focus in our research.
Scope 4 CO2. Another complexity is that everything has a counterfactual. SiC MOFSETs might be energy intensive to produce but they earn their keep in long-term efficiency savings. Hence we recommend that the best way to evaluate total CO2 intensity is on a Scope 1-4 basis (note here).
Simplifications. Please note that in order to make this file remotely useful, we are guilty of simplifying and averaging quite complex and broad-ranging industries. More detail is available on different oil value chains (including oil sands and Permian shale in detail), gas value chains, coal grades, industrial boilers and burners by industry, construction materials and different plastics.
CO2 screening. In some industries, we have been able to aggregate CO2 curves, plotting the different CO2 intensities or energy intensities of different companies. The best example is looking at acreage position by position in the US oil and gas industry, refiners, gas pipelines, gas gathering, gas distribution, ethanol plants.
Other data-files on our website have aimed to tabulate the CO2 intensity of other value chains, but due to quirks of those value chains, we cannot plot the data in kWh/ton or CO2/ton. This includes the CO2 of different forms of transportation, digital processes, or hydrogen.
Agricultural commodities are also not captured in the data-file. We have estimated separately the CO2 intensity of different wood fuels, crop production, how it varies with fertilizer application, palm oil. All of our biofuels research is here.
