Search results for: “copper”
-
Uranium production: by company and by country?
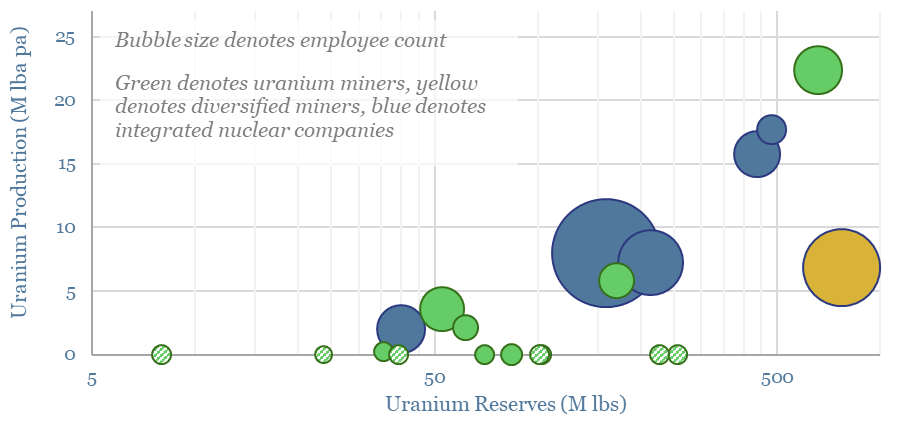
Global uranium production is broken down by company and by country in this data-file, which also screens 20 of the most noteworthy companies in uranium mining, the reserves, production and operational details. This matters as another contracting cycle is underway in the uranium industry, due to rising power demand, next-gen nuclear, but also supply disruptions…
-
Energy transition market sizing: hydrocarbon, new energies, capital goods and materials?
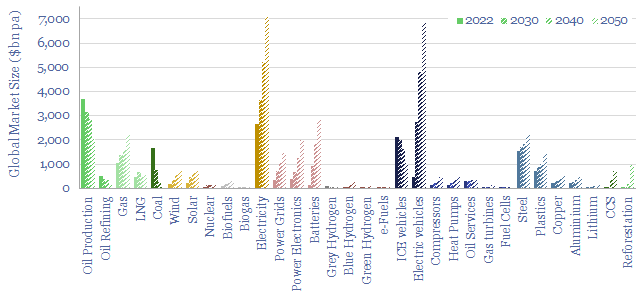
This data-file contains energy transition market sizing analysis, for hydrocarbons, new energies, capital goods and materials in $bn pa, integrating over 1,000 items of energy transition research and our latest roadmap to net zero. In aggregate, energy, materials and transition-related markets double from $25 trn pa to $50 trn pa.
-
Global commodity demand: sensitivity to GDP?
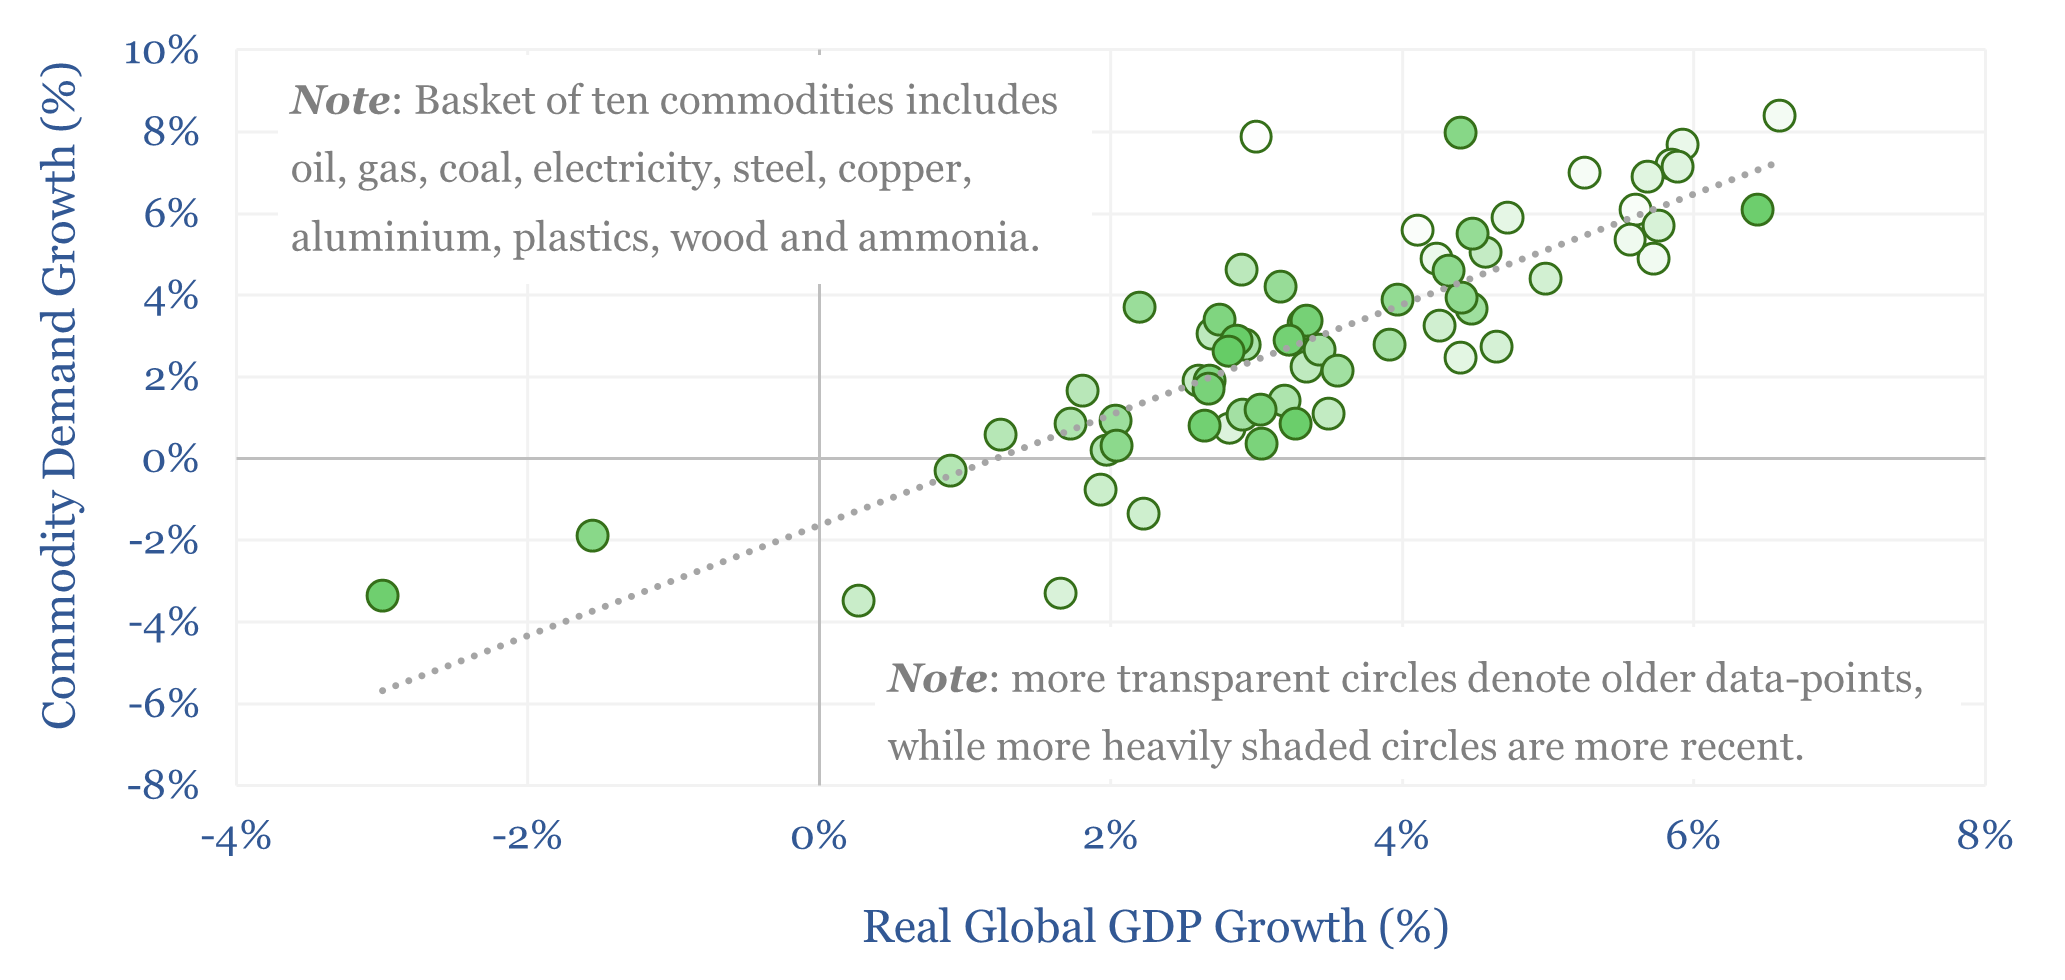
Global commodity demand is levered to GDP. Specifically, for each +/- 1% acceleration or deceleration in global GDP, commodity demand tends to accelerate or decelerate by +/- 1.4%, with a 70% R-squared, across 25 examples that are indexed in this data-file. Oil demand sensitivity to GDP is particularly interesting.
-
HVDC power transmission: the economics?
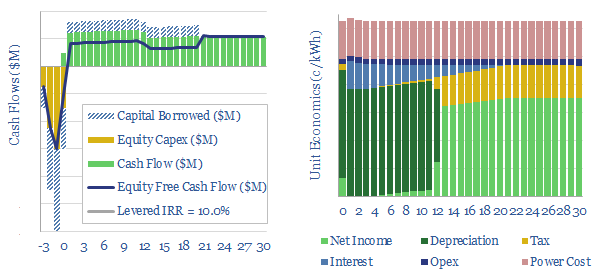
This model captures the economics of transporting electricity (e.g., wind and solar), over vast distances, using high voltage direct current power cables (HVDCs). Our base case shows a 3-10c/kWh transportation spread is required to earn a 10% levered IRR on 1,000-mile cable.
-
Froth flotation: the economics?
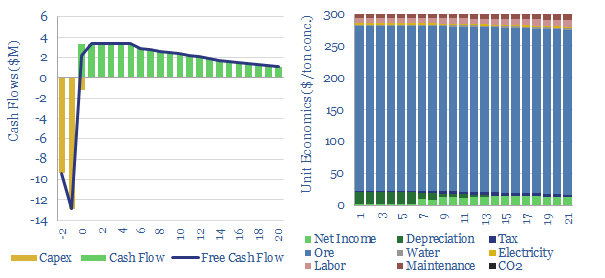
The costs of froth flotation are aggregated in this data-file, building up the typical capex costs (in $/Tpa), energy costs (in kWh/ton) and other opex lines (in $/ton) of one of the most important processes for the modern metals and materials industry. A good rule of thumb is $10/ton costs to concentrate a material by…
-
Power grids: transmission and distribution kilometers by country?
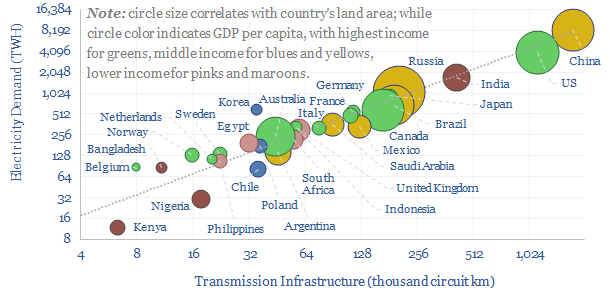
This data-file aggregates power transmission and distribution kilometers by country, across 30 key countries, which comprise 80% of global electricity use. In 2023, the world contains 7M circuit kilometers of power transmission lines and 110M kilometers of power distribution lines. Useful rules of thumb are in the data-file.
-
Solar contacts: silver bullet?
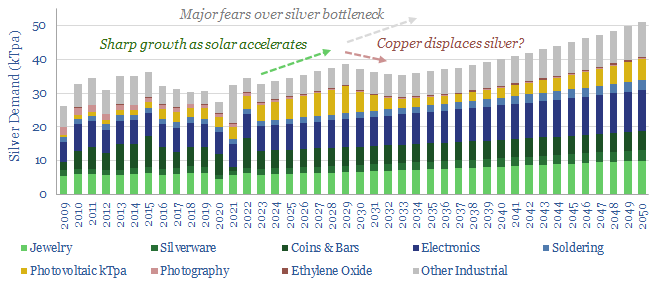
The front contacts in today’s solar cells are made of screen-printed silver, absorbing 11% of 2021’s silver market. Silver can be substituted with copper, but manufacturing is c5x more costly. So we expect a silver spike, then a switch. This 16-page note explains our outlook, and who benefits?
-
Overview of mining equipment companies?
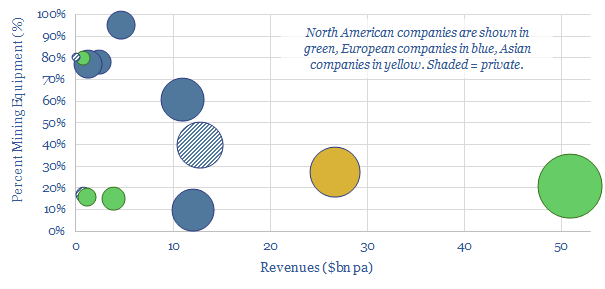
This data-file is an overview of mining equipment companies. For each company, we have noted its location, size, age, number of employees, number of patents, latest revenues, operating margins, exposure to the mining equipment industry, and a few short summary sentences. Where possible, we have also broken down the company’s revenues by end-market or by…
-
How do commodities perform during recessions?
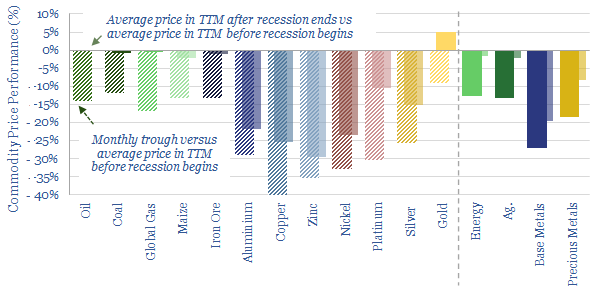
How do commodities perform in recessions? Industrial metals are usually hit hardest, falling 35% peak-to-trough. Energy price spikes partly cause two-thirds of recessions, then typically trade back to pre-recession levels. Precious metals, mainly gold, tend to appreciate in financial crises. Data are compiled in this file, across recessions back to 1970.
-
Solar: energy payback and embedded energy?
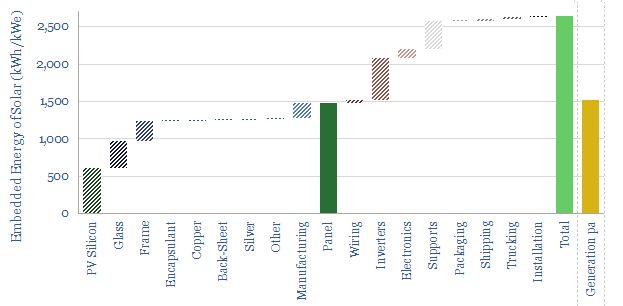
What is the energy payback and embedded energy of solar? We have aggregated the consumption of 10 different materials (in kg/kW) and around 10 other energy-consuming line-items (in kWh/kW). Our base case estimate is 2.5 MWH/kWe of solar and an energy payback of 1.5-years. Numbers and sensitivities can be stress-tested in the data-file.
Content by Category
- Batteries (89)
- Biofuels (44)
- Carbon Intensity (49)
- CCS (63)
- CO2 Removals (9)
- Coal (38)
- Company Diligence (94)
- Data Models (838)
- Decarbonization (160)
- Demand (110)
- Digital (59)
- Downstream (44)
- Economic Model (204)
- Energy Efficiency (75)
- Hydrogen (63)
- Industry Data (279)
- LNG (48)
- Materials (82)
- Metals (80)
- Midstream (43)
- Natural Gas (148)
- Nature (76)
- Nuclear (23)
- Oil (164)
- Patents (38)
- Plastics (44)
- Power Grids (130)
- Renewables (149)
- Screen (117)
- Semiconductors (32)
- Shale (51)
- Solar (68)
- Supply-Demand (45)
- Vehicles (90)
- Wind (44)
- Written Research (354)