Search results for: “copper”
-
Solar: energy payback and embedded energy?
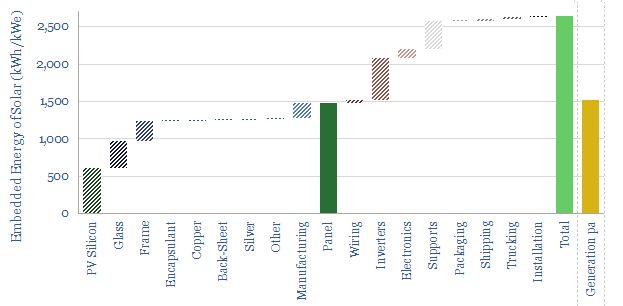
What is the energy payback and embedded energy of solar? We have aggregated the consumption of 10 different materials (in kg/kW) and around 10 other energy-consuming line-items (in kWh/kW). Our base case estimate is 2.5 MWH/kWe of solar and an energy payback of 1.5-years. Numbers and sensitivities can be stress-tested in the data-file.
-
Silver demand: upside and substitution?
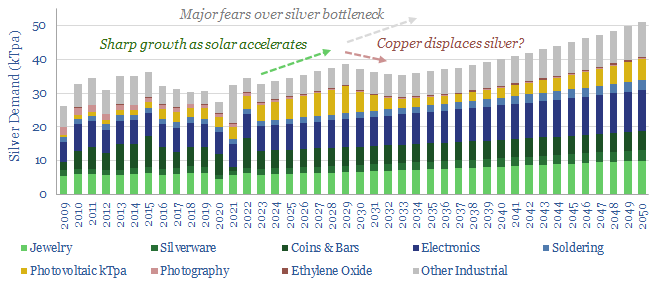
This data-file is a simple demand outlook for silver in the energy transition. Demand could rise 2.5x from 30kTpa to 85kTpa in 2050, driven by solar and electrification. Although in practice, we think a price spike will displace silver with copper.
-
Silver producers: leading companies?
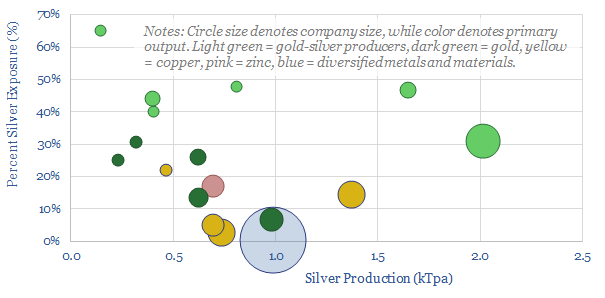
Half of the world’s 28kTpa global silver market is controlled by 17 public companies, with silver output ranging from 0.1 – 2.0 kTpa, and co-producing gold, copper or other metals. This data-file is a screen of silver producers, in order to identify leading companies.
-
Energy storage: top conclusions into batteries?
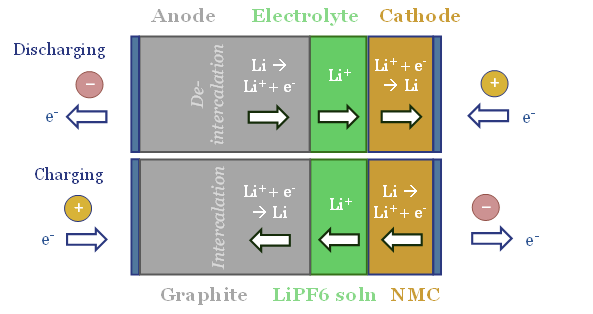
Thunder Said Energy is a research firm focused on economic opportunities that can drive the energy transition. Our top ten conclusions into batteries and energy storage are summarized below, looking across all of our research.
-
Energy development times: first consideration to full production?
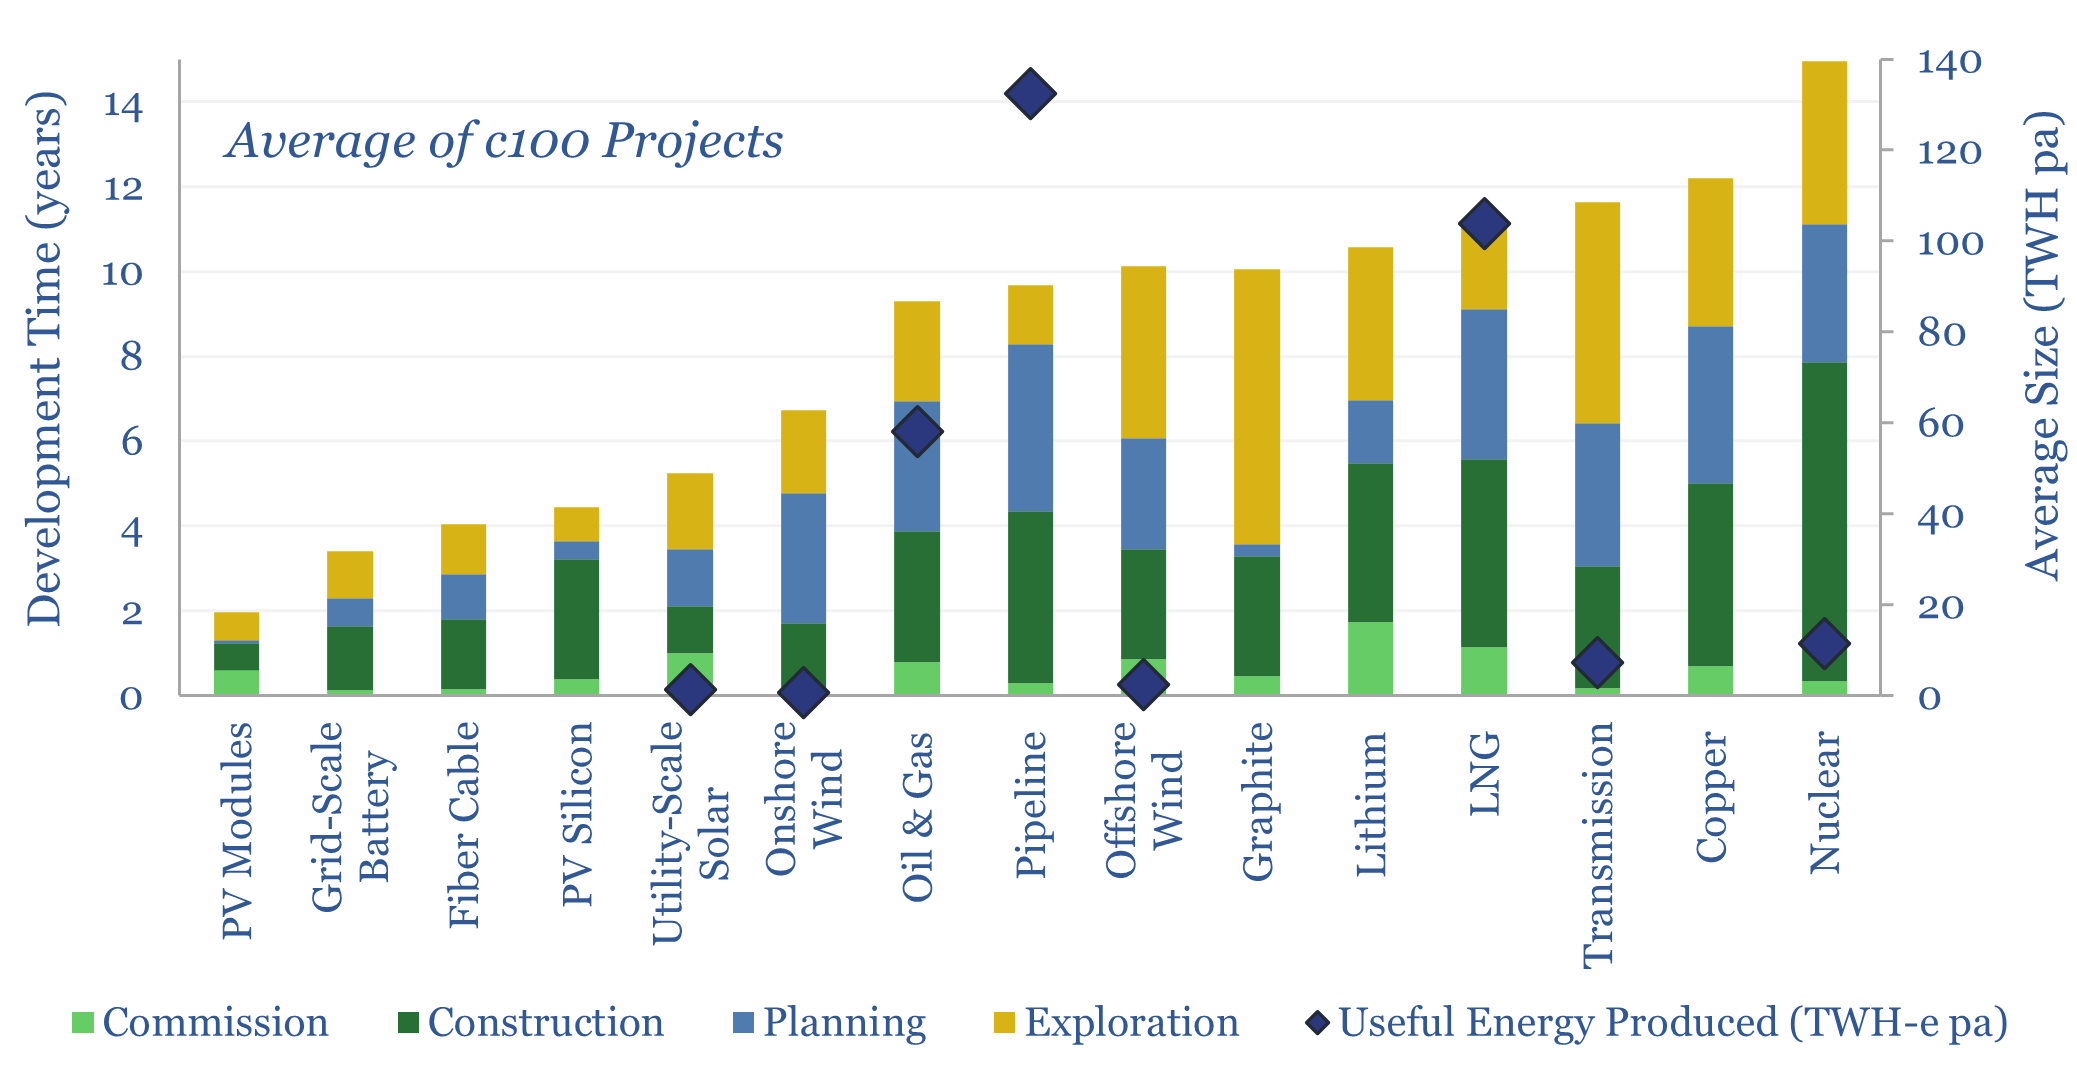
Full cycle development times tend to average c4-years for large solar projects, 6-years for large offshore wind, 7-years for new pipelines, 7-years for new oil and gas projects, 9-years for new LNG plants and 13-years for new nuclear plants. This data-file reviews 35 case studies.
-
Energy intensity of fiber optic cables?
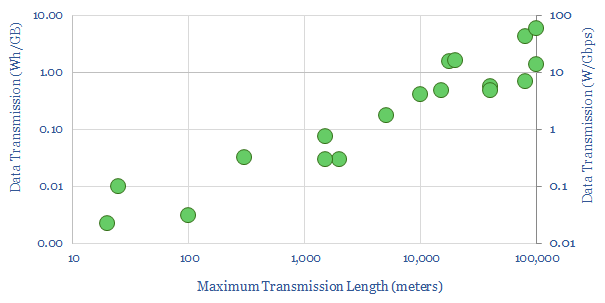
What is the energy intensity of fiber optic cables? Our best estimate is that moving each GB of internet traffic through the fixed network requires 40Wh/GB of energy, across 20 hops, spanning 800km and requiring an average of 0.05 Wh/GB/km. Generally, long-distance transmission is 1-2 orders of magnitude more energy efficient than short-distance.
-
Metals and materials: strength and temperature resistance?
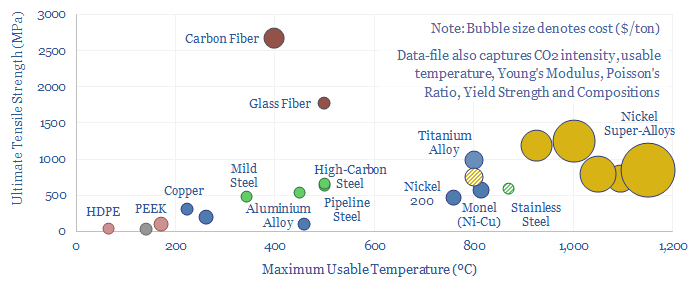
This data-file aggregates information into the strength, temperature resistance, rigidity, costs and CO2 intensities of important metals and materials. These are used in gas turbines, wind turbines, pipelines, CCS, power transmission.
-
Aluminium producers: company screen?
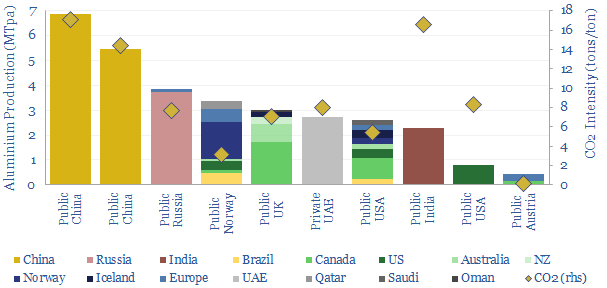
Leading aluminium producers are reviewed in this data-file, across ten companies, producing half of the world’s global output. Scale ranges 1MTpa to 7MTpa. CO2 intensity of primary aluminium production ranges from 3 tons/ton to 17 tons/ton, in aggregate across these companies.
-
Power grids: down to the wire?
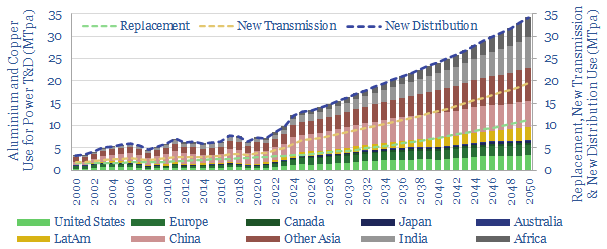
Power grid circuit kilometers need to rise 3-5x in the energy transition. This trend directly tightens global aluminium markets by over c20%, and global copper markets by c15%. Slow recent progress may lead to bottlenecks, then a boom? This 12-page note quantifies the rising demand for circuit kilometers, grid infrastructure, underlying metals and who benefits?
-
Global vehicle fleet: vehicle sales and electrification by region?
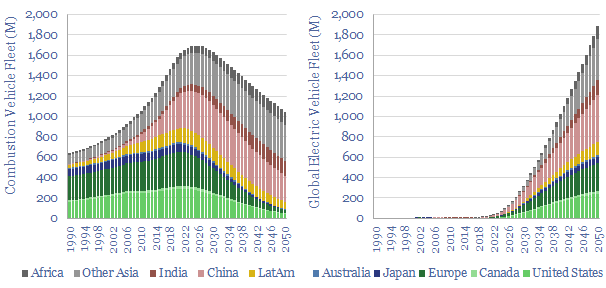
We have modeled the global light vehicle fleet, light vehicle sales by region, and the world’s shift from internal combustion engines (ICEs) towards electric vehicles (EVs) through 2050. Our base case model sees almost 200M EV sales by 2050, and a c40% decline to around 1bn combustion vehicles in the world’s fleet by 2050.
Content by Category
- Batteries (89)
- Biofuels (44)
- Carbon Intensity (49)
- CCS (63)
- CO2 Removals (9)
- Coal (38)
- Company Diligence (95)
- Data Models (840)
- Decarbonization (160)
- Demand (110)
- Digital (60)
- Downstream (44)
- Economic Model (205)
- Energy Efficiency (75)
- Hydrogen (63)
- Industry Data (279)
- LNG (48)
- Materials (82)
- Metals (80)
- Midstream (43)
- Natural Gas (149)
- Nature (76)
- Nuclear (23)
- Oil (164)
- Patents (38)
- Plastics (44)
- Power Grids (130)
- Renewables (149)
- Screen (117)
- Semiconductors (32)
- Shale (51)
- Solar (68)
- Supply-Demand (45)
- Vehicles (90)
- Wind (44)
- Written Research (354)