Dispersion in global gas prices has hit new highs in 2022. Hence this 17-page note evaluates two possible solutions. Building more LNG plants achieves 15-20% IRRs. But displacing industrial gas demand in Europe, then re-locating it in gas-rich countries can achieve 20-40% IRRs, lower net CO2 and lower risk? Both solutions should step up. What implications?
Global gas price dispersion is hitting new highs, with the best geographies remaining consistently below $2.5/mcf, but many others spiking to peak prices in 2022. Theories of gas price dispersion are laid out on pages 2-3, while we present data and conclusions on 20 different countries’ gas prices on pages 4-6.
Will it accelerate renewables? An interesting observation is that the countries with spiking gas prices are already deploying renewables ‘as fast as feasible’. Whereas it is often the countries with very low gas prices that have very low renewables deployment (page 7).
Will it accelerate LNG? In theory yes. Our expectations for future gas prices should unlock 15-20% IRRs at new LNG projects, and our growth forecasts are on page 8.
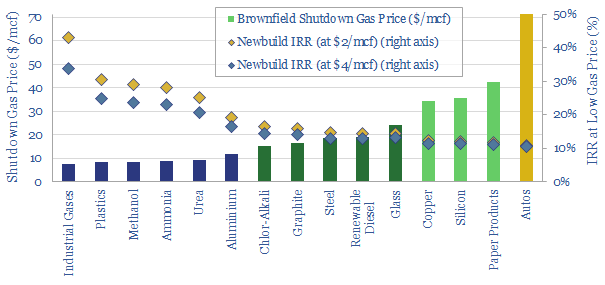
Will it accelerate industrial re-location, away from geographies with high-priced gas, and towards geographies with low-cost gas. This is the main focus of the note. And we think greenfield industrial facilities can earn 20-40% future IRRs if they are sited in geographies with low-priced gas. By contrast, we have constructed a ‘shutdown curve’ showing what gas prices are needed to free up 13bcfd of industrial gas demand in Europe. Our modelling framework is explained on pages 10-12.
There are further economic and ESG advantages to re-locating industry to gas-rich countries, compared with exporting their gas. They are quantified on pages 13-14.
Who benefits? We outline examples of leading companies in gas-rich countries on pages 15-16. This includes both emerging world producers, US E&Ps and US industrial companies that have featured in our research to-date.
Finally, for the renewables and LNG industries, we would highlight that this analysis is not an either-or. We will need all solutions to alleviate energy shortages. Yet displacing industrial gas demand in Europe may mute the kind of runaway cost-inflation that de-railed the LNG industry in the 2010s, and threatens the renewables industry in the 2020s (page 17).
Britain’s remarkable industrialization in the 18th and 19th centuries was part of the world’s first great energy transition. In this short note, we have aggregated data, estimated the end uses of different energy sources in the Industrial Revolution, and drawn five key conclusions for the current Energy Transition.
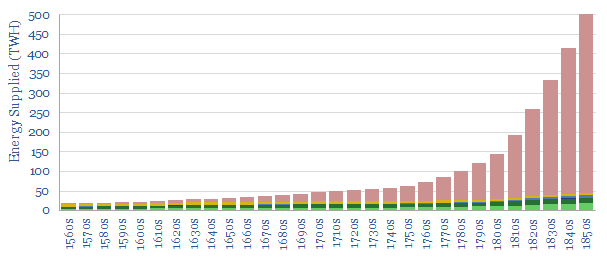
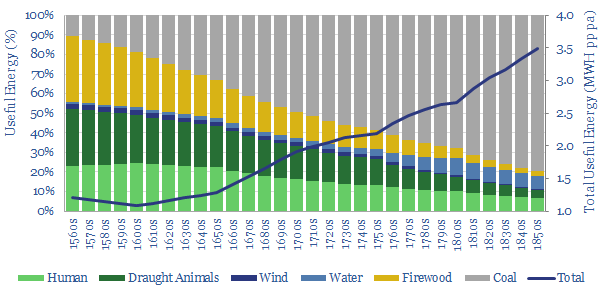
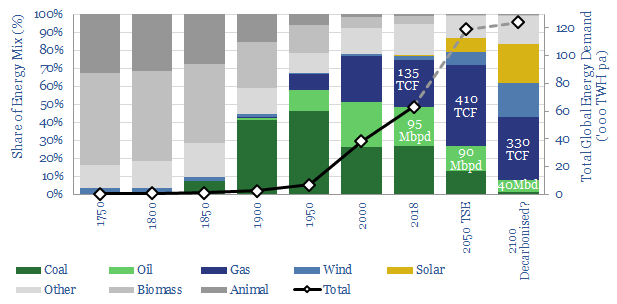
In this short note, we have sourced and interpolated long run data into energy supplies in England and Wales, by decade, from 1560-1860. The graph is a hockey stick, with Britain’s total energy supplies ramping up 30x from 18TWH to 515TWH per year. Part of this can be attributed to England’s population rising 6x, from around 3M people to 18M people over the same timeframe. The remainder of the chart is dominated by a vast increase in coal from the 1750s onwards.
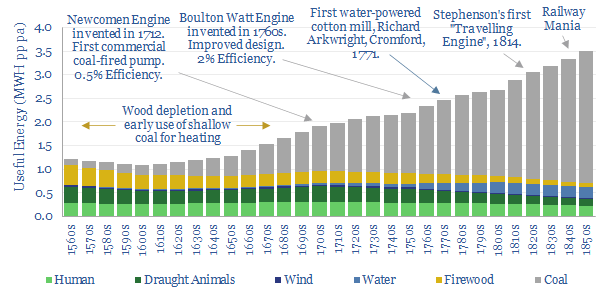
A more comparable way to present the data is shown below (and tabulated here). We have divided through by population to present the data on a per-capita basis. But we have also adjusted each decade’s data by estimated efficiency factors, to yield a measure of the total useful energy consumed per person. For example, coal supplies rose 40x from 1660 to 1860, but per-capita end use of coal energy only rose c6.5x, because the prime movers of the early industrial revolution were inefficient. This note presents our top five conclusions from evaluating the data.
Five Conclusions into Energy Demand from the Industrial Revolution
(1) Context. Useful energy demand per capita trebled from 1MWH pp pa in the 1600s to over 3MWH pp pa in the mid-19th century, an unprecedented increase.
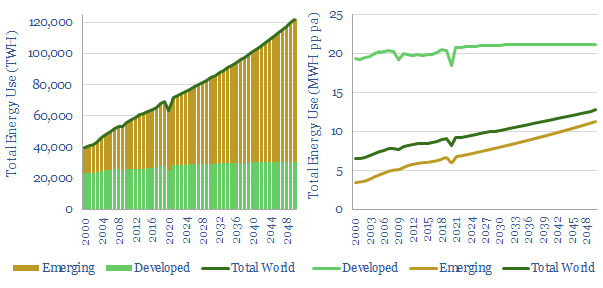
For comparison, today’s useful energy consumption per capita in the developed world is 6x higher again, as compared with the 1850s. A key challenge for energy transition in the developed world is that people want to keep consuming 20MWH pp pa of energy, rather than reverting to pre-industrial or early-industrial energy levels. As a rough indicator, 20MWH is the annual energy output of c$120-150k of solar panels spread across 600 m2 (model here).
Furthermore, today’s useful energy consumption in the emerging world is only c2x higher than Britain in the 1860s. I.e., large parts of the emerging world are in very early stages of industrialization, comparable to where Britain was 150-years ago. Models of global decarbonization must therefore allow energy access to continue rising in the emerging world (charts below), and woe-betide any attempt to stop this train.
(2) Shortages as a driver of transition? One of the great cliches among energy analysts is that we “didn’t emerge from the stone age because we ran out of stone”. In Britain’s case, in fact, the data suggest we did shift from wood to coal combustion as we began to run out of wood.
Wood use and total energy use both declined in the 16th Century, and coal first began ramping up as an alternative heating fuel (charts above). In 1560, Britain’s heating fuel was 70% wood and 30% coal. By 1660, it was 70% coal and 30% wood. This was long before the first coal-fired pumps, machines or locomotives.
This is another reminder that energy transitions tend to occur when incumbent energy sources are under-supplied and highly priced, per our research below. Peak supply tends to preceed peak demand, not the other way around.
(3) Energy transition and abolitionism? Amazingly, human labor was the joint-largest source of useful energy around 1600, at c25% of total final energy consumption. But reliance upon human muscle power as a prime mover was bound up in one of the greatest atrocities of human history: the coercion of millions of Africans, slaves and serfs; to row in galleys, transport bulk materials and work land.
By the time Britain banned the slave trade in 1807, human muscle power was supplying just 10% of usable energy. By the time of the Abolition Act in 1833, it was closer to 5%.
Some people today feel that unmitigated CO2 emissions is an equally great modern-day evil. On this model, it could be the vast ramp-up of renewable energy that eventually helps to phase out conventional energy. But our current models below do not suggest that renewables can reach sufficient size or scale for this feat until around 2100.
What is also different today is that policy-makers seem intent on banning incumbent energy sources before we have transitioned to alternatives. We have never found a good precedent for bans working in past energy systems. Although US Prohibition, from 1920-1933, makes an interesting case study.
(4) Jevons Paradox states that more efficient energy technologies cause demand to rise (not fall) as better ways of consuming energy simply lead to more consumption.
Hence no major energy source in history has ‘peaked’ in absolute terms. Even biomass and animal traction remain higher in absolute terms than before the industrial revolution, both globally and in our UK data from 1560-1860.
Jevons Paradox is epitomized by the continued emergence of new coal-consuming technologies in the chart below, which in turn stoked the ascent of coal-powered demand, while wood demand was not totally displaced.
The fascinating modern-day equivalent would suggest that the increasing supply of renewable electricity technologies will create new demand for electric vehicles, drones, flying cars, smart energy and digitization; rather than simply substituting out fossil fuels.
(5) Long timeframes. Any analysis of long-term energy markets inevitably concludes that transitions take decades, even centuries. This is visible in the 300-year evolution plotted above, and in the full data-set linked below. Attempts to speed up the transition create the paradox of very high costs or potential bubbles. We have also compiled a helpful guide into transition timings by mapping twenty prior technology transitions. Our recent research, summarized below, covers all of these topics, for further information.
Source: Wrigley, E. A. (2011). Energy and the English Industrial Revolution, Cambridge, TSE Estimates. With thanks to the Renewable Energy Foundation for sharing the data-set.
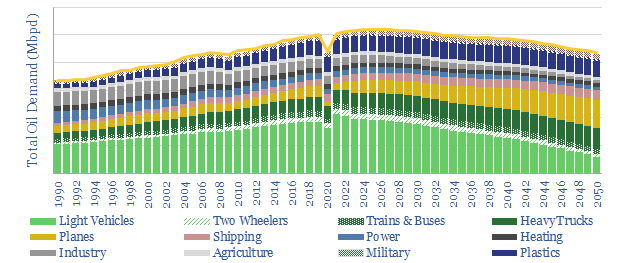
Another devastating impact of COVID-19 may still lie ahead: a 1-2Mbpd upwards jolt in global oil demand. This could trigger disastrous under-supply in the oil markets, stifle the economic recovery and distract from energy transition. This 17-page note upgrades our 2022-30 oil demand forecasts by 1-2Mbpd above our pre-COVID forecasts. The increase is from road fuels, reflecting lower mass transit, lower load factors and resultant traffic congestion.
Upgrades to our granular 2020-2050 oil demand models, including headline numbers, are outlined on pages 2-3.
Travel demand that will never come back is described on pages 4-5, including remote work, a shift to online retail and lower business travel. Our forecasts for higher oil demand are not based on a Panglossian recovery of travel habits to pre-COVID levels.
The shift from mass transit to passenger cars is detailed on pages 6-9, covering ground-transportation (buses and train), mid-range air travel, and reverse urbanization enabled by remote working.
Load factors are lightly reduced, requiring more cars to service each passenger-mile of travel, as outlined on page 10.
Higher road traffic dents fuel economy, which we have quantified using real-world data from the City of New York, also drawing on data from prior oil downturns, on pages 11-14.
Implications for oil markets, companies and the energy transition are discussed on pages 15-17.
Key points on long-run oil demand after COVID-19 are spelled out in the article sent out to our distribution list.
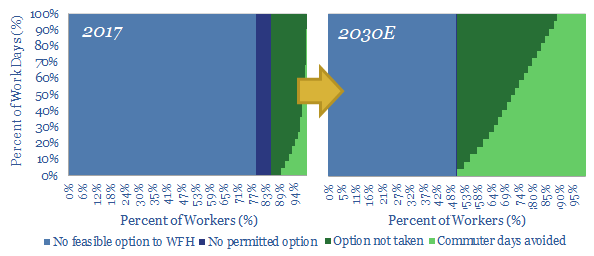
The COVID-19 crisis will structurally accelerate remote working. The opportunity is explored in our 21-page report. It can save 30% of commuter journeys by 2030, avoiding 1bn tons of CO2 per year, for a net economic benefit of $5-16k per employee. This makes remote work a materially more impactful opportunity than electric vehicles in the energy transition.
Remote work currently saves c3% of all US commuter miles, which comprise 33% of developed world gasoline demand (pages 2-4).
Remote work could save 30% of all commuter miles by 2030, structurally accelerating as the COVID-19 crisis changes habits (page 5).
Remote work, thus screens as more impactful than electric vehicles, as an economic opportunity in the energy transition (page 6).
Ecconomic benefits are $5-16k pp pa. Our numbers are conservative. They under-reflect productivity and wellbeing improvements in the technical literature (pages 7-8).
We stress test our numbers, looking profession-by-profession across the entire US labor force, and considering new technologies (pages 9-13).
Direct energy impacts save 1bn tons of annual CO2. Impacts on oil, gas and electricity demand are quantified, including evidence from the COVID crisis (pages 14-17).
Hidden consequences are more nuanced: reshaping mobility, urbanization and online retail habits (pages 18-21).
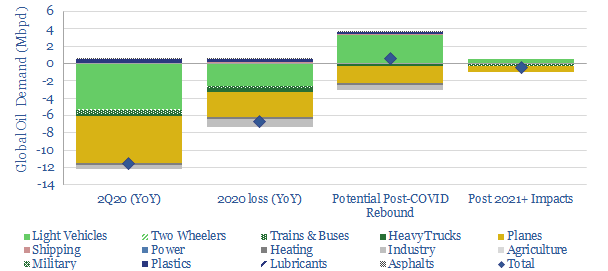
This 15-page note outlines our top three conclusions about COVID-19, which the oil markets may have missed. First, global oil demand likely declines by -11.5Mbpd YoY in 2Q20 due to COVID-19. This is over 15x worse than the global financial crisis of 2008-9, and too large for any coordinated production cuts to offset. Second, once the worst of the crisis is over, new driving behaviours could actually increase gasoline demand, causing a very sharp oil recovery. Finally, over the longer-term, structural changes will take hold, transforming the way consumers commute, shop and travel. (Please note, our oil supply-demand numbers have subsequently been updated here).
Pages 2-7 outline our new models of global oil demand and US gasoline demand, underpinning a scenario where oil demand likely falls -11.5Mbpd in 2Q20, and -6.5Mbpd YoY in 2020. In a more extreme downside case, declines of -20Mbpd in 2Q20 and 10Mbpd in FY20 are possible.
Pages 8-10 illustrate how gasoline demand could actually increase in the aftermath of the COVID crisis, once businesses re-open and travel resumes. The largest cause is a c25% potential degradation in developed world fuel economy per passenger, as lingering fears over COVID lower the use of mass transit and vehicle load factors.
Pages 11-15 outline our top three structural trends post-COVID, which will persist for years, transforming retail, commuting, leisure travel and the airline/auto industries.
Please don’t hesitate to contact us, if you have any questions or comments…
We presented our ‘Top Ten Themes for Energy in the 2020s’ to an audience at Yale SOM, in February-2020. The audio recording is available below. The slides are available to TSE clients, in order to follow along with the presentation.
Please sign up to our distribution list, to receive our best ideas going forwards…
Small, autonomous, electric delivery vehicles are emerging. They are game-changers: rapidly delivering online purchases to customers, creating vast new economic possibilities, but also driving the energy transition. Their ascent could eliminate 500MTpa of CO2, 3.5Mboed of fossil fuels and c$3trn pa of consumer spending across the OECD. The mechanism is a re-shaping of urban consumption habits, retail and manufacturing. The opportunities are outlined in our new, 20-page report.
The average US consumer buys 2.5 tons of goods per year, served by a vast distribution network of ships, trucks and smaller vehicles, collectively responsible for 1.5 barrels of oil, $1,000 of cost and 600kg of CO2 per person per annum (page 2).
Fuel economy currently deteriorates, with each step closer to the consumer. Container ships achieve c900 ton-miles per gallon of fuel. But delivery vans, the dominant delivery mechanism for internet purchases, are least efficient, achieving just 0.02 effective ton-mpg and costing at least $3.6 per delivery (page 3).
The rise of e-commerce has already increased supply chain CO2 by c30%, and supply chain costs by 2x since the pre-internet era. On today’s technologies, CO2 will rise another 20% and cost will rise another 50% by 2030, adding 0.7Mbpd of oil demand, 120MTpa of CO2 and $500bn of cost across the OECD (pages 4-5)
Drones and droids are 90-99% less energy intensive than delivery vans, and 70-97% less costly. The technology is maturing. Thus small, autonomous, electric vehicles will move immediately, efficiently, straight to their destination (pages 6-8).
Retail and manufacturing will have be transformed by the time drones approach 50% market share in last-mile delivery. Tipping-point economies-of-scale mean that they will take market share away from cars and delivery vans very rapidly (pages 9-10).
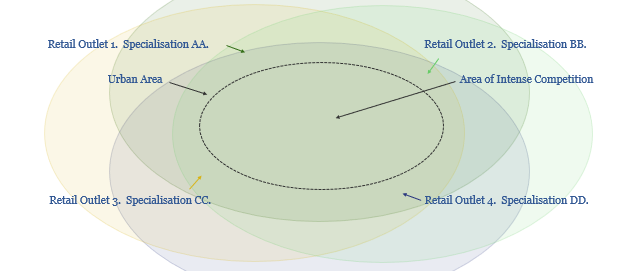
The second half of the report focuses in on the opportunities. Retail businesses must consolidate, specialise or diversify to “sharing” models. The latter can save $1trn of consumer spending and 100MTpa of emissions in the US alone (pages 11-20).
Precision-engineered proteins are on the cusp of disrupting the meat industry, according to an exceptional, 75-page report, published recently by RethinkX. The science is rapidly improving, to create foods with vastly superior nutrition, superior taste and superior costs, by the early-2020s.
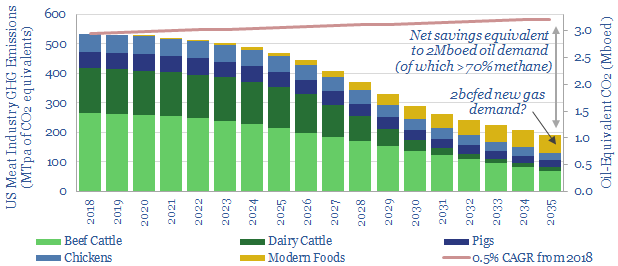
The energy opportunities are most exciting to us, after reading the report. If RethinkX’s scenarios play out, we estimate: direct CO2 savings of 400MTpa, enough to offset 10% of US oil demand; 2bcfd of upside to US gas demand; and enough land would be freed up to decarbonise all of US oil demand, or increase US biofuels production by 6x to c6Mbpd.
[restrict]
RethinkX Re-Thinks Food and Agriculture
ReThinkX argues “we are on the cusp of the deepest, fastest, most consequential disruption in food and agricultural production since the first domestication of plants and animals ten thousand years ago”. The disruption is producing proteins via precision fermentation (PF), which programs microorganisms to produce complex organic molecules in a fermenter.
It is a classic “tech disruption”. Individual molecules are now being engineered by scientists and uploaded to databases. Constant iteration is improving the process. Hence as Impossible Foods’ CEO has said: “unlike the cow, we get better at making meat every single day”. Eventually this will result in a superior product at a far lower cost than today’s cow-based meat industry.
Precision engineered proteins “will be superior in every key attribute – more nutritious, healthier, better tasting, and more convenient, with almost unimaginable variety”. Every aspect can be optimised, in a way impossible with animal-based meat, to yield better taste, more nutrients, higher purity, yet less salt, fat and no need for antibiotics. You could even, in principle, replicate meat proteins from extinct animals, if you want to eat mammoth or giant moa burgers.
The cost of producing PF molecules is deflating: from $1M/kg in 2000 to $100/kg today, on course to hit $10/kg in 2025. The descent matches genome sequencing, which now takes a few days and costs c$1,000, compared with 13-years and $1bn in 2000; and it matches computing, which now costs $60 per teraflop, down from $50M per teraflop in 2000.
The cost of producing meat. Today, animal beef costs c$4.5/kg. PF beef costs $7/kg. RethinkX expects cost parity in 2021, $2/kg pricing in 2024 and $1/kg pricing in 2030. The same trend holds for milk, where just 3.3% of the content is protein, the rest water and sugar. PF production times are also likely to be 100x faster than rearing animals.
More recent context. The number of new US food products with added protein doubled from 2013 to 2017. Protein-enriched milk is becoming popular with baristas as it’s easier to froth. Halo Top was the most popular new consumer product in 2017, an ice cream with 2x more protein than normal. Soylent’s breakfast-replacement costs $3.25 and has the equivalent of a grande latte’s caffeine, three eggs’ protein, 6 Oz tuna’s omega-3s and all 26 essential nutrients. $17bn has been invested in plant-based foods in 2013-18. Disrupting agriculture is already on the ascent.
The consequences. It is argued that “product after product that we extract from the cow will be replaced by superior, cheaper, modern alternatives, triggering a death spiral of increasing prices [for the cattle farming industry], decreasing demand, and reversing economies of scale”. RethinkX’s report explores potential savings of $100bn for families across the USA by 2030; and potential downside for the $1.25 trn per annum US livestock industry. We recommend the report. It is linked here.
Thunder Said Energy Re-Thinks Food and Agriculture Energy
PF energy economics are transformative. The rumen of cow is a 40-50 gallon reactor, with c4% feedstock efficiency, responsible for 70-120kg pa of methane emissions per year, which is in turn, a 23-36x more potent greenhouse gas than CO2. However, an industrial fermenter is a 50-10 thousand gallon reactor, with 40-80% feedstock efficiency and no methane emissions.
Implication 1. 400MTpa of Direct Decarbonisation. The US currently contains 93M cattle, which in turn account for 530MTpa of CO2-equivalent emissions, or c8% of total US greenhouse emissions. RethinkX sees cow numbers reducing 50% by 2030, as the US needs 70% fewer cow products (90% less dairy, 70% less ground beef, 30% less steak); rising to 80-90% by 2035. By 2035, the data imply 400MTpa of CO2-equivalents could be saved, which is equivalent to offsetting c2Mboed of oil consumption.
Implication 2. Incremental Gas Demand of 2bcfd? Although fermentation reactors are c10-20x more thermally efficient than cows, they will still require incremental energy. We believe natural gas is emerging as best placed to provide heating and electric energy for industrial processes. Modern foods in the US could require c2bcfed of incremental gas consumption, 2.5% upside on current US demand, and stoking our expectations for the long-run rise of gas.
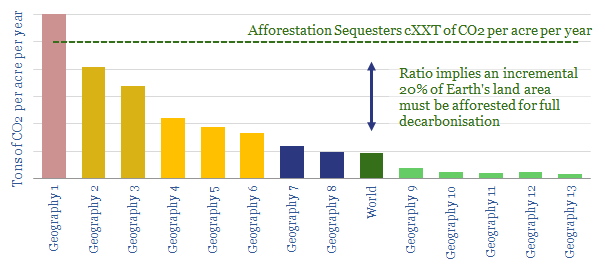
Implication 3. Decarbonising US Oil? We recently analysed seven major themes, which could eliminate 45Mbpd of global oil demand by 2050 (note here). But even on this aggressive scenario, we foresee US oil demand at 16Mbpd in 2035 and 11Mbpd in 2050. How can we decarbonise this oil? One solution is provided by re-purposing the 835M of land acres currently associated with US livestock farming: 655M for grazing, and 180M to grow crops. 60% will be freed for other uses by 2035, equivalent to 485M acres, or the entire Louisiana Purchase of 1803. If all of this land could be repurposed to grow forests, at a yield of c5.4T CO2 sequestation per acre, then we estimate enough CO2 could be absorbed to decarbonise 14Mbpd of oil demand. It is unlikely that all of this land can be repurposed in practice, but CO2 offsets could nevertheless be very large.
Implication 4. 5Mbpd of incremental biofuels. Another possibility is that some of the liberated land could be diverted into producing biofuels: Let us assume 250M acres can be devoted to growing corn, at a yield of c120 bushels per acre, and 2.8 gallons of ethanol per bushel. Multiply through and the total ethanol production would be 80 bn gallons per annum, equivalent to c5Mbpd of oil: 5x larger than current US biofuels production. Here is a positive opportunity for the energy industry, including the companies with the leading biofuels technologies.
Implication 5. Venture Opportunies? Finally, we have noted leading Energy Majors’ diversification into new energy technologies in their recent venture investments (chart below). Natural partnerships may emerge in PF companies. Indeed, we already saw BP deploy $30M investing in Calysta in June-2019, an alternative protein producer, for the aquaculture industry. Companies in the space are numerous: Beyond Meat went public in 1Q19. Impossible Foods is private, but valued at $2bn, having sold 13M units since 2016, and Burger King is introducing an Impossible Whopper in 2019, initially costing $1 more than the conventional Whopper. In March 2019, Geltor announced HumaColl21, the first human collagen created for cosmetics. We will tabulate other companies in a future screen.
Tubb, C. & Seba, T. (2019). Rethinking Food and Agriculture 2020-2030. RethinkX Sector Disruption Report. Full report linked here.
[/restrict]
We would be delighted to introduce clients of Thunder Said Energy to the reports’ authors, Catherine Tubb and Tony Seba. Please contact us if this is useful.
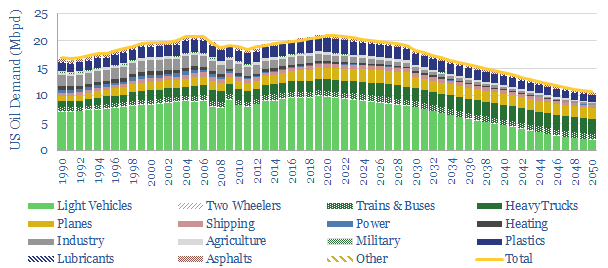
Many commentators fear long-run oil demand is on the cusp of a steep contraction, leaving oil and gas assets stranded. We are more concerned about the opposite problem. Projecting out the current trends, global oil demand is on course to keep rising to over 130Mbpd by 2050, undermining attempts to decarbonise the world’s energy system.
Our new, 20-page note reviews seven technology themes that can save 45Mbpd of long-term oil demand. We therefore find oil demand would plateau at 103Mbpd in the 2020s, before declining gradually to 87Mbpd in 2050. This is still an enormous market, equivalent to 1,000 bbls of oil being consumed every second.
Opportunities abound in the transition, in order to deliver our seven themes, improve mobility, substitute oil for gas, reconfigure refineries for changing product mixes, and to ensure that the world’s remaining oil needs are supplied as cleanly and efficiently as possible. Leading companies will seize these opportunities, driving the transition and earning strong returns in the process.
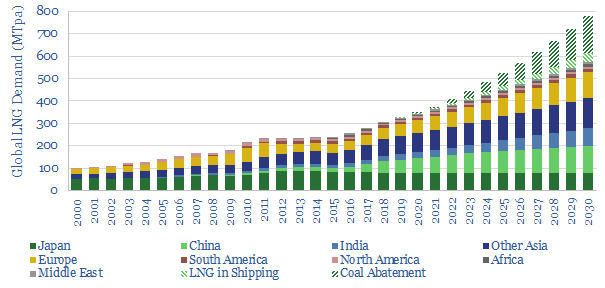
Gas demand could treble by 2050, gaining traction not just as the world’s cleanest fossil fuel, but also the most economical. The ascent would be driven by technology. Hence this note outlines 200MTpa of potential upside to consensus LNG demand, via de-carbonised power and shipping fuels. LNG demand could thus compound at 8% pa to 800MTpa by 2030, justifying greater investment in unsanctioned LNG projects.
[restrict]
Consensus LNG demand?
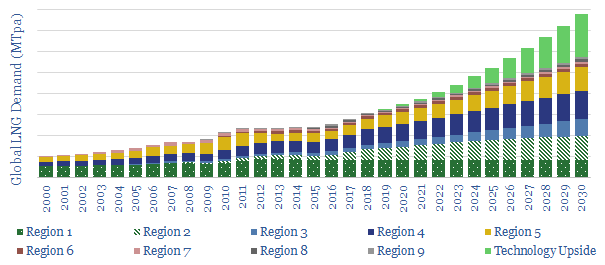
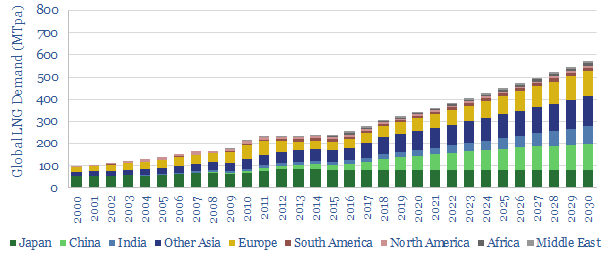
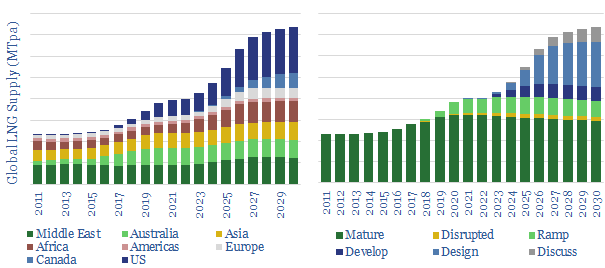
A simple model of global LNG demand is shown below (and downloadable here). It is created by extrapolating recent trends in key LNG-consuming regions. The total market grew at 5.7% pa in 2013-18. At a 5.4% forward CAGR, it would reach c570MTpa by 2030. These numbers are not far from other LNG forecasters’, and thus serve as a reasonable consensus.
What excites us is the potential for technology to accelerate LNG demand. Markets are slow to reflect technological breakthroughs. Hence these new demand sources likely do not feature in consensus forecasts yet. In our view, this makes them worthy of attention.
Upside from De-Carbonised Power Generation?
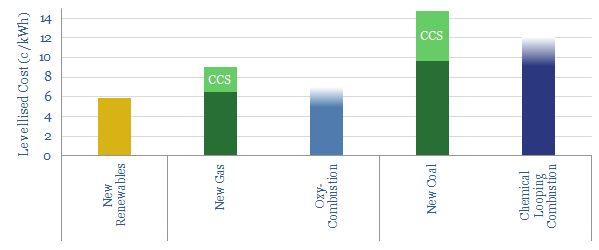
The first opportunity is in de-carbonised power generation, as we have discussed in our deep-dive report, ‘de-carbonising carbon‘. We think novel technologies are reaching maturity, which can generate cost-competitive electricity (chart below) alongside an exhaust stream of pure CO2, for use in industry or for immediate sequestration. The full details are in our report.
Let us now make some approximate calculations: The world consumes 7.7bn tons of coal per annum. In energy terms, this is equivalent to c165TCF of gas, or 3,300MTpa of LNG. We believe it would be economic, and achievable, to convert c5% of this coal power to gas by 2030. Converting it to decarbonised gas could save c1bn tons of CO2 emissions per annum. In turn, this could be achieved by 200GW of de-carbonised gas-power, in 500 x 400MW power plants, each burning c50mmcfd of input gas, fed by 165MTpa of LNG. This is the first area where technology can greatly accelerate LNG demand.
Upside in Shipping?
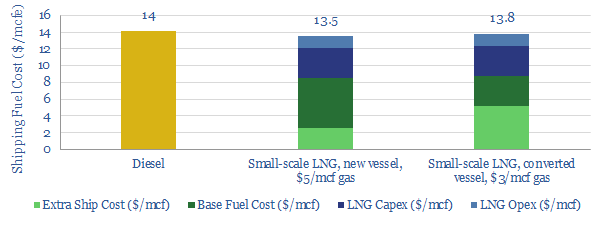
The second opportunity is in LNG as a shipping fuel, which will become increasingly economical after IMO 2020 sulphur regulations re-shape the marine sector. The economics are shown below and modelled here.
New technologies in small-scale LNG will accelerate adoption in smaller ports, moving beyond the large port-sizes required for bunkering. The technologies and economics are explored in detail, in our deep-dive note, LNG in Transport. The economics are modeled here. To assist, Shell is also pioneering new solutions for LNG in transport.
The upshot could be 40MTpa of incremental LNG demand in the maritime industry by 2030. This is the second area where technology can greatly accelerate LNG demand.
Less positive on trucking
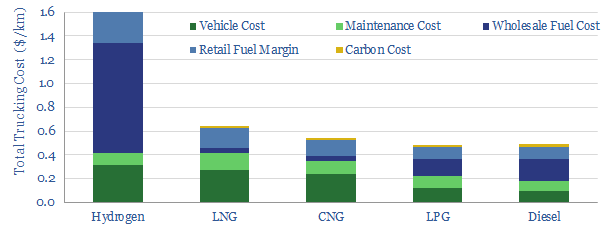
Is there further upside? One might expect, in an overview of LNG technologies, to find incremental upside in road vehicles: either directly in LNG-fired trucks, in gas-fired vehicles, or to produce hydrogen for fuel-cells. None of these opportunities are yet captured in our models.
The reason is economics. Compared to diesel-powered trucks, we find compressed natural gas to be c10% more expensive, LNG to be 30% more expensive and hydrogen to be around 4x more expensive (model here, chart below). We also find hydrogen to be 85% costlier than gasoline, to powers cars in Europe (model here). In most cases, electrification is the better option, as superior vehicle concepts emerge.
Our numbers do not include any incremental LNG demand in the road-transportation sector. However, it is noteworthy that replacing 1Mbpd, or c2% of the world’s road fuels with LNG would consume an incremental 50MTpa of LNG. This could cushion delays or shortfalls in decarbonised gas-power.
Potential supplies can meet the challenge.
It is only possible for the world to consume 800MT of LNG in 2030 if it is also possible to supply 800MT. While our risked forecasts are for c600MT of LNG supply in 2030 (chart below), our numbers are including just c60% of the 230MTpa of LNG capacity that is currently in the design phase, and just 15% of the 180MTpa that is currently in the discussion phase. In a generous scenario, our forecasts rise close to the 800MTpa level that is required. Please download our risked, LNG supply model to see our scenarios, and the LNG projects included.
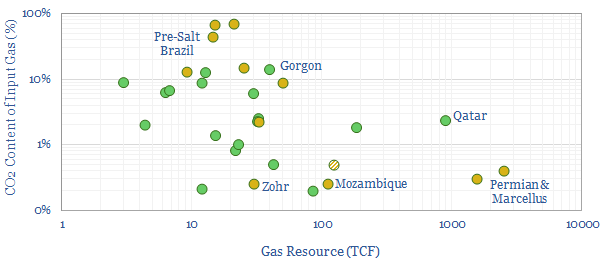
LNG technology could thus unlock incremental LNG facilities. We are most positive on low-cost, low-CO2 sources of gas, particularly in stable and low-tax countries. To help assess the potential, we have therefore compiled a data-file of the world’s great gas resources and their CO2 content, downloadable here. Our positive outlook on US LNG is further underpinned by our positive outlook on US shale.
Conclusions: path dependency?
The numbers above are not hard forecasts. We do not believe hard forecasts are possible in a market that is shaped by unpredictable geopolitics, technologies, weather and its own price-reflexivity. However, we have argued that new technologies may unlock materially more LNG demand than is currently embedded in consensus expectations. Leading companies with leading LNG projects may benefit.
[/restrict]
Cookies?
This website uses necessary cookies. Our cookies are simply to improve your experience. We do not undertake any advertising or targeting via our cookies. By clicking 'accept' or continuing to use the website, you consent to our use of cookies.AcceptRead More
Privacy & Cookies Policy
Privacy Overview
This website uses cookies to improve your experience while you navigate through the website. Out of these, the cookies that are categorized as necessary are stored on your browser as they are essential for the working of basic functionalities of the website. We also use third-party cookies that help us analyze and understand how you use this website. These cookies will be stored in your browser only with your consent. You also have the option to opt-out of these cookies. But opting out of some of these cookies may affect your browsing experience.
Necessary cookies are absolutely essential for the website to function properly. This category only includes cookies that ensures basic functionalities and security features of the website. These cookies do not store any personal information.
Any cookies that may not be particularly necessary for the website to function and is used specifically to collect user personal data via analytics, ads, other embedded contents are termed as non-necessary cookies. It is mandatory to procure user consent prior to running these cookies on your website.