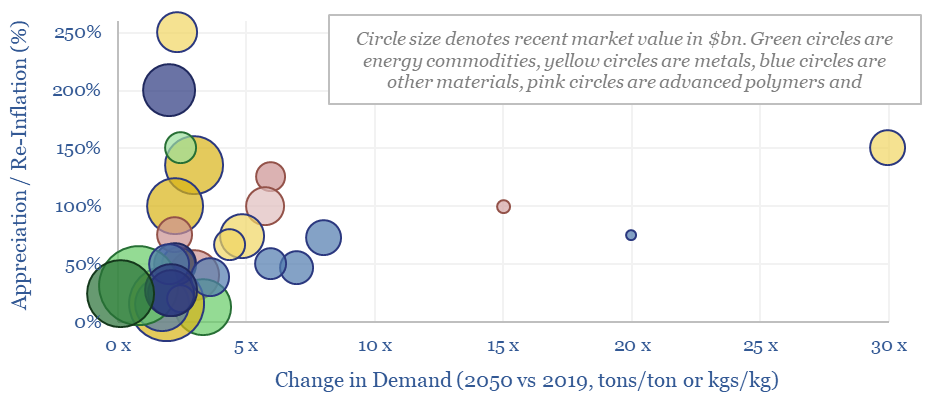
This data-file summarizes our latest thesis on the top thirty commodities needed for the energy transition. We estimate that the average commodity will see demand rise by 3x and price/cost appreciate or re-inflate by 60%. The scatter is broad. Upside ranges from 2x to 30x for different metals, materials, plastics and capital goods markets.
The data-file contains a 6-20 line summaries of our view on each commodity, and ballparks numbers on the market size, future marginal cost, CO2 intensity and pricing.
As a useful summary, summarizing all of our research into energy technologies and energy transition to-date, we have also ‘ranked’ these 30 top materials and commodities, according to our long-run outlook in this data-file in the ‘Materials’ tab of the data-file.
The median average commodity sees its demand treble in the energy transition. The mean average commodity sees its demand rise 1.5x. Top quartile commodities see growth of 5-30x, although this is most often because they are smaller markets to begin with.
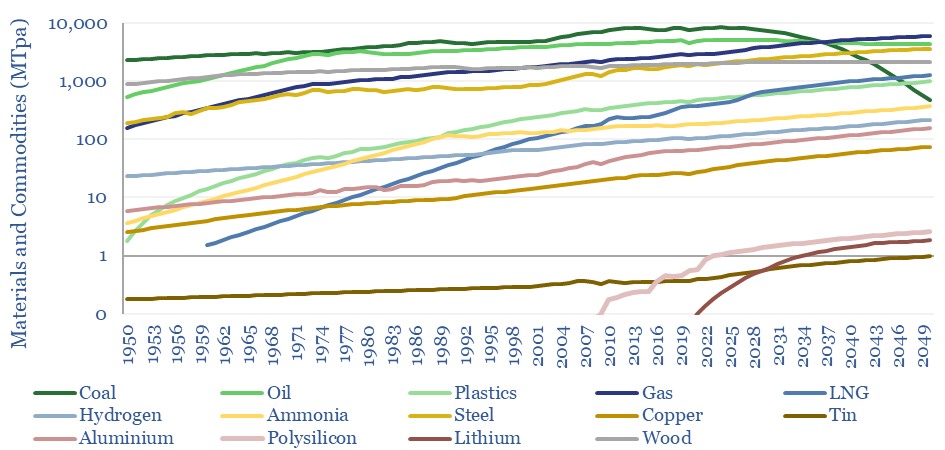
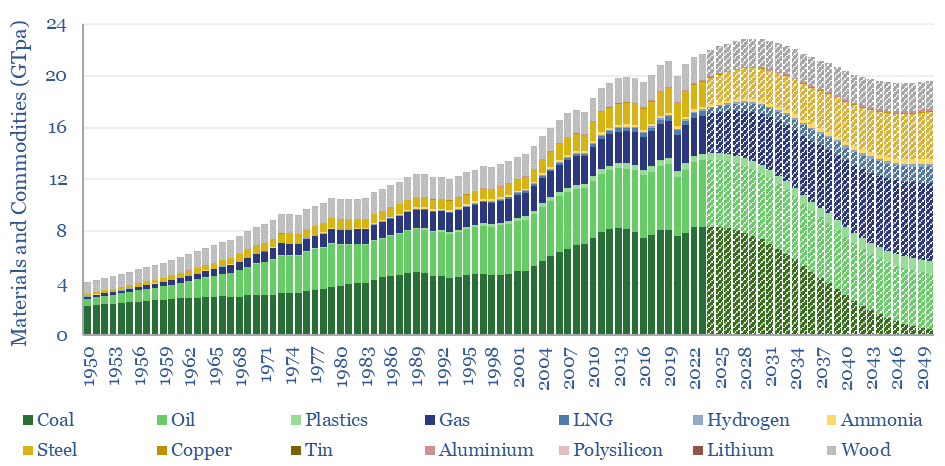
Although many commodities require sharp growth curves, if the world is going to reach net zero by 2050, this is not unprecedented. Some of the largest commodities are plotted below, from 1950-2050, with a weighted average growth CAGR of 2.5% per annum.

An apparent paradox in our energy transition roadmap, however, is that after rising at a 2.5% CAGR for the past 70-years, our aggregate models require the total tonnage off these commodities, as consumed by human civilization to move sideways from here. The main reason is phasing out higher carbon coal. This is only really realistic amidst a vast step up in solar, wind, power grids and natural gas as alternatives.

Commodities needed for the energy transition and covered in this data-file include Aluminium, Ammonia, Carbon Fiber, Coal, Cobalt, Copper, Ethylene Vinyl Acetate, Fluorinated Polymers, Fluorspar, Glass Fiber, Graphite, Hydrogen, Indium, Lithium, LNG, Mass Timber, Methanol, NdFeB Rare Earths, Nickel, Oil, Polyurethanes, PV Silicon, Silicon Carbide, Silver, STATCOMs, Steel, Sulphuric Acid, Tin, Uranium, Vanadium.
Further details on each commodity can be found by browsing our supply-demand models.
Another observation is that many of the commodities that excite us most, are strictly, becoming less commoditized, as we increasingly see evidence that the ramp-up of new energies – solar, wind, lithium ion batteries, electric vehicles – calls for advanced materials that confer higher performance and longevity. This is our new age of materials thesis. Leading examples are tabulated in the data-file.
Beware volatility! Soft bottlenecks can be defined as markets that will be tightened by the desire to accelerate the energy transition ever faster. Thus their prices and margins will generally rise. Supply will be available, prices will simply have to rise. Hard bottlenecks, however, may not be surmountable at any price, and we especially think this is the case for power grids. But inverse bottlenecks are most frightening. These materials are needed for the ascent of energy transition technologies, but whose demand and pricing unexpectedly collapse, because for a few months-years, these commodities are in a position of relative over-supply, due to another material being the hard bottleneck. For example, in a research report published in January-2023, we wrote “We are wondering whether PV silicon could see this kind of pricing action in 2023, as it said that China’s fabs will ramp from 300 GW at YE22 to 540 GW at YE23, while global gas shortages are going to disrupt production of silver and FPs“. In our view, timing volatile commodity bottlenecks is one way that active managers can add value as the energy transition impacts practically every supply chain on the planet.
We will continue adding to this data-file over time, as part of our ongoing energy transition research. Please contact us any time if you are a TSE client, and you think there is a particular commodity we should be adding while tracking commodities needed for the energy transition.
