US CO2 and Methane Intensity by Basin

US CO2 and Methane Intensity by Basin

The CO2 intensity of oil and gas production is tabulated for 425 distinct company positions across 12 distinct US onshore basins in this data-file. Using the data, we can break down the upstream CO2 intensity (in kg/boe), methane leakage rates (%) and flaring intensity (mcf/boe), by company, by basin and across the US Lower 48.


In this database, we have aggregated and cleaned up 957 MB of data, disclosed by the operators of 425 large upstream oil and gas acreage positions. The data are reported every year to the US EPA, and made publicly available via the EPA FLIGHT tool.

The database covers 70% of the US oil and gas industry from 2021, including 8.8Mbpd of oil, 80bcfd of gas, 22Mboed of total production, 430,000 producing wells, 800,000 pneumatic devices and 60,000 flares. All of this is disaggregated by acreage positions, by operator and by basin. It is a treasure trove for energy and ESG analysts.

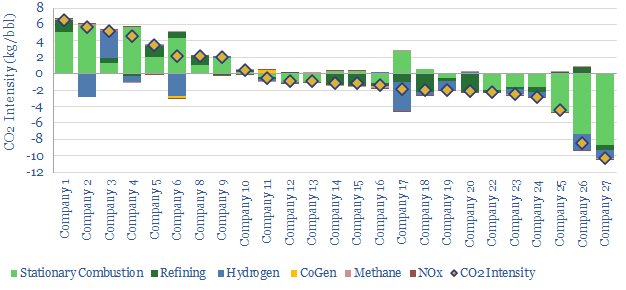
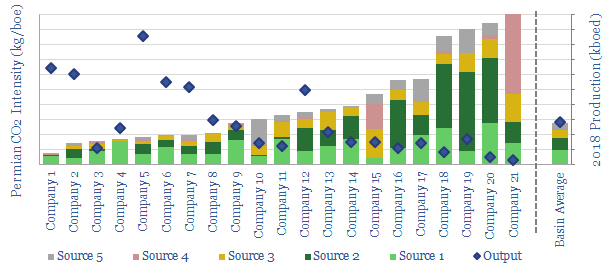
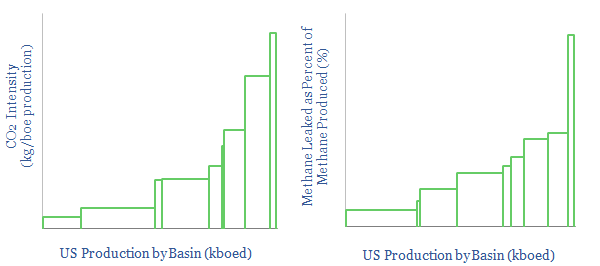
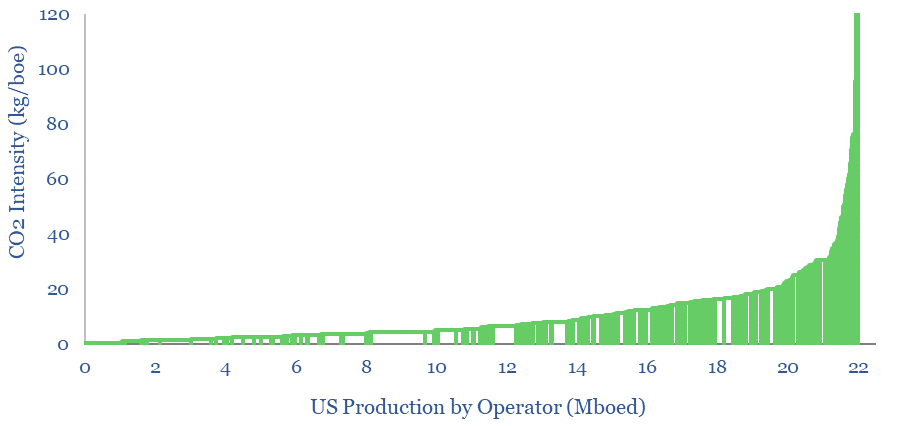
CO2 intensity. The mean average upstream oil and gas operation in 2021 emitted 10kg/boe of CO2e. Across the entire data-set, the lower quartile is below 3kg/boe. The upper quartile is above 13kg/boe. The upper decile is above 20kg/boe. And the upper percentile is above 70kg/boe. There is very heavy skew here (chart below).

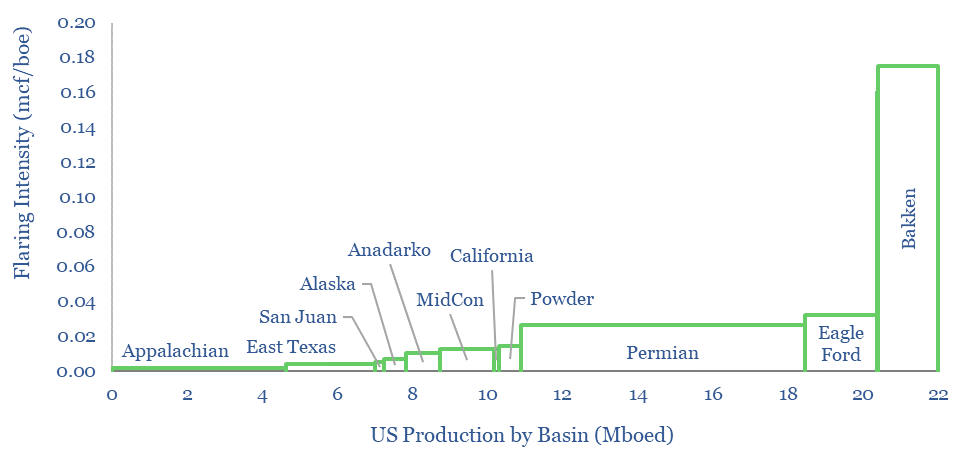
The main reasons are methane leaks and flaring. The mean average asset in our sample has a methane leakage rate of 0.21%, and a flaring intensity of 0.03 mcf/bbl. There is a growing controversy over methane slip in flaring, which also means these emissions may be higher than reported. Flaring intensity by basin is charted below.

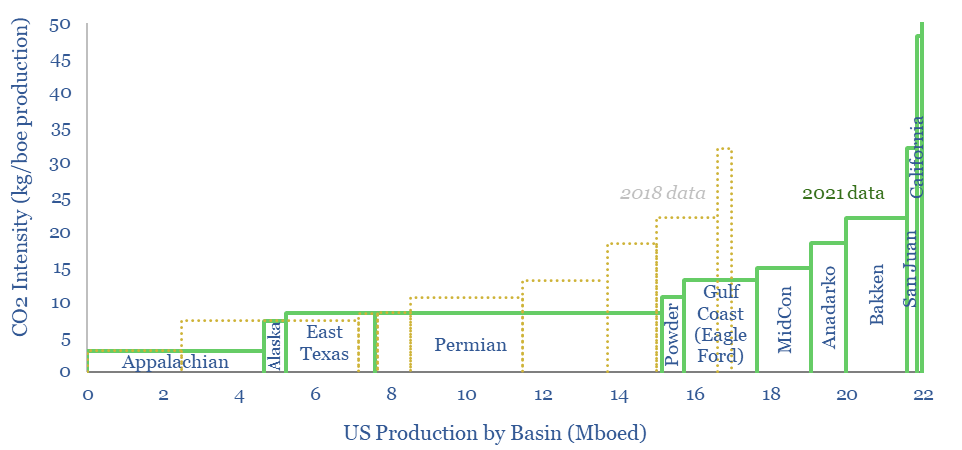
US CO2 intensity has been improving since 2018. CO2 intensity per basin has fallen by 17% over the past three years, while methane leakage rates have fallen by 22%. Activity has clearly stepped up to mitigate methane leaks.
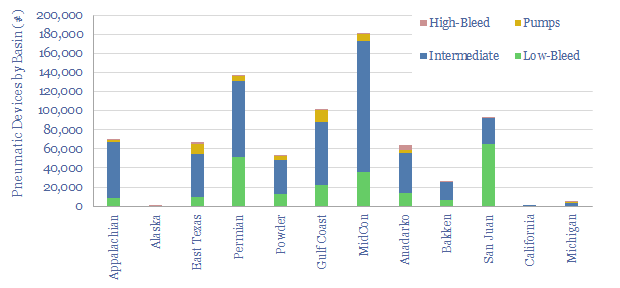
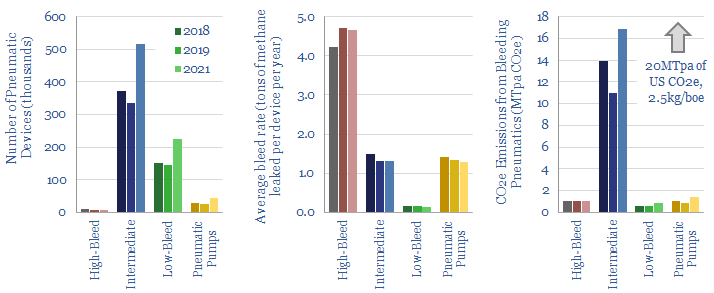
(You can also see in the data-file who has the most work still to do in reducing future methane leaks. For example, one large E&P surprised us, as it has been vocal over its industry-leading CO2 credentials, yet it still has over 1,000 high bleed pneumatic devices across its Permian portfolio, which is about 10% of all the high-bleed pneumatics left in the Lower 48, and each device leaks 4 tons of methane per year!).

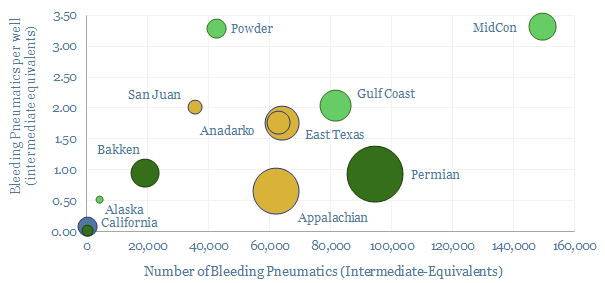
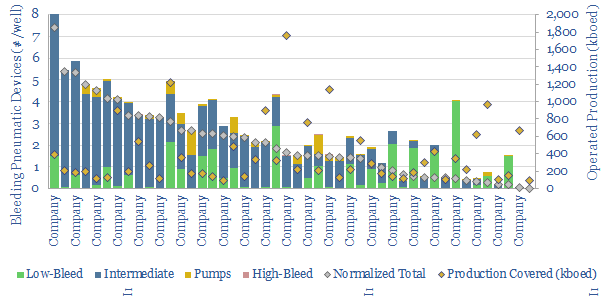
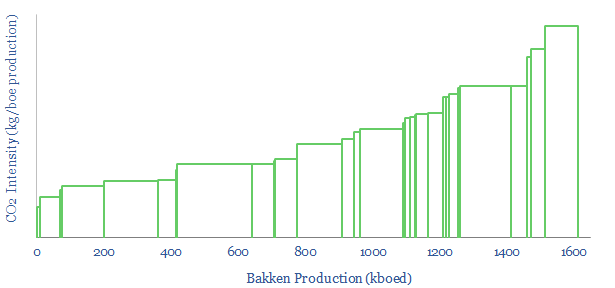
Most interesting is to rank the best companies in each basin, using the granular data, to identify leaders and laggards (chart below). A general observation is that larger, listed producers tend to have lower CO2 intensity, fewer methane leaks and lower flaring intensity than small private companies. Half-a-dozen large listed companies stand out, with exceptionally low CO2 intensities. Please consult the data-file for cost curves (like the one below).

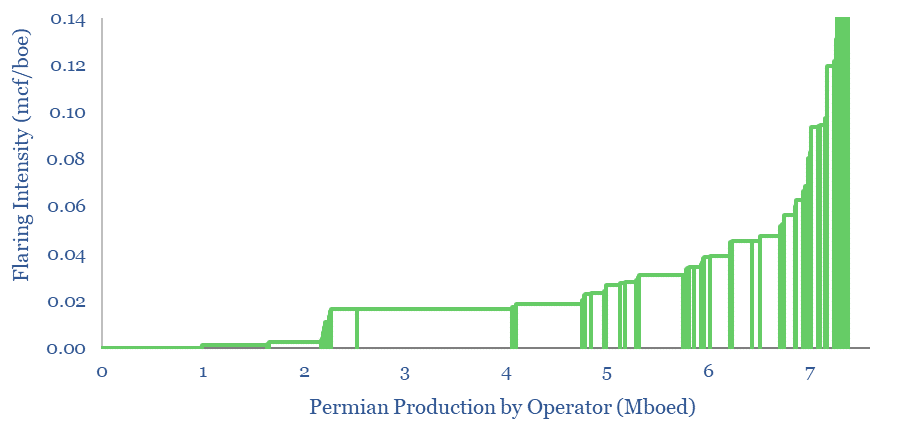
Methane leaks and flaring intensity can also be disaggregated by company within each basin. For example, the chart below shows some large Permian producers effectively reporting zero flaring, while others are flaring off over 0.1 mcf/bbl.

All of the underlying data is also aggregated in a useful summary format, across the 425 different acreage positions reporting in to EPA FLIGHT, in case you want to compare different operators on a particularly granular basis.

US Refiners: CO2 cost curve?

Which refiners have the lowest co2 intensity

Which refiners are least CO2 intensive, and which refiners are most CO2 intensive? This spreadsheet answers the question, by aggregating data from 130 US refineries, based on EPA regulatory disclosures.


The full database contains a granular breakdown, facility-by-facility, showing each refinery, its owner, its capacity, throughput, utilisation rate and CO2 emissions across six categories: combustion, refining, hydrogen, CoGen, methane emissions and NOx (chart below).

Assessed companies include Aramco, BP, Chevron, Citgo, Delek, ExxonMobil, Koch, Hollyfrontier, Marathon, Phillips66, PBF, Shell and Valero.

Tree database: forests to offset CO2?

CO2 uptake rates in forests by tree type

Nature-based solutions are among the most effective ways to abate CO2. Forest offsets will cost $2-50/ton, decarboning liquid fuels for <$0.5/gallon and natural gas for <$1/mcf (chart below).


CO2 uptake rates in forests by tree type

The data-file tabulates hundreds of data-points from technical papers and industry reports on different tree and grass types. It covers their growing conditions, survival rates, lifespans, rates of CO2 absorption (per tree and per acre) and their water requirements (examples below).

CO2 uptake rates in forests by tree type

Ventures for an Energy Transition?

Oil Major Venture Investments

This database tabulates almost 300 venture investments made by 9 of the leading Oil Majors, as the energy industry advances and transitions.


The largest portion of activity is now aimed at incubating New Energy technologies (c50% of the investments), as might be expected. Conversely, when we first created the data-file, in early-2019, the lion’s share of historical investments were in upstream technologies (c40% of the total). The investments are also highly digital (c40% of the total).

Four Oil Majors are incubating capabilities in new energies, as the energy system evolves. We are impressed by the opportunities they have accessed. Venturing is likely the right model to create most value in this fast-evolving space.

The full database shows which topic areas are most actively targeted by the Majors’ venturing, broken down across 25 sub-categories, including by company. We also chart which companies have gained stakes in the most interesting start-ups.

Methane emissions from pneumatic devices, by operator, by basin

Methane emissions from pneumatic devices

Methane leaks from 1M pneumatic devices across the US onshore oil and gas industry comprise 50% of all US upstream methane leaks and 15% of all upstream CO2. This data-file aggregates data on 500,000 pneumatic devices, from 300 acreage positions, of 200 onshore producers in 9 US basins.


The data are broken down acreage position by position, from high-bleed pneumatic devices, releasing an average of 4.1T of methane/device/year to pnuematic pumps and intermediate devices, releasing 1.4T, through to low-bleed pneumatic devices releasing 160kg/device/year.

It allows us to rank operators. Companies are identified, with a pressing priority to replace medium and high bleed devices. Other companies are identified with best-in-class use of pneumatics (chart below). The download contains 2018 and 2019 data, so you can compare YoY progress by company.

A summary of our conclusions is also written out in the second tab of the data-file.  For opportunities to resolve these leaks and replace pneumatic devices, please see our recent note on Mitigating Methane.

Permian CO2 Emissions by Producer

Permian CO2 Emissions by Producer

This data-file tabulates Permian CO2 intensity based on regulatory disclosures from 20 of the leading producers to the EPA in 2018. Hence we can  calculate the basin’s upstream emissions, in tons and in kg/boe.

The data are fully disaggregated by company, across the 20 largest Permian E&Ps, Majors and independents; and across 18 different categories, such as combustion, flaring, venting, pneumatics, storage tanks and methane leaks.

A positive is that CO2 intensity is -52% correlated with operator production volumes, which suggests CO2 intensity can be reduced over time, as the industry grows and consolidates into the hands of larger companies.

Solar Use within the Oil Industry?

solar use within the oil industry

This data-file tabulates 20 solar projects being undertaken within the oil industry, in order to clean up production and reduce emissions. More projects are needed, as the total inventory will obviate <1% of oil industry CO2 by 2025.

For each project, we estimate total TWH of power generation per annum, the CO2 emissions avoided, the timeline; and we also summarize the project details.

Leading examples include the use of concentrated solar for steam-EOR in Oman and California, Solar PV in the Permian, and leading efforts from specific companies: such as Occidental, Shell, Eni and other Majors.

At the cutting edge of EOR?

Leading Oil Majors in EOR

This data-file summarises 120 patents into Enhanced Oil Recovery, filed by the leading Oil Majors in 2018. Based on the data, we identify the “top five companies” and what they are doing at the cutting edge of EOR.

We find clear leaders for water-flooding both carbonate and sandstone reservoirs. At mature fields, we think these operators may be able to derive >10pp higher recovery factors; and by extension, lower decline rates, higher cash flows and higher margins.

As more of the world’s oilfields age, having an “edge” in EOR technology will make particular Oil Majors more desirable operators and partners, to avoid the higher costs and CO2 intensities of developing new fields to replace them.


Lubricant Leaders: our top five conclusions

Oil Major lubricant technologies

This data-file presents our “top five” conclusions on the lubricants industry, after reviewing 240 patents, filed by the Oil Majors in 2018. The underlying data on each of the 240 patents is also shown in the ‘LubricantPatents’ tab.

We are most impressed by the intense pace of activity to improve engine efficiencies (chart above), across  over 20 different categories. As usual, we think technology leadership will drive margins and market shares. ‘Major 1’ stands out, striving hardest to gain an edge, by a factor of 2x. ‘ Major 2 has the ‘greenest’ lubricant patents, across EVs and bio-additives. Major 4 has the single most intriguing new technology in the space.

The relative number of patents into Electric Vehicle Lubricants is also revealing. It shows the Majors’ true attitudes on electrification, in a context where they are incentivised to sell new products into the EV sector. Our lubricant demand forecasts to 2050 are also noted.

Make CO2 into valuable products?

Make CO2 into valuable products

This data-file is a screen of 27 companies, which are turning CO2 into valuable products, such as next-generation plastics, foams, concretes, specialty chemicals and agricultural products.


For each company, we have assessed the commercial potential, technical readiness, partners, size, geography and other key parameters. 13 companies have very strong commercial potential. 10 concepts are technically ready (up from 8 as assessed in mid-2019),  6 are near-commercial (up from 5 in mid-2019), while 13 are earlier-stage.

A detailed breakdown is also provided for the opportunity to use CO2 enhancing the yields of commercial greenhouses (chart below).

The featured companies include c21 start-ups. But leading listed companies include BP (as a venture partner), Chevron Phillips, Covestro, Repsol, Shell, TOTAL (as a venture partner) and Saudi Aramco.

Copyright: Thunder Said Energy, 2019-2023.