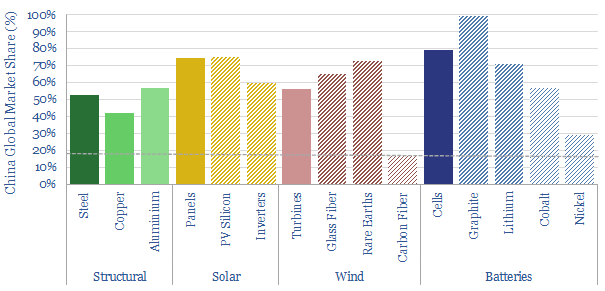
China is 18% of the world’s people and GDP. But it makes c50% of the world’s metals, 60% of its wind turbines, 70% of its solar panels and 80% of its lithium ion batteries. Re-shoring the energy transition will likely be a growing motivation after events of 2022. This 14-page note explores resultant opportunities.
World events in 2022 have created a new appetite for self-reliance; avoiding excessive dependence upon particular suppliers, in case that relationship should sour in the future. China’s exports are 5x Russia’s. And it dominates supply chains that matter for the energy transition. The trends and market shares are quantified on pages 2-4.
There are five challenges that must be overcome, in order to re-shore value chains from China to the West: input materials, energy costs, 2-3 re-inflation risks, dumping and general Western NIMBY-ism. We outline each challenge on pages 5-6.
Re-shoring the energy transition and its best opportunities are summarized, looking across all of our research, for metals and materials (page 7), wind (page 8), solar (page 9) and batteries (pages 10-11). In each case, where would be the most logical to site the infrastructure, and which companies are involved?
An unexpected implication of re-shoring these value chains is that their underlying energy demand would be re-shored too. Our current base case is that Western energy demand per capita has peaked and Western oil demand is in absolute decline. These markets may be re-shaped, with resultant opportunities for infrastructure investors (pages 12-14).
For an outlook on China’s coal industry and how we compare Chinese coal companies to Western companies, please see our article here.
The Amazon tipping point theory postulates that another 2-10% deforestation could make the world’s largest tropical rainforest too dry to sustain itself. Thus the Amazon would turn into a savanna, releasing 80GT of carbon into the atmosphere, single-handedly inflating atmospheric CO2 by 40ppm (to well above the 450ppm limit for 2C warming). This matters as Amazon deforestation rates have already doubled under Jair Bolsonaro’s presidency. This note explores implications, including international tensions, divestments, prioritization in a Biden presidency, and consequences for other transition technologies.
Global deforestation remains the single largest contributor to CO2e-emissions induced by man’s activities, more than the emissions from all passenger cars; and destruction of nature remains the largest overall contributor, more than all of China (chart below). This note is about a particularly worrying feedback loop in the Amazon rainforest, which could single-handedly wipe out the world’s remaining CO2 budget, effectively negating the impact of all other climate policies globally.
The Amazon rainforest currently covers 5.5M square kilometers, comprising the largest, contiguous tropical forest in the world. 50% is in Brazil, and the remainder is spread around Peru, Colombia and half-a-dozen other South American countries. It contains 20% of all the planet’s plant and animal species, including 40,000 plant species alone.
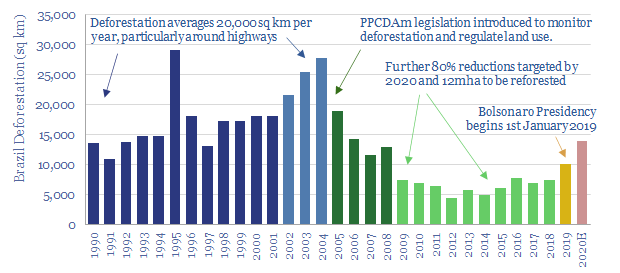
Deforestation of the Amazon has reached 15-17% of its original area overall, and around 19% in Brazil. 800,000 square kilometers has been lost to-date (a land area equivalent to 2x California; or all of France plus Germany). Brazil’s annual deforestation rates have averaged 20,000 square kilometers per year from 1990-2004 (the land area of New Jersey or Slovenia). But the rate slowed to a trough of 5,000 square kilometers in 2014 due to improving environmental policies.
Unfortunately, more recently, Brazil’s deforestation rate has re-doubled (chart below). Jair Bolsonaro’s Presidency began in January-2019, following campaign pledges to ease environmental and land use regulations (which require 80% of legal Amazon land holdings to remain uncleared). Violations of these regulations are now said to be going unpunished. Bans on planting sugarcane in the Amazon have been lifted. Bolsonaro has even repudiated data published by Brazil’s own government agencies showing deforestation rates rising and accused actor and environmentalist, Leonardo DiCaprio of starting wildfires!
This matters because of the hydrology of the Amazon. Water in the basin tends to move from East to West. Each molecule typically falls as rainfall six times. It is repeatedly taken up by trees, transpired back into the atmosphere, and precipitated back down to Earth. Over half of the rain falling in the Amazon has originated from trees in the Amazon. It is a self-sustaining feedback loop.
The Amazon Tipping Point theory predicts that below some critical level of forest cover, this self-sustaining feedback loop will break. Less rainforest means less transpiration. Less transpiration means less rainfall. Less rainfall means less rainforest. Specifically, converting each hectare of forest to cropland reduces regional precipitation by 0.5M liters/year.
After the tipping point it is feared that the basin will transition into a savanna or scrubland. 50-100% of the forest cover would die back.
Unfortunately, this is not a ‘fringe’ theory. Many different technical papers acknowledge and model the risk, although specific climate models are imprecise, and do not always agree on timings and magnitudes. For example, the Western Amazon, closer to the Andes, might retain more forests than the East and Central parts of the basin. Another uncertainty is the moderating impacts of fire, as dryer forests will be more flammable, and thus more susceptible to slash-and-burn clearances, while raging fires will also reach further.
When is the tipping point? Various technical papers have estimated that the Amazon tipping point occurs when 20-25% of the forest has been cleared. This is an additional 2-10% from today’s levels, equivalent to deforesting another 100-600k acres, which could happen within 2-30 years.
What carbon stock is at risk of being released?
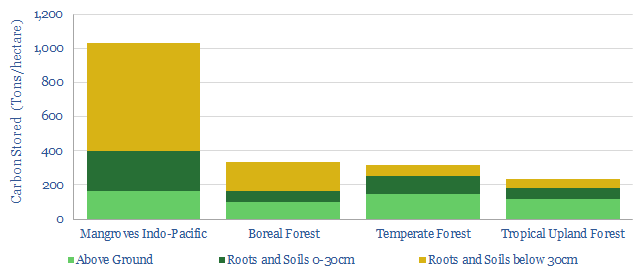
A typical forest contains around 300T of carbon per hectare (chart below). Thus 5.5M square kilometers of the Amazon is expected to contain 165GT of carbon. About 40% of the carbon is usually stored in trees (estimated at 60-80GT in the Amazon) and 60% is stored in roots and soils, which degrades more slowly. Hence, if just half of the remaining Amazon disappears, this would slowly release c80GT of carbon into the atmosphere.
Each billion tons (GT) of carbon released into the atmosphere is equivalent to raising atmospheric CO2 by around 0.5ppm. Hence a 80GT carbon release from the Amazon would by itself raise atmospheric CO2 from 415ppm today to around 455ppm. This single change (notwithstanding the continued and unmitigated burning of fossil fuels) would tip the world above the 450ppm threshold needed to keep global warming to an estimated 2-degrees (climate model below).
The solution to Amazon tipping points is technically simple: stop burning down forests and start re-planting them. This does not require electrolysing water molecules into hydrogen, smoothing volatility in renewable-heavy grids, or developing next-generation batteries. It requires something much harder: international diplomacy.
Inflammatory statements? In September-2019, Bolsonaro defended his environmental policies in a speech at the UN General Assembly. International critics were accused of assaulting Brazil’s sovereignty. Brazil considers itself free to prioritize economic development over environment.
Forest for ransom? In the past, Western countries have actually paid Brazil to safeguard its rainforests, although this arrangement has now fallen apart. Specifically, the ‘Amazon Fund’ was created in 2008. It is managed by Brazil’s state-owned development bank, BNDES. $1.3bn has been donated to the fund, from Norway (94%), Germany (5%) and Petrobras (1%). But after taking office, Bolsonaro has packed the fund’s steering committee with members of his inner circle, and in May-2019, he started using the Fund to compensate land developers whose lands were confiscated for environmental violations. Hence Norway and Germany suspended fund payments.
Divestment and trade tensions? As Brazil’s stance on the Amazon has grown more confrontational, it is possible that decision-makers may distance themselves from the country. Global investment funds have threatened to divest. (Could Brazil even surpass the coal industry as the divestment movement’s whipping boy?). Multi-national corporations may also be more cautious around investing in the country (but probably at the margin). Finally, Amazon deforestation is said to endanger future trade deals.
The Biden Factor? President-elect Biden may also seek to influence the Amazon issue. Biden stated the world should collectively offer Brazil $20bn to stop Amazon deforestation and threaten economic consequences for refusing. An executive order re-entering the Paris Climate Agreement would also help the situation (Brazil had actually committed to restoring 12M hectares of native vegetation under the accord). It will be interesting to see how Biden balances climate-focused priorities in the US with this arguably more urgent issue abroad.
Crucial Conclusions? If the Amazon surpasses its tipping point, there would be no chance of limiting atmospheric CO2 to 450ppm or preventing a catastrophic loss of biodiversity. Diplomacy is difficult. But fortunately, decision-makers can take measures into their own hands. Our note below profiles tree-planting charities. This is the lowest-cost decarbonization option we have found in all of our research. It restores nature, including the Amazon. Ultimately, we have argued that restoring nature may the most practical route to achieving climate objectives, while ‘bursting the bubble’ of other transition technologies.
Joe Biden’s presidency will prioritize energy transition among its top four focus areas. Below we present our top ten pieces of research that gain increasing importance as the new landscape unfolds. We are cautious that aggressive subsidies may stoke bubbles and supply shortages in the mid-2020s. Decisions-makers will become more discerning of CO2. As usual, we focus on non-obvious opportunities.
(1) Kingmaker? There are two policy routes to accelerate the energy transition. An escalating CO2 tax could decarbonize the entire US by 2050, for a total abatement cost of $75/ton, while unlocking $3.5trn of investment. The other approach is with subsidies. This is likely to be Biden’s preferred approach. However, giving subsidies to a select few technologies tends to crowd out progress elsewhere. Who gets the subsidies is arbitrary, and thus ensues a snake-pit of lobbying. It is also more expensive, with some subsidies today costing $300-600/ton. Finally, subsidies will only achieve limited decarbonization on our models. Our 14-page note outlines these ideas and backs them up with data, to help you understand the policy landscape we are entering.
(2) Bubbles? The most direct risk of aggressive subsidies is that we fear they will stoke bubbles in the energy transition. Specifically, we have argued a frightening resemblance is appearing between prior and notorious investment bubbles (from Dutch tulips to DotCom stocks) and many of the best-known decarbonization themes today. It is driven by an expectation that government policies will grow ever more favorable, thus technical and economic challenges are being overlooked. Our 19-page note evaluates the warning signs, theme by theme, to help you understand where bubbles may be likely to build and later burst.
(3) Overbuilding renewables is a potential bubble. Our sense is that Biden’s policy team prefers to subsidize renewables today and defer the resultant volatility issues for later. But eventually, we model that this will result in power grids becoming more expensive and more volatile, which could end up having negative consequences, both for consumers and industrial competitiveness. More interestingly, we find expensive and volatile grids have historically motivated installations of combined heat and power systems behind the meter, which can also cut CO2 emissions by 6-30% compared to buying power from the grid, at 20-30% IRRs. The reason is that CHPs capture and use waste heat. Thus they achieve c70-80% thermal efficiencies, where simple cycle gas turbines only achieve c40%. The theme and opportunity are therefore explored in our 17-page note below.
(4) Over-building electric vehicles? Subsidies for EVs are also more likely under a Biden presidency. This is widely expected to destroy fossil fuel demand. Indeed a vast scale-up of EVs is present in our oil demand forecasts helping global oil demand to peak in 2023. However, our 13-page note finds this electrical vehicle ramp-up will actually increase net fossil fuel demand by +0.7Mboed from 2020-35, with gains in gas exceeding losses of oil. The reason is that manufacturing each EV battery consumes 3.7x more energy than the EV displaces each year. So there is an energy deficit in early years. But EV sales are growing exponentially, so the energy costs to manufacture ever more EVs each year outweighs the energy savings from running previous years’ EVs until the EV sales rate plateaus.
(5) Under-investment in fossil fuels? A sticking point in the presidential debates was whether President Biden would ban fracking. An impressive understanding of the energy industry was shown by his response that instead “we need a transition”. However, some have commentators continued fearmongering. We think the fearmongering is overdone. Nevertheless, at the margin, Biden’s presidency may reduce investment appetite for oil and gas. In turn, this would exacerbate the shortages we are modelling in the 2020s. A historical analogy is explored in our 8-page note, which looks back at whale oil, a barbaric lighting fuel from the 19th century. Amidst the transition to kerosene and electric lighting, whale oil supply peaked long before whale oil demand, causing strong price performance for whale oil itself, and very strong price performance for by-products such as whale bone.
(6) Under-investment in oil? Our oil market outlook in 2021-25 is published below. New changes include downward revisions to US shale supplies (particularly from 2022), increased chances of production returning in Iran, and increased production from Saudi Arabia and Russia to compensate for lower output in the US. Steep under-supply is seen in 2022, over 1Mbpd, even after OPEC has exited all production cuts. Restoring market balance in 2024-25 requires incentivizing an 8Mbpd shale scale-up. We do not believe Biden’s policies will block this shale ramp, but they may help its incentive costs re-inflate by c$5-15/bbl, particularly if Trump-era tax breaks are reversed.
(7) Under-investment in gas? Where US shale growth slows, there is clearly going to be less associated gas available to feed US LNG facilities. But there may also be a lower investment appetite to construct US LNG facilities. This matters because our 12-page note below finds gas shortages are likely to be a bottleneck on decarbonization in Europe, which compounds our fears that Europe’s own decarbonization objectives could need to be walked back. Specifically, Europe must attract another 85MTpa of global LNG supplies before 2030 to meet the targets shown on the chart. This is one-third of the 240MTpa risked LNG supply growth due to occur in the 2020s, of which 100MTpa is slated to come from the United States. There is no change to our numbers yet.
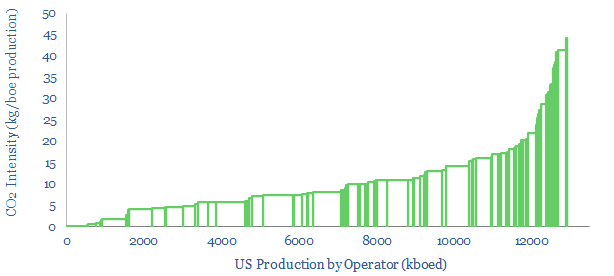
(8) Lower carbon beats higher carbon? We are not fearmongering that oil and gas investment will stall under a Biden presidency. But we do believe that investment in all carbon-intensive sectors will proceed somewhat more discerningly than it would have under Trump. Low-carbon producers will be more advantaged in attracting capital, while higher-carbon producers will be penalized with higher capital costs and lower multiples. In order to help you rank different operators, we have assembled a data-file covering 13Mboed of production from major US basins, operator-by-operator (below and here) alongside our broader screens of CO2 intensity, which span across 30 different sectors, such as LNG plants, refineries, chemical facilities, cement and biofuels (here).
(9) Mitigating methane? Biden’s presidency will likely re-strengthen the EPA. Our hope is that this will accelerate the industry’s assault on leaking methane, which is a 25-120x more powerful greenhouse gas than CO2. Methane accounts for 25-30% of all man-made warming, of which c25% derives from the oil and gas industry. If 3.5% of gas is leaked across the value chain, then debatably gas is no greener than coal (the number is less than 1% in the US but can be greatly improved). Our 23-page note evaluates the best emerging technology options to mitigate methane. We are excited by replacing high-bleed pneumatics, as profiled in our short follow-up note (also below). We also see shale operators accelerating their quest for ‘CO2-neutral’ production (note below).
(10) The weatherization of 2M homes is a central part of Joe Biden’s proposed energy policy. Hence we created a data-file assessing the costs and benefits of different options. The most cost-effective way to lower home heating bills is smart thermostats. They can cut energy use c18%. Leading providers include Nest (Google), Honeywell, Emerson, Ecobee. Second most cost-effective is sealing air leaks. GE Sealants is #1 by market share in silicone sealants. Advanced plastics would also see a modest boost in demand. More questionable are large and expensive construction projects, which appear to have larger up front costs and abatement costs per ton of CO2.
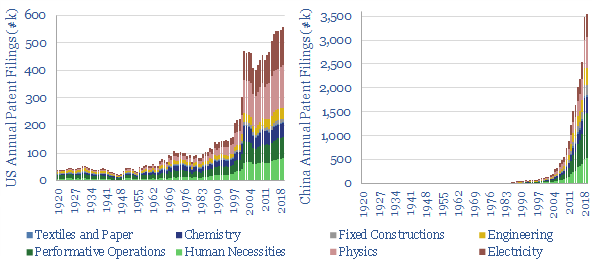
China’s pace of technology development is now 6x faster than the US, as measured across 40M patent filings, contrasted back to 1920 in this short, 7-page note. The implications are frightening. Analysing the US vs China technology development raises questions over the Western world’s long-term competitiveness, especially in manufacturing; and the consequences of decarbonization policies that hurt competitiveness.
Our conclusions are presented in this short note from tabulating 40M patents in the US and China back to 1920.
China first filed more patents than the US in 2007, and filed 6x more in 2019. Our charts compare the US vs China technology development across multiple industrial categories, presenting implications for trade and energy policy.
The long-term history of patent filings is also compared globally, for the US, for China and for Japan. In some countries, the pace of patent filings has been 90% correlated with GDP growth.
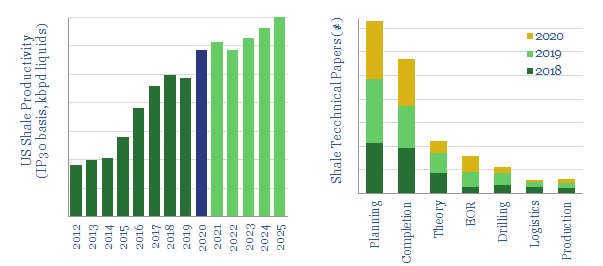
Future US shale productivity can still rise at a 5% CAGR to 2025, based on evaluating 300 technical papers from 2020. The latest improvements are discussed in this 12-page note, and may spark more productivity gains than any prior year. Thus unconventionals could grow by 2.6Mbpd per annum from 2022-25 to quench deeply under-supplied oil markets. But hurdles remain. The leading technologies are also becoming concentrated in the hands of fewer operators and an emerging group of oil services.
Our production forecasts for US shale are outlined on pages 2-3. Volumes must double by 2025 to rebalance future oil markets, which hinges on productivity gains.
Our outlook for shale productivity is explained on page 4, including our methodology, which considers the pace of progress in technical papers.
Headline comparisons are presented on pages 5-6, between the technical papers filed around the shale industry in 2018, 2019 and 2020.
The latest improvements are summarized across each category, drawing on the most interesting technical papers and the companies that have filed them. This includes petrophysics (page 7), completion designs (page 8), optimizing completion fluids (page 8), Shale-EOR (page 9) and a step-change in machine learning algorithms (page 10-11).
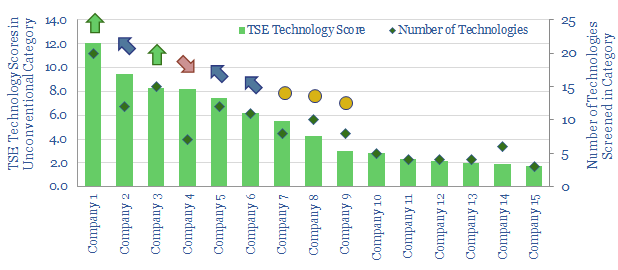
The leading companies are highlighted on page 12, ranked according to the numbers of technical papers they have filed in each year. Some are stepping up, and gaining an edge, while others are clearly pulling back on shale R&D.
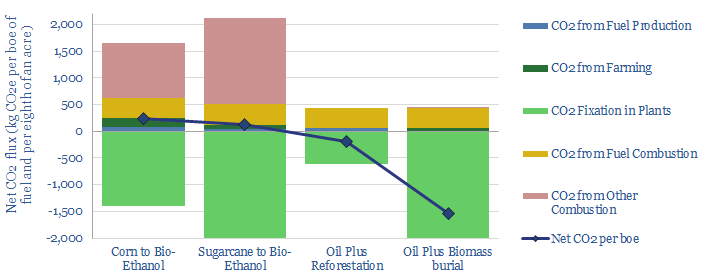
Burying biomass to sequester CO2 could be more economical than biofuel production with a $15-50/ton carbon price. Thus the global bioethanol industry could be disrupted. Burying biomass would also remove 8x more CO2 per acre, at a lower total cost. More conventional oil could be decarbonized with offsets. Ethanol mills and blenders would be displaced. The numbers and implications are outlined in this 12-page report.
Nature-based solutions to climate change need to double annual CO2 uptake from plants in our models of decarbonization, using forests and fast-growing grasses (pages 2-3).
We profile the bioethanol industry, which is already using fast-growing grasses to offset 2Mbpd of liquid fuels. But our models suggest the economics, efficiency and CO2 intensities are weak (pages 4-6).
A first alternative is to reforest the land used to grow biofuels, which would carbon-offset 1.5x more oil-equivalents than producing biofuels (pages 7-8).
A more novel alternative is to bury the biomass, such as sugarcane or other fast-growing grasses, which could sequester 8x more CO2, with superior economics at $15-50/ton CO2 prices (pages 9-11). Another concept is to bury wood for carbon sequestration.
Company implications are summarized, suggesting how the ethanol industry might be displaced, and quantifying the CO2 intensity of incumbents (page 12).
It is no longer possible to compete in the US shale industry without leading digital technologies. This 10-page note outlines best practices, process by process, based on 500 patents and 650 technical papers. Chevron, Conoco and ExxonMobil lead our screens. We profile where they have an edge, to capture upside in the industry’s dislocation and recovery. Disconcertingly absent from the leader-board is EOG, whose long-revered technical edge may now have been eclipsed by others.
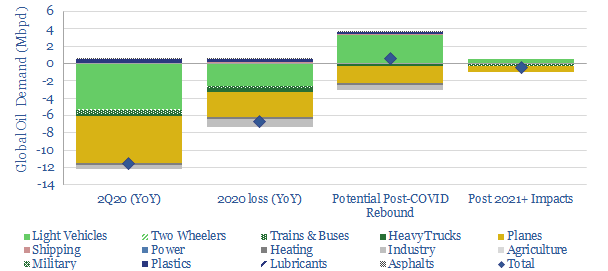
This 15-page note outlines our top three conclusions about COVID-19, which the oil markets may have missed. First, global oil demand likely declines by -11.5Mbpd YoY in 2Q20 due to COVID-19. This is over 15x worse than the global financial crisis of 2008-9, and too large for any coordinated production cuts to offset. Second, once the worst of the crisis is over, new driving behaviours could actually increase gasoline demand, causing a very sharp oil recovery. Finally, over the longer-term, structural changes will take hold, transforming the way consumers commute, shop and travel. (Please note, our oil supply-demand numbers have subsequently been updated here).
Pages 2-7 outline our new models of global oil demand and US gasoline demand, underpinning a scenario where oil demand likely falls -11.5Mbpd in 2Q20, and -6.5Mbpd YoY in 2020. In a more extreme downside case, declines of -20Mbpd in 2Q20 and 10Mbpd in FY20 are possible.
Pages 8-10 illustrate how gasoline demand could actually increase in the aftermath of the COVID crisis, once businesses re-open and travel resumes. The largest cause is a c25% potential degradation in developed world fuel economy per passenger, as lingering fears over COVID lower the use of mass transit and vehicle load factors.
Pages 11-15 outline our top three structural trends post-COVID, which will persist for years, transforming retail, commuting, leisure travel and the airline/auto industries.
Please don’t hesitate to contact us, if you have any questions or comments…
The key challenge for the US shale industry is to continue improving productivity per well, as illustrated repeatedly in our research. Hence, this short note reviews an advance in fracturing fluids, which has been patented by BP. Diverter compositions are optimised across successive pressurization cycles, to create dendritic fracture geometries, which will enhance stimulated rock volumes.
[restrict]
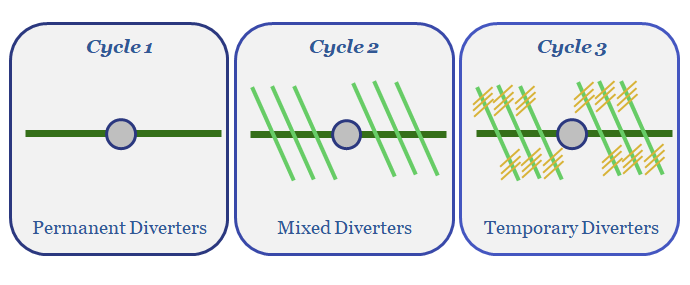
BP has patented a novel regime of fracturing fluids,which can be deployed across multiple pressurization sequences in its shale completions. The first sequence contains permanent diverting agents, introduced to create bi-wing and large fractures, then flowed back. The second fluid contains temporary, near-field diverting agents, which will dissolve in situ, usually within 24-72 hours, to expand the fracture network. Similarly, the third fluid contains temporary, far-field diverting agents.
The purpose of this completion design is to create dendritic fracture geometries. The diverting agents prevent fracturing fluids from leaking into the formation, so that primary, then secondary, then tertiary fracture networks can be created independently, each improving reservoir fluid conductivity (chart below).
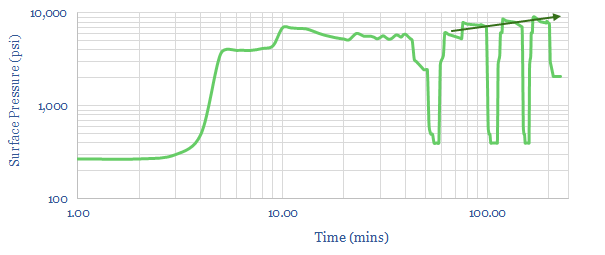
The approach is data-driven. The formation of new fractures, with increasingly dendritic geometries, can be inferred from a linear slope between instantaneous shut in pressures on successive pressurization cycles. The fracturing fluids’ composition is also said to be determined based on Instantaneous Shut in Pressures, in-situ stress calculations and flowback volumes.
The permanent diverting agents may comprise mesh proppant, walnut hulls, large grain size proppants or particulates, such as polylactic acid, benzoic acid flakes, rock salt, calcium carbonate pellets. Small mesh size is envisaged (40-70 to 100 mesh), with low concentrations (0-0.1 lb/gal) to mitigate the risk of screen-outs.
The temporary diverting agents are not specifically disclosed in the patent, but are intended to dissolve in response to temperature, salinity, pH or other parameters. They may be pumped alongside proppant or standalone.
The patent is increasing evidence that Oil Majors are now innovating at the cutting edge of shale, in order to drive productivities higher. For a review of which companies screen as having the most advanced shale technologies, from the patent literature, please see our recent note, Patent Leaders.
Source: Montgomery, R., Hines, C. & Reyna, A. (2018). Hydraulic Fracturing Systems and Methods. BP Patent US2018202274
Pioneer Natural Resources is improvingthe accuracy of its Midland basin depth-models by up to 40%, using a machine-learning algorithm to re-calibrate its seismic from well logs. Faster drilling and better production rates should follow.
[restrict]
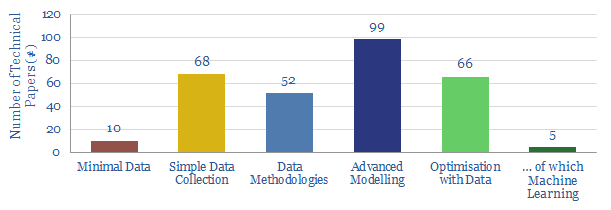
Pioneer Natural Resources has patented a new methodology in 2018, to calibrate its seismic images in the Permian, with reference to its well-logs. Ordinarily this task would be challenging and time-intensive. But the new algorithm employs machine-learning. This places it at the cutting edge of Permian data-science, where just 2% of technical papers have used ML in the past year (chart below).
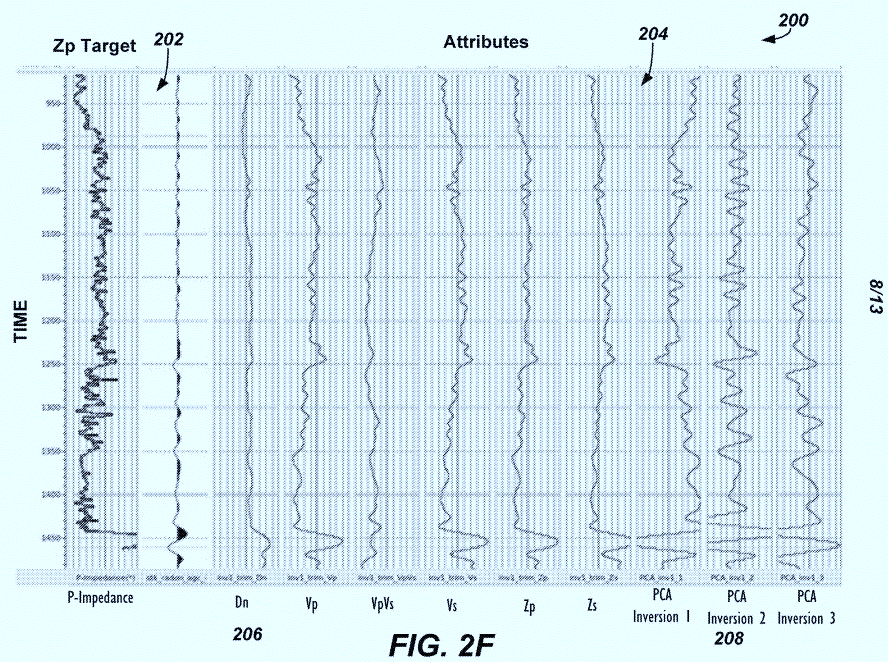
Specifically, a multi-layer neural network model iteratively improves the estimates of key seismic parameters from the log data (e.g., impedance, sonic velocity, Young’s modulus, Poisson’s ratio) (chart below). This algorithm improves the vertical accuracy of seismic interpretations by up to 40%.
The neural network creates different inversion volume estimates (208) from the well logs (202) and their attributes (204)
Improved well-placement and geo-steering. The patent cites how “reflectors that were previously unmappable on conventional seismic data can be mapped so horizontal wells can be more accurately placed”. This will be used to target wells into larger-capacity reservoirs and to inform well completion parameters.
Improved drilling-times. The company also cited a need to avoid drilling through carbonate debris flows in the Midland basin. They are excessively hard, damage drill-bits and lead to costly ‘trips’. Instead, it is intended to use the better-calibrated seismic to steer well-paths through brittle organic facies. Thus, we expect the innovation to lower costs and improve well-economics
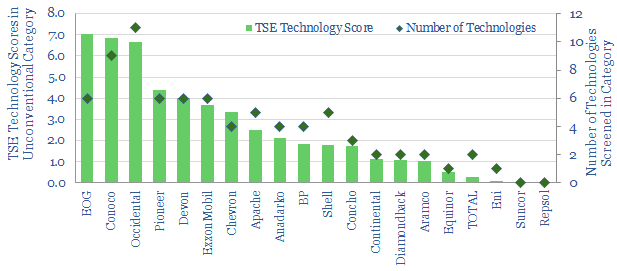
Pioneer screens as one of the top quartile operators, across all the technologies we have diligenced so far (chart below). Although, please note, we are still “early” in our project to categorize who has the best technologies in oil and gas.
If you would like to read our latest deep-dive note on shale-technology it is linked here. The full database, covering all 300 technical papers is available here.
Patent Source: Meek, R., (2018). High Resolution Seismic Data Derived from Pre-Stack Inversion and Machine Learning. Pioneer Natural Resources USA, patent WO2018201114
[/restrict]
Cookies?
This website uses necessary cookies. Our cookies are simply to improve your experience. We do not undertake any advertising or targeting via our cookies. By clicking 'accept' or continuing to use the website, you consent to our use of cookies.AcceptRead More
Privacy & Cookies Policy
Privacy Overview
This website uses cookies to improve your experience while you navigate through the website. Out of these, the cookies that are categorized as necessary are stored on your browser as they are essential for the working of basic functionalities of the website. We also use third-party cookies that help us analyze and understand how you use this website. These cookies will be stored in your browser only with your consent. You also have the option to opt-out of these cookies. But opting out of some of these cookies may affect your browsing experience.
Necessary cookies are absolutely essential for the website to function properly. This category only includes cookies that ensures basic functionalities and security features of the website. These cookies do not store any personal information.
Any cookies that may not be particularly necessary for the website to function and is used specifically to collect user personal data via analytics, ads, other embedded contents are termed as non-necessary cookies. It is mandatory to procure user consent prior to running these cookies on your website.