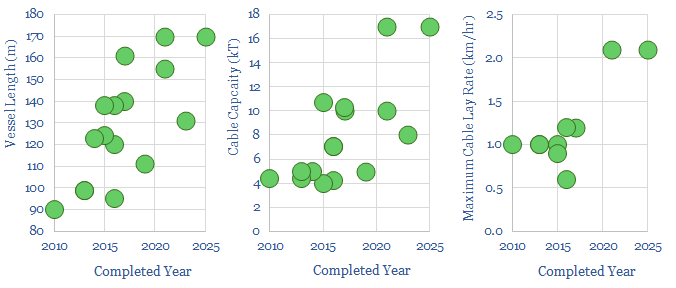
This is a database of cable installation vessels for offshore wind and power transmission; tabulating costs (in $M), contract awards (in $/km), capacity (in tons), installation speeds (in meters per hour), power ratings (in MW), crew sizes, positioning systems and leading companies. But there is a paradox in the past decade’s cost data?
The paradox is that the world’s fleet of offshore cable installation vessels have become ever more sophisticated over time, and yet the costs of offshore cable laying do not appear to have risen to reward this build-out?
For example, at the cutting edge, Prysmian’s Leonardo Da Vinci vessel cost around $200M to build, has 21MW of total power, 180 tons of lifting capacity, and thus can lay a staggering 2.1 km of cables per hour, in water depths up to 3,000 meters, with ultra-redundant DP3 positioning. Similarly, Van Oord’s new Calypso vessel will be able to lay two cables at once.
Generally these cutting edge vessels also boast improved environmental performance, with less CO2, NOx, hybridization or readiness to run on biofuels. The details are noted in the data-file, vessel by vessel.
By contrast, many of the cable laying vessels built a decade ago only had 7-8MW of total power on average, 110 tons of lifting capacity, maximum lay rates of 1km of cables per hour, in water depths up to 800m, with DP2 positioning. So the industry has truly transformed its capabilities.
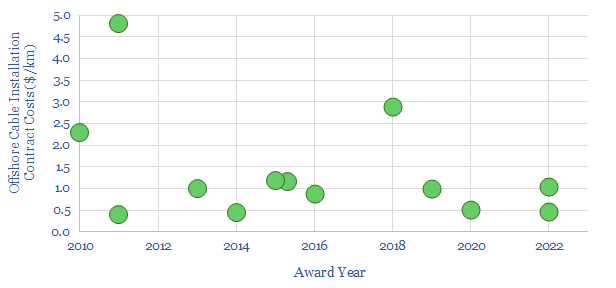
And yet the contract awards that we have aggregated for offshore cable installation have hardly changed. Laying the inter-cabling at an offshore wind project might cost $0.5M/km, offshore interconnectors (such as HVDCs) cost $1-2M/km, and complex projects with erratic seabed terrain cost as much as $3-5M/km.
Is it possible that attempts to accelerate offshore wind and renewables more broadly will pull on the supply chain for cable installation vessels, and rescue what has thus been a relatively challenging industry? If our energy supply-demand numbers are right, there could even be another offshore cycle in the conventional energy industry?
The full database of cable installation vessels covers assets owned by Prysmian, Van Oord, Nexans, Deme, NKT, Jan de Nul, Seaway, Boskalis et al; and contracts whose details have made it into the public domain.
Electrification is the largest, most overlooked, most misunderstood part of the energy transition. Hence this 10-page note aims to explain the upside, simply and clearly. Electricity rises from 40% of total useful energy today to 60% by 2050. Within the next decade, this adds $2trn to the enterprise value of capital goods companies in power grids and power electronics.
Pachama is a nature-based technology company, which has raised $79M, to create a portal where buyers can choose “from rigorously vetted forest restoration and conservation projects”, which in turn are tracked using proprietary AI. This data-file is a Pachama CO2 offset review. We have assessed the portfolio, some challenges and our own experiences, via our usual framework for assessing nature-based CO2 removals.
As of November-2022, the majority of projects available on Pachama’s portal are avoided emissions projects. These are excellent conservation projects, accredited by VERRA, protecting vulnerable eco-systems, and achieving some of the highest biodiversity scores of any projects that have crossed our screens.
However, it remains debatable whether these projects can be considered to be “offsetting CO2”. CO2 credits are not being awarded for pulling additional CO2 out of the sky and storing it in a natural eco-system, as per other CO2 removal projects that we have assessed.
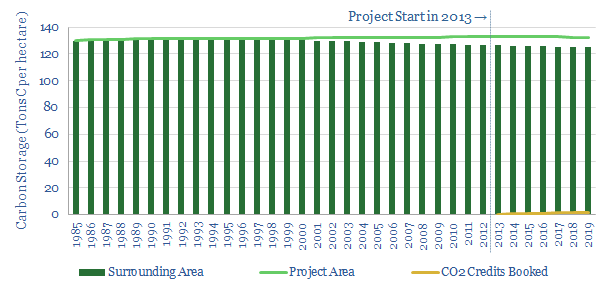
Rather, CO2 offsets are being issued relative to a hypothetical scenario where a protected forest is deforested at a rate of 1-2% per year (varies by project) over the next 20-70 years (chart below).
We think that over time, Pachama would like to seed new forests, and more incremental projects on its platform, but for now there is limited depth in the nature-based CO2 market, and most of the certified CO2 offset projects are REDD (conservation) projects.
In one of the largest CO2 offset projects in the Pachama portfolio today, CO2 offsets are issued relative to a scenario whether a carbon-dense, 26-000 year old peatland is drained and thus caused to release c500MT of CO2. Blue carbon eco-systems can store a lot of carbon, over 1,000 tons/hectare, possibly over 2,000 tons/hectare. But 500MT is a truly enormous number. It is equivalent to the direct annual emissions of the entire global fertilizer industry per our CO2 breakdown. This raises some question marks.
It gets a bit philosophical, but in our view, carbon “offsetting” should be about cancelling out the net impacts of emitting +X tons of unavoidable CO2 into the atmosphere by pulling out -X tons of CO2 from the atmosphere and sequestering it over the long-term. Not by avoiding a further +X tons of emissions. (Morally, you cannot atone for a murder by enumerating the list of people you have not murdered !!).
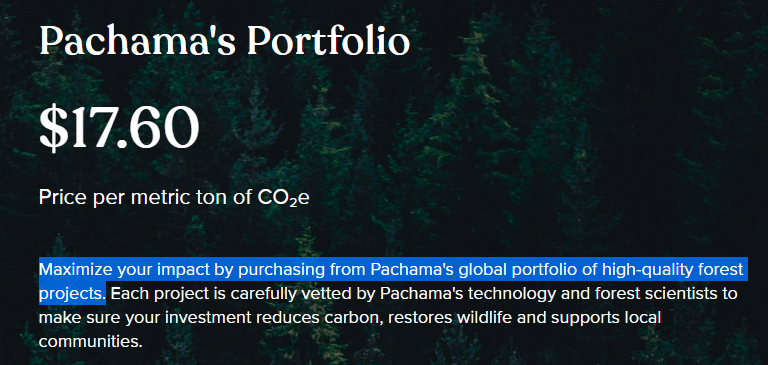
We want to support conservation of nature, and high-quality organizations in nature-based solutions; and so we allocated $700 to offset 40 tons of CO2 from the Pachama portfolio at the current price of $17.6/ton. However, our overall experience was somewhat disappointing: per the Pachama website, we thought we were buying from “Pachama’s global portfolio of high-quality forest projects” (screenshot above). But after making the purchase, all of our purchase ended up allocated to the single, large peat conservation project, described above.
Further details on our Pachama CO2 offset review are in the data-file. We have also appraised other CO2 removal projects using the same framework.
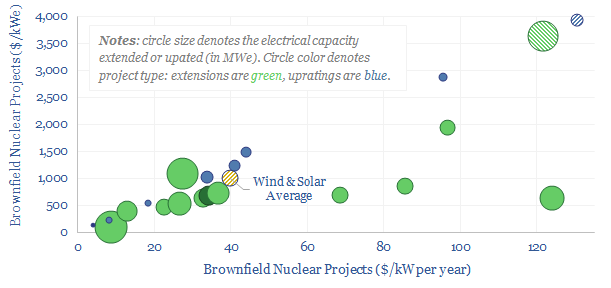
What are the costs of nuclear life extensions and capacity upratings? This data-file has reviewed 25 examples, from past projects and technical papers. The average nuclear life extension costs around $650/kW to extend a nuclear plant’s life by 20-years, or around $30/kW-year.
These cost estimates are interestingas extending the life of a new nuclear plant costs around 80-90% less than constructing a new one. It also costs around 25-50% less than constructing new wind and solar, using a rounded $1,000/kWe ballpark.
Increasing the capacity of a nuclear plant costs an average of $1,250 per kWe of added capacity. Again, this is 60-80% less than the costs of constructing a new nuclear plant from scratch.
However the numbers are extremely variable and range from c$100/kW at the simplest projects, for example, fitting new instrumentation to optimize water-flow through an existing reactor; through to $4,000/kW at major projects that effectively re-build an entire reactor, piece-by-piece.
Our outlook for nuclearis that life extensions will become much more prevalent. Effectively, shutdowns are likely to stall in the 2020s, resulting in a nuclear CAGR of at least 3% through 2030 and 2.5x ramp through 2050. A nuclear renaissance is clearly helpful for energy transition and resolving energy shortages.
Implications are constructivefor nuclear and for large-scale EPC companies. Companies that have delivered past life extension projects in the nuclear industry include Bechtel, SNC Lavalin, Black and McDonald, Jacobs, GE, Westinghouse.
The data-file covers 25 nuclear life extensions and capacity upratings, their costs, and a concise summary of project details. Projects are featured from the US, Canada, Mexico, Europe, Japan and South Africa.
The chemical element silicon makes up 28% of the Earth’s crust, second only to oxygen. It is found naturally in the form of silica sand. In turn, highly pure silica sand, with well over 95% SiO2 content and less than 0.6% iron oxide, is an important resource used in making glass, metal foundries, “proppant” for hydraulic fracturing in the oil and gas industry and making high-grade silicon (for chips and PV silicon). The market is 350MTpa. This data-file is a screen of the world’s largest silica sand companies.
Silica mining and processing has been a challenging business in the recent past. Many companies have been loss-making. Otherwise, ROCE’s have been low, at 6-7% for the industry’s largest producer, and there have also been some high-profile bankruptcies and re-structurings. On the other hand it is challenging businesses that can enjoy the greatest changes of fortune.
Does the outlook get more interesting in the energy transition? Our solar outlook requires an additional 20-30MTpa of specialty glasses (bill of materials here), which comprise 50% of the mass of a solar panel. Our wind outlook requires another 1-2MTpa of glass fibers, which comprise 50% of a wind turbine blade (bill of materials here). In the interim, the world is short of conventional energy, under-investing in long-cycle oil projects, and thus likely to re-accelerate short-cycle shale, particularly important for the US sand market (a typical shale well uses 15-25kT of sand).
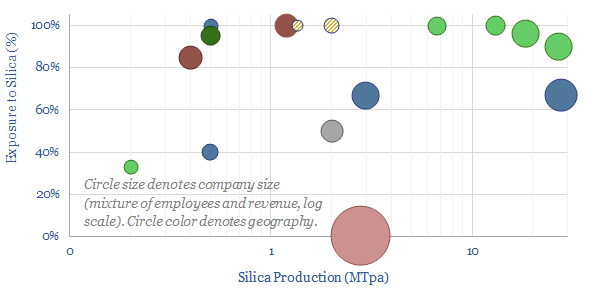
Leading silica sand producing companies are profiled in this data-file. They range from Junior miners developing new silica resources to a division of Mitsubishi, that produces almost 3MTpa from one of the highest silica mines in the world at Cape Flattery, Australia, with 99.9% purity and 0.01% Fe2O3. In our view, one of the most interesting businesses is listed in the US, with around $1bn market cap at the time of writing, plus a large and well diversified footprint.
The data-file is a screen of the largest silica sand companies, covering over 100MTpa of silica sand production, across 16 companies in 11 countries. There are both public companies and private companies. For each silica sand producer, we have estimated its size, employee count, revenues, exposures to silica sand, and tabulated some notes. Energy intensity of silica sand production is usually around 80kWh/ton and CO2 intensity is around 20kg/ton, which cascades through to products made using sand as an input material.
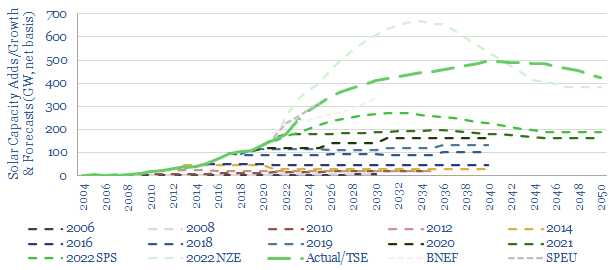
Forecasts for future solar growth have an unsatisfyingly uncertain range, varying by 3x. Hence this 15-page note discusses the future of solar. Solar capacity additions likely accelerate 3.5x by 2030 and 5x by 2040. But this creates bottlenecks, including for seven materials; and requires >$1trn pa of additional power grid capex plus $1trn pa of power electronics capex.
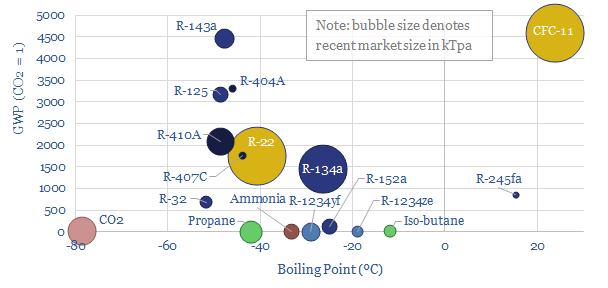
What chemicals are used as refrigerants? This data-file is a breakdown of the c1MTpa market for refrigerants, across refrigerators, air conditioners, in vehicles, industrial chillers, and increasingly, heat pumps. The market is shifting rapidly towards lower-carbon chemicals, including HFOs, propane, iso-butane and even CO2 itself. We still see fluorinated chemicals markets tightening.
Refrigerants are used for cooling. The thermodynamic principle is that these chemicals have low boiling points (averaging around -30ºC). They absorb heat from their surroundings as they evaporate. Then later these vapors are re-liquefied using a compressor.
The global market includes over 1MTpa of refrigerants, for use in refrigerators (around 100 grams per fridge), passenger cars (1 kg per vehicle) and home AC systems (4 kg per home). There is also an industrial heating-cooling industry, including MW-scale chillers that might contain 400kg of refrigerants, to large global LNG plants.
The market is growing. Structurally, heat pumps could add another 4kg of refrigerant demand per household, especially in markets such as Europe with traditionally low penetration of AC. Rapid rises are also occurring in global AC demand.
From the 1930s onwards, CFCs were used as refrigerants. But CFCs are inert enough to reach the middle of the stratosphere, where they are broken down by UV radiation, releasing chlorine radicals. These chlorine radicals break down ozone (O3 into O2). Hence by the 1980s, abnormally low ozone concentrations were observed over the South Pole. Ozone depletion elevates the amount of UV-B radiation reaching Earth, increasing skin cancer and impacting agriculture. And hence CFCs were phased out under the Montreal Protocol of 1989.
CFCs were largely replaced with fluorocarbons, which do not deplete the ozone layer, but do have very high global warming potentials. For example, R-134a, which is tetrafluoroethane, is a 1,430x more potent greenhouse gas than CO2.
The Kigali Amendmentwas signed by UN Member States in 1989, and commits to phase down high-GWP HFCs by 85% by 2036. This has been supplemented by F-gas regulation in the EU and the AIM Act in the US. High GWP fluorocarbons are effectively banned in new vehicles and stationary applications in the developed world.
In addition, there has long been a market for non-fluorinated chemicals as refrigerants, but the challenge with these alternatives is that they tend to be flammable. Over half of domestic refrigerators use iso-butane as their refrigerant, which is permissible under building codes because each unit only contains about 100 grams of refrigerant (e.g., in Europe, a safety limit has historically been set at around 150 grams of flammable materials in residential properties, and is being revised upwards).
So what outlook for the fluorinated chemicals industry? Overall, we think demand will grow mildly. It is true that regulation is tightening, and phasing out fluorocarbons.
However, some of the leading refrigerants that are being “phased in” as replacement actually use more fluorinated chemicals than the refrigerants they are replacing…
Hydrofluoroolefins (HFOs) have no ozone depleting potential and GWPs <10. As an example, R-1234yf is now used in over 100M vehicles, and comprises 67% fluorine by mass. This is an increase from the 44% fluorine content in R-22, which was the previous incumbent for vehicle AC systems.
Impacts of electric vehicles? You could also argue that EVs will have increasing total refrigerant demand, as there are in-built cooling systems for many fast-chargers.
Using CO2 as a refrigerant could also be an interesting niche. It is clearly helpful for our energy transition ambition to increase the value in capturing and using CO2. But the challenging is that even if 215M annual refrigerator sales all used 100% CO2 as their refrigerant, this would only “utilize” around 25kTpa of CO2, whereas our Roadmap to Net Zero is looking for multi-GTpa scale CCUS.
For heat pumps, we think manufacturers are going to use propane, CO2, HFOs and a small class of low-GWP fluoro-carbons. So there is a small pull on the fluorinated chemicals value chain from the ramp-up of heat pumps. But the main pull on the fluorinated chemicals chain is going to be coming from batteries and solar, as explored in our recent fluorinated polymers research.
Leading Western companies making refrigerants in the data-file include Honeywell, DuPont, Chemours, Arkema, Linde, and others in our fluorinated chemicals screen.
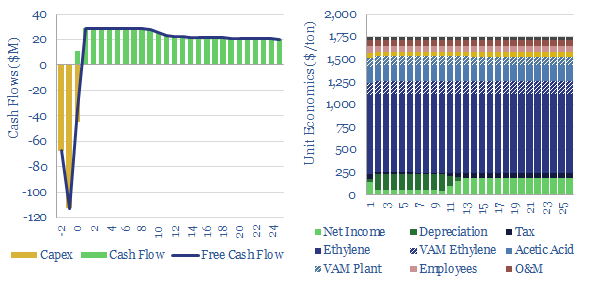
Ethylene vinyl acetate is produced by reacting ethylene with vinyl acetate monomer. This data-file estimates ethylene vinyl acetate production costs, with a marginal cost between $1,500-2,000/ton, and a total embedded CO2 intensity of 3.0 tons/ton. EVA comprises around 5% of the mass of a solar panel and could be an important solar bottleneck.
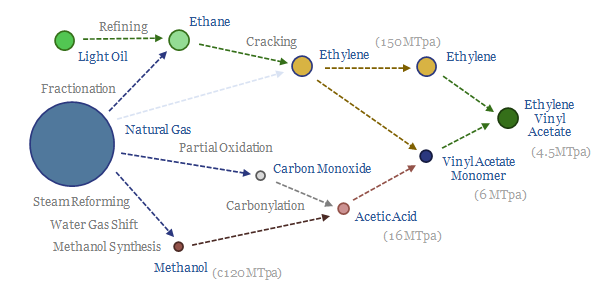
Ethylene vinyl acetate production occurs via the relatively complex pathway shown below. Natural gas liquids are fractionated into ethane. Ethane is cracked into ethylene. Natural gas is also converted into methanol. Then carbonylated with CO to form acetic acid. Acetic acid and ethylene react into vinyl acetate monomer. Ethylene and VAM are then co-polymerized into EVA. Yikes.
The key input that drives production costs of ethylene vinyl acetate is the price of ethylene. Ethylene is used both to make vinyl acetate monomer (reacting with acetic acid, in turn derived from the carbonylation of methanol) and as co-polymer in EVA itself.
As a rule of thumb, a $0.1/gal increase in the price of ethane (from our base case of $0.3/gallon) results in a $100/ton increase in the marginal cost of ethylene, which in turn results in a $100/ton increase in the cost of EVA. Hence there could be a “push” on prices from under-investment in conventional energy or in US shale.
The larger “pull” on prices is likely to come from the rapid scale-up of solar. The EVA market is relatively small, around 4.5MTpa in 2021. Whereas we think the ultimate solar demand for EVA will ramp up to 1.5-2.5MTpa (please see our solar bill of materials).
If EVA becomes a bottleneck, then solar manufacturers will have to outbid other customers for product. Another complexity is that not all EVA is inter-changeable. The solar industry uses a specialized product.
Leading EVA producers include Hanwha-TOTAL, ExxonMobil, Wacker and China’s Lianhong Xinke. Other names are noted in the data-file.
This data-file contains background notes, approximated estimates for ethylene vinyl acetate production costs, and approximated cost estimates for the underlying production of vinyl acetate monomer. We have tabulated capex costs from recent projects to inform our estimates.
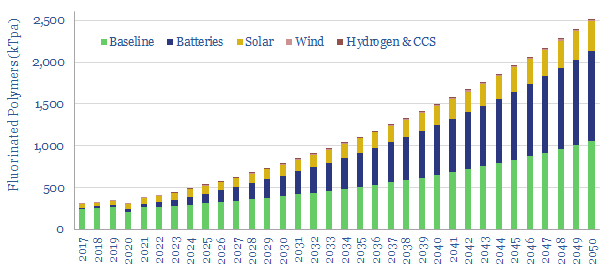
Fluorinated polymers are a ‘stealth bottleneck’ for the energy transition: used in solar back-sheets, battery binders/separators, wind blades, and across the hydrogen chain. But low down the bill of materials, they are easily overlooked. This 400kTpa market grows 6x by 2050. Rising 2021 margins already suggest tightness. And the ‘CO2 curve’ is steeper than any other material. So Western companies must scale up? Who benefits?
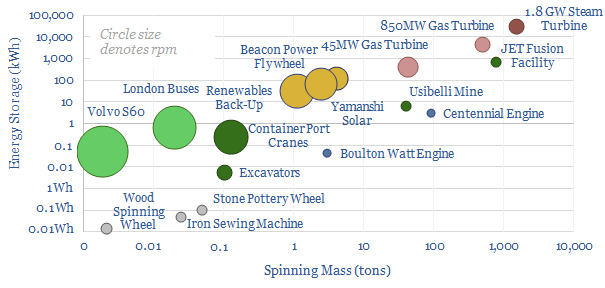
This data-file calculates the energy stored in rotating masses. This includes 50Wh – 100 kWh flywheels. In power grids, the angular momentum of large rotating generators is known as ‘inertia’ and can run to 30kWh to 30MWH per turbine. Inertia has historically been a crucial part of stabilizing grids. And the world’s “original” energy storage device. Hence how do the physics work? And how is the energy of a rotating object calculated?
Rotational energy: how do the mechanical physics work?
Linear motion. Newton’s Second Law, familiarly, tells us that F = ma, for linear acceleration a. And by extension, the kinetic energy of a moving object E = ½ m(V^2). Where E = energy (Joules), m = mass (kg) and v = velocity (meters/second).
The same laws can be adapted for rotational acceleration, stating that F = Iα. And by extension, the kinetic energy of a rotating object E = ½ I (ω^2) where ω is rotational velocity. And α is angular acceleration, the rotund cousin of linear acceleration, a. E = energy (Joules), I is the ‘moment of inertia’ around the axis of rotation (in kg-m2) and ω is rotational velocity (in radians per second).
These units are admittedly a bit weirder. 1 radian is 57.296°, so an angular velocity of 1 radian per second means a circular object turns by 57.296° around its axis each second. It does not matter how wide the diameter is. 1 radian per second means it will take 6.3 seconds to do a full turn.
Moment of Inertia is to rotating objects what mass is to objects that are moving in a straight line. Moment of Inertia can be captured via equations. For example: I = k M (R^2). Where I is moment of Inertia (kg-m2), M is the mass of the object (kg), R is the radius (m). Finally k is a “shape-based scalar”, which integrates the way in which the mass is distributed across different distances from the center of rotation. k depends on shape. But generally, k=0.5 for a disc or horizontal rod. k=1 for a wheel that is loaded at the rim. k = 2/5 for a solid sphere, 2/3 for a spherical shell.
All of this is calculated for you in the data-file. And for more details on converting one energy unit into another, please see our overview of energy units.
Rotational energy: the world’s original battery?
The ability of rotating objects to store and smooth energy flows has been known for around 8,000 years. Flywheels were used in the manufacture of pottery in China and Mesopotamia since 6 000 BCE.
In medieval times, the spinning wheel started displacing hand spindles from around 1,200 AD, unlocking an order of magnitude improvement in the rate of spinning wool into yarns and threads. Closer to home, the sewing machine below is in my in-laws’ house, and I have done my best not to break it…
While these small energy storage devices are useful in smoothing out the jerky motion of human arms and legs, they do not store very much energy, maybe around 0.01 to 0.1 Wh. This is due to their small size (<30cm radiuses) and slow rotation speeds (<250 rpm).
Industrial Revolution: Next Came the Steam Era !
There is nothing fundamentally different between the sewing machine shown above and the large steam turbines that defined the nineteenth century. This might sound surprising, but bear with us…
The sewing machine operator must use their internal sense of rhythm (mine clearly being very poor, from the video above!), to press down with their leg, at the exact right time to add energy into the flywheel. Cleverly, in the steam engine’s case, the timing is controlled mechanically by a series of valves that are connected to the flywheel. Steam is introduced into a chamber at one part of the cycle, its pressure builds up, then the pressure is released into a piston, to add energy into the flywheel at the exact right moment.
What clearly did change with the advent of steam engines is that a lot more energy could be stored in these giant flywheels, harvesting the thermal energy of coal, rather than the limited energy of muscles.
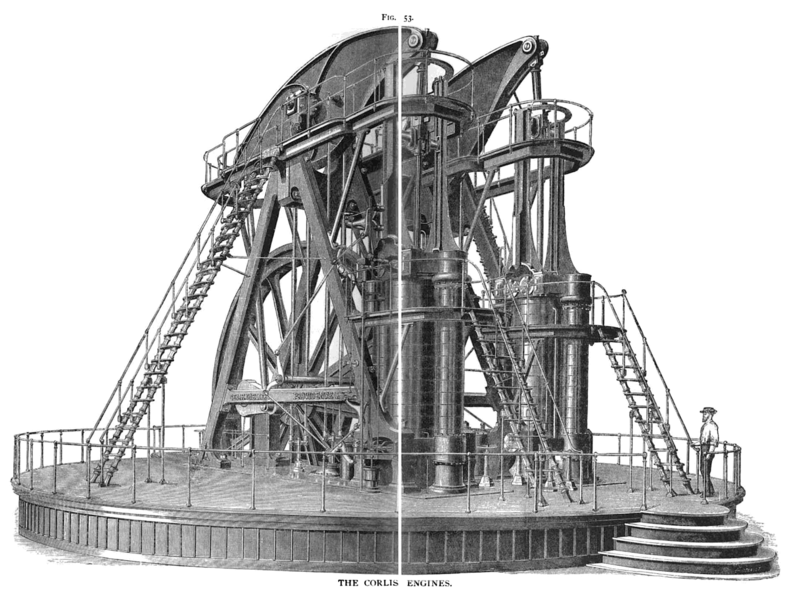
Possibly the largest steam engine ever built was the Corliss Centennial Engine, constructed for the Centennial Exposition, in Philadelphia, in 1876 and pictured below. It was quite possibly the first ever MW-scale combustion turbine, at 1,400 hp (1,045 kW). With some rough maths, we think the flywheel stored around 2-3kWh of energy, as a 9m wide iron wheel, weighing 100 tons rotated at 36 rpm.
Fast-forward: the largest rotating generators in the world?
The average nuclear plant in the grid today has 1.1 GW of capacity, the average coal plant is 400MW and the average natural gas plant is 100 MW. These are enormous numbers. And they impart an enormous amount of ‘inertia’ to grids.
The concept of inertia is all explained in our note below, which covers power generation from first principles. And if that isn’t nerdy enough, there is a whole follow-up note on the related and equally important topic of reactive power compensation.
Back to rotational energy, consider that one of the largest rotating turbines in the world is HPC’s 1,770MW Arabelle turbine. This is 7m in diameter, 17m long, weighs 4000 tons and spins at 1500 rpm. It could conceivably store almost 30 MWH of energy simply via the angular momentum of its massive rotor. This is huge for power quality and power grids.
Flywheels as a modern source of energy storage?
Flywheels can be used as an energy storage device, directly in mechanical contexts (echoing the sewing machines and spinning wheels of the past), to add inertia into power grids, or to recuperate energy that would otherwise be lost. Some interesting examples are below.
Yamanshi Solar. In 2015, Japan built the world’s largest super-conducting flywheel, to back up a 1MW solar installation. We think the flywheel has about 110kWh of rotational energy storage.
Likewise, in the US, Beacon Power has pioneered the use of flywheels for frequency regulation, with 20 MW plants located in Stephentown, New York and Hazel Township, Pennsylvania. The company is paid by the grid for providing frequency regulation as a service.
JET is the Joint European Torus Research Facility in Oxford, requiring rapid bursts of energy to test nuclear fusion. It came up in our research note in the frontiers of nuclear fusion. In order to provide the enormous bursts of energy to instigate nuclear fusion reactions, it has 2 giant flywheels. Each one is ramped up over 9-minutes using 8.8MW motors, then the system discharges 700 kWh of energy at a peak power of 500 MW.
The data-file also includes mining assets and London buses, which can recuperate up to 70% of the energy from braking or lowering a dragline under gravity, by shunting the energy into speeding up a flywheel. This might save 20-30% of the energy needed to re-accelerate the bus or raise the dragline again.
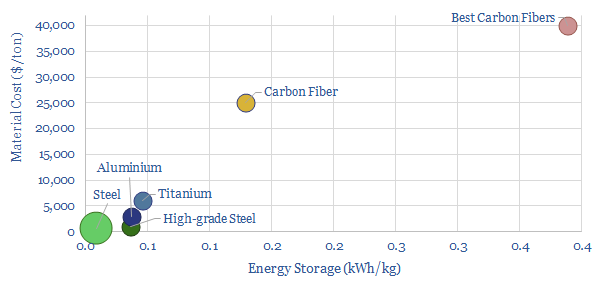
Materials matter: high-strength low-weight maximizes energy storage?
Our equations above showed that more energy is stored by a rotating object, when it rotates faster (square function), when it is heavier (linear), and when the weight is distributed further from the center of rotation (>square function).
However, there is a limit. The stress exerted on a material also rises as a square function of its rotational speed and a square function of its radius. So for example a steel disc of 1m diameter and 420 MPa of yield strength cannot be spun faster than 7,000 rpm before it is at risk of breaking.
As a result, there is also a growing movement to use high-performance materials in flywheels. Ultimately, a material such as carbon fiber can likely be spun 2-4x faster than steel wheels. While the disc cost rises linearly, the total system cost is deflated. This adds to the use of vacuum chambers and magnetically levitating bearings. The physics of flywheels are interesting. Please download the data-file for more.
Cookies?
This website uses necessary cookies. Our cookies are simply to improve your experience. We do not undertake any advertising or targeting via our cookies. By clicking 'accept' or continuing to use the website, you consent to our use of cookies.AcceptRead More
Privacy & Cookies Policy
Privacy Overview
This website uses cookies to improve your experience while you navigate through the website. Out of these, the cookies that are categorized as necessary are stored on your browser as they are essential for the working of basic functionalities of the website. We also use third-party cookies that help us analyze and understand how you use this website. These cookies will be stored in your browser only with your consent. You also have the option to opt-out of these cookies. But opting out of some of these cookies may affect your browsing experience.
Necessary cookies are absolutely essential for the website to function properly. This category only includes cookies that ensures basic functionalities and security features of the website. These cookies do not store any personal information.
Any cookies that may not be particularly necessary for the website to function and is used specifically to collect user personal data via analytics, ads, other embedded contents are termed as non-necessary cookies. It is mandatory to procure user consent prior to running these cookies on your website.