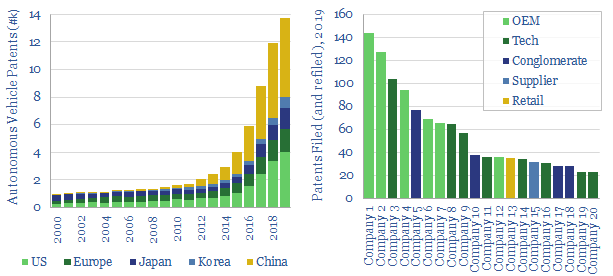
This data-file quantifies the number of patents filed into autonomous vehicles, by year, by geography and by patent family, looking across 37,000 patent filings since the year 2000. Patent activity for the technology developing autonomous vehicles has risen at a 27% CAGR over the past decade, indicating a rapid pace of research activity.
The leading patent filersare ranked, including some of the world’s leading automotive companies, tech companies and retail companies. It is interesting to compare the relative activity levels among companies such as Denso, MobilEye, TuSimple, Uber, Waymo and Zoox (recently acquired by Amazon), versus Ford, GM, Honda, Toyota, Volvo et al.
Our notes and a data-pull of all the underlying 2019 patents follow. We find autonomous vehicles could entrench a 10% acceleration in road travel post-COVID, and displace c15% of all air-miles on sub-1,000 mile journeys.
Key findings on patent activity for technology developing autonomous vehicles and most active OEMs are listed in the article sent out to our distribution list here.
Coal-to-gas switching halves the CO2 emissions per unit of primary energy. This data-file estimates the CO2 abatement cost. Gas is often more expensive than coal. But as a rule of thumb, a $30-60/ton CO2 price makes $6-8/mcf gas competitive with $60-80/ton coal. CO2 abatement costs are materially lower in the US and after reflecting efficiency. Commodity price volatility in 2022 does not change long-term abatement costs.
Introduction: why do combustion fuels feature in the energy system?
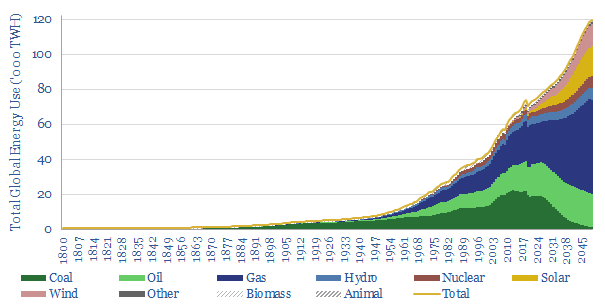
Coal versus gas in the world’s energy system? The year is 2021. The global economy has been slowly recovering from COVID. Total useful energy consumption across all human civilization is running just above 70,000 TWH per year (model here). 26% of that total comes from burning 7.8 bn tons of coal, releasing 19GTpa of CO2, almost 40% of total global CO2 emissions. Conversely, around 33% of the world’s total useful energy comes from burning 390 bcfd of gas, releasing 9GTpa of CO2, or around 18% of total global CO2. These numbers are remarkable in themselves.
But if you simply do the numbers on supply and demand, 65% of the world’s useful energy in 2050 is still going to come from burning some kind of combustion fuel. So which fuel is most pragmatic, and how do we minimize the costs of the energy transition?
What is the CO2 intensity of coal versus gas?
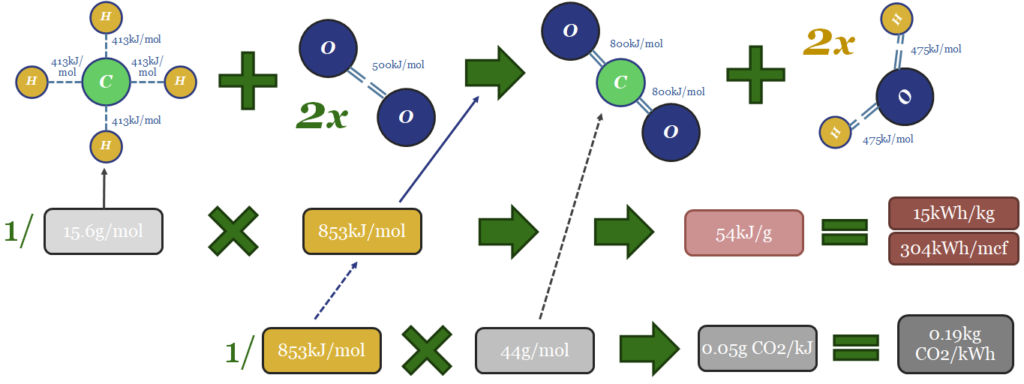
Gas is a 50% lower-carbon combustion fuel than coal. The reason is that 54% of all the energy in the methane molecule (CH4) comes from the hydrogen atoms, which combust into innocuous water vapor.
Hydrogen atoms are 12x lighter than carbon atoms. Thus burning 1 ton of natural gas (CH4) releases 2x more energy than burning 1 ton of pure carbon (C), in the form of the world’s purest petcokes and anthracites.
Stated another way, CO2 intensity is around 0.18 kg/kWh-th when combusting natural gas and around 0.37 kg/kWh-th when combusting coal. You can explore these numbers further by delving into the chemistry of bond enthalpies.
Historical costs of coal-to-gas switching?
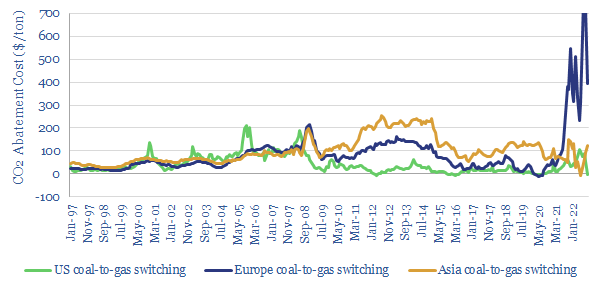
Switching coal for gas is most likely going to halve CO2 intensity per unit of energy, when combustion fuels are needed in the energy system. But what is the cost? The first way to answer this question is to turn to history, which we have aggregated in this data-file (chart below, updated through YE23 in the data-file).
The most relevant numbers on the chart above come from Europe and the US during the relatively stable decade from 2010-2019.
In the US, the price of delivered coal averaged $43/ton over the 2010-2019 timeframe, according to data from the EIA, which translates into a ridiculously cheap 0.7 c/kWh of thermal energy (kWh-th). Over the same timeframe, the average price of natural gas was $3.3/mcf, which translates into 1.1 c/kWh-th. Thus the excess cost of natural gas was around 0.4 c/kWh-th. Directly substituting coal fuel for gas fuel therefore incurred a cost of $20/ton of CO2 that was ‘avoided’. This is low on our CO2 abatement cost curve.
In Europe, the price of imported coal averaged $87/ton over the 2010-2019 timeframe, which translates into 1.2 c/kWh-th. The price of gas averaged $8.2/mcf, which translates into 2.7c/kWh-th. Thus the premium for natural gas was around 1.5c/kWh-th. Directly substituting coal fuel for gas fuel therefore incurred a cost of $80/ton of CO2 that was avoided.
In Japan, for completeness, the price of imported gas was higher than in Europe, at $12.2/mcf in 2010-19, resulting in a coal-to-gas switching cost of $150/ton of CO2 avoided. This was due to distorting impacts of the Fukushima nuclear disaster, which suddenly shut down 300 TWHpa of Japanese nuclear capacity (overview here), whose direct replacement with gas would have required the equivalent of 40MTpa of LNG imports, over 10% of overnight tightening in global LNG market.
Philosophical problem #1: historical volatility?
Commodity prices volatility raises a philosophical problem for assessing the CO2 abatement costs (or “green premiums”) of replacing one type of fuel with another. Historical prices are volatile. They vary vastly. Thus our ‘switching costs’ are apparently changing all the time.
2022 has been a sobering reminder of volatility, as European gas prices spiked to $70/mcf in August-2022, at which time, the ‘CO2 abatement cost’ for replacing coal with gas spiked to $1,000/ton of CO2 avoided. But this is clearly not a good long-term basis for generalization. The medium-term future is more important than the recent past.
Beware of over-generalizing in strange times. In my teenage years, I was a keen cross-country runner. Keen but not brilliant. I never quite figured out how to ‘pace myself’ so that I had enough energy to sprint the final stretch. I would often come in the “top five” of regional meets. There were always one or two runners, at other schools, who would outpace me, as we traversed the fields and forests of the Greater London Area. But I did actually win a race on precisely one occasion. After an outbreak of norovirus at a rival school!! In that precise moment, it might have been tempting to declare myself “the fastest teenager in the Greater London Area”. But sadly, by the next week, I was back to fourth or fifth place.
In a similar vein, it seems unfair to under-invest in gas for a decade, see gas markets fall into deep under-supply as a result of that under-investment, see prices spike to record levels in 2022; and then criticize “gas is too expensive to be a decarbonization fuel”. It is expensive because of historical under-investment, which has also allowed Russia to weaponize its supplies. Effectively, 2022 is the “gas industry with norovirus”.
For at least one runner, this is not going to be the “best race” to exemplify their 3,000-meter time.
If you think about how supply-demand dynamics work, then the more gas you build, then the lower the future CO2 abatement cost of coal-to-gas switching will be. Whereas the less gas you build, and the more under-supplied gas markets are, then the higher the CO2 abatement cost of coal-to-gas switching will be. The outcome is path-dependent!
What future-minded decision-makers should care about is go-forwards costs. In other words, what is the medium-long term outlook, if you are deploying new capital, with a multi-decade time horizon?
Go forwards: what CO2 abatement costs from switching coal to gas?
On a go forward basis, the US can likely ramp from 90bcfd of gas production in 2021 to 130-150bcfd of gas production by mid-late decade (model here). The marginal hub-level cost to ramp US shale gas is $2-3/mcf (model here).
Thus if coal costs $40-60/ton, the CO2 abatement cost for switching coal to gas is effectively zero in the US (download this data-file to stress test). Replacing coal with gas halves CO2 and adds almost no primary energy cost.
This is why US coal production has already fallen from 1 GTpa in 2000-2008 to 500MTpa in 2021 (model here). US CO2 emissions have fallen from 6.8 GTpa to 5.8GTpa over the same timeframe, of which 65% is directly due to coal-to-gas switching.
If future European coal prices average $60/ton, then the extra cost of switching coal to gas would be $90/ton of CO2 saved. If future European coal prices average $90/ton, then the extra cost of switching coal to gas would be $60/ton of CO2 that is saved.
This is all on a primary energy basis, in kWh of thermal energy. But we can achieve better numbers by considering the market on a useful energy basis (for more on the difference between primary energy and useful energy, see our energy efficiency overview).
Philosophical problem #2: useful energy versus primary energy?
The primary energy numbers quoted above are almost certainly too conservative for gas and too generous for coal. The reason is that the energy efficiency factor will almost certainly be higher for gas than coal. In other words, to produce each kWh of useful energy requires less primary gas energy than primary coal energy.
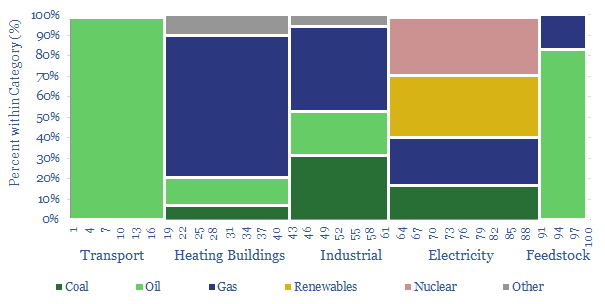
Heating buildings comprises a staggering 25% of all useful energy consumption in Europe (chart below, data here). Now consider some options: A home might have a gas boiler, which is over 90% efficient, in converting the thermal energy from natural gas into heat. Quite high. But very few buildings in Europe or the US have coal furnaces. If you are relying on coal to heat buildings, it is likely by burning the coal in a 40-45% efficient power plant (model here), then transmitting the electricity via a 93% efficient power grid, then using the electricity in a >95% efficient electric heater. So overall, the gas value chain is over 2x more efficient. And the CO2 abatement cost of gas versus coal is zero. Or below zero. Switching back to coal, due to a shortage of gas, adds cost.
For electricity generation our base case assumptions is that the average modern gas turbine will achieve 57% electrical conversion efficiency, while the average modern coal-fired power plant likely achieves 42% efficiency. Thus, on a pure ‘spark spread’ basis, Europe likely needs a CO2 price of $35/ton to incentivize running an existing gas-fired power plant at $8/mcf gas, rather than running an existing coal-fired power plant at $75/ton coal.
Philosophical problem #3: context and ranges?
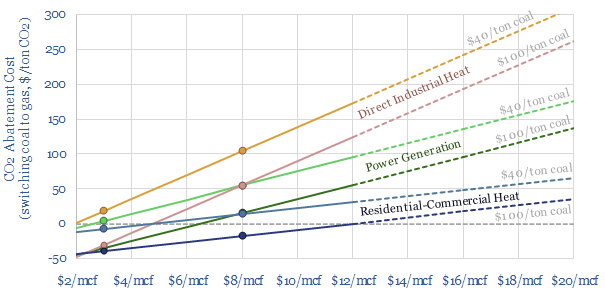
Coal-to-gas switching halves CO2 emissions per unit of primary energy. As a global rule of thumb, a $30-60/ton CO2 price makes $6-8/mcf gas competitive with $60-80/ton coal. While in North America, and in many specific contexts, the CO2 abatements costs can be less than zero.
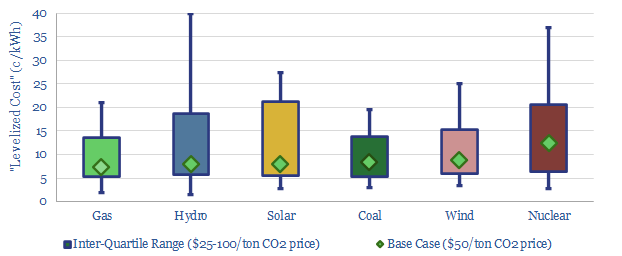
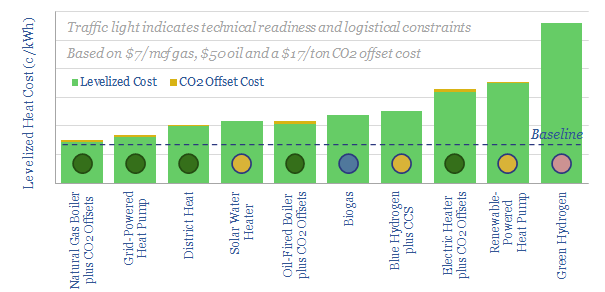
Broad numerical ranges are not very satisfying. But we think they are more appropriate than overly-precise point estimates, given the wide variations in context (for a good discussion, we have recently written up why we ‘hate’ levelized costs, chart below).
The complexity of the counterfactuals for coal-to-gas switching are genuinely interesting. For example, if we have a chemicals or manufacturing plant in coal-consuming Germany or China, should we be modelling the costs of supplying gas to that plant; or shutting it down, and re-locating its output to a gas-rich nation, such as the US or Middle East? (note here). Does the new investment require new costly infrastructure or deflate unit costs for pre-existing infrastructure? (note here). The real world is more complicated than our spreadsheets.
Please download this data-file to stress test some simple relative costs of coal-to-gas switching. The model contains a simple calculator, where you can input gas prices, coal prices, CO2 prices and efficiency factors. It contains historical data on the CO2 abatement costs of coal-to-gas switching in the US, Europe and Asia. And it contains a more elaborate model of full-cycle power generation using coal versus using gas.
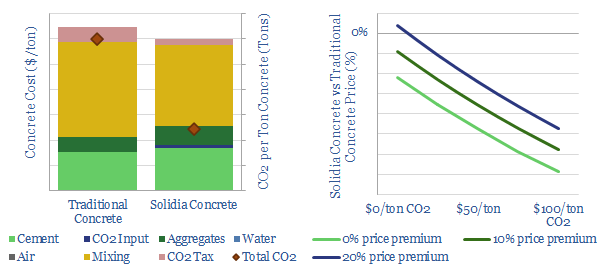
CO2-cured concrete has c60% lower emissions than traditional concrete, which is the most widely used construction material on the planet, comprising 4bn tons of annual CO2 emissions, or 8% of the global total. This data-file assesses Solidia CO2-cured concrete.
This data-file profiles Solidia’s industry-redefining product — CO2-cured cement — based on an impressive array of 38 patents. We model the production costs, CO2 costs and full-cycle economics; then size the addressable market and outline our notes and patent data.
A rapid scale-up is now underway. We see realistic medium-term CO2 savings of 10MTpa in the US and 300MTpa globally.
A CO2 price would further enable cost-competitive pricing, even after earning a 10-20% pricing premium versus traditional concrete, yielding exceptional IRRs.
An interesting side-note is that producing cement is not particularly CO2 intensive. Around 1 ton of CO2 is usually emitted per ton of cement. This translates into around 0.12 tons of CO2 per ton of concrete. However, the issue is that these construction materials are produced in massive quantities: around 4 GTpa of cement and around 35 GTpa of concrete. These are huge numbers and contextualized further in our breakdown of global CO2 emissions.
To read more about Solidia CO2-cured concrete and its economics, please see the article sent out to our distribution list.
Another devastating impact of COVID-19 may still lie ahead: a 1-2Mbpd upwards jolt in global oil demand. This would trigger disastrous under-supply in the oil markets, stifle the economic recovery and distract from energy transition. This 17-page note upgrades our 2022-30 oil demand forecasts by 1-2Mbpd above our pre-COVID forecasts. The increase is from road fuels, reflecting lower mass transit, lower load factors and resultant traffic congestion.
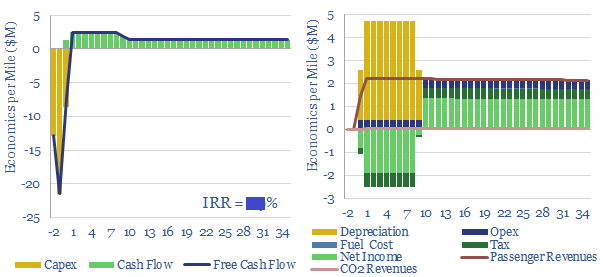
This data-file models the energy economics and costs of constructing new electric rail lines, to displace automobile traffic and accelerate the energy transition.
Under our base case forecasts, a mid-sized electric rail project would struggle economically, without tax-support, while saving around 1kT of CO2 per track-mile per year.
The economics depend heavilyupon prices, costs and passenger numbers. Double-digit returns are achievable outside the United States, based on >75% lower apparent capex costs, especially for lines carrying c10,000 passengers per day.
CO2 pricesdo not materially change the picture, only adding around c1.5pp to our base case IRRs, even at a CO2 price of $500/ton, near the top of our cost-curve.
To read more on the costs of constructing electric rail, please see the article sent out to our distribution list here.
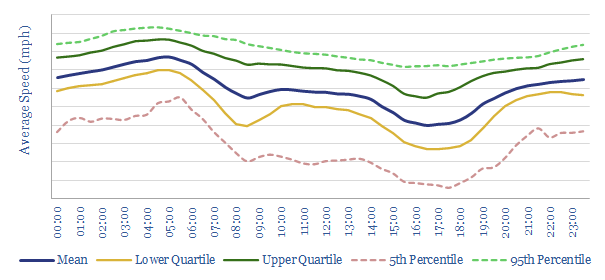
We have quantified the average speed of automobiles on a dozen highways and expressways flowing into New York City from Long Island, CT and New Jersey, to quantify how traffic ebbs and flows over time.
Traffic is most severe at 4-5pm, second worst at 8-9am, but least severe at 4-5am. The data in the file are from 2H19.
We can compute average vehicle fuel economy, as a function of these traffic speeds. Moderate-severe traffic congestion curtails average vehicle fuel economy by 15-45% on highways leading in to a city.
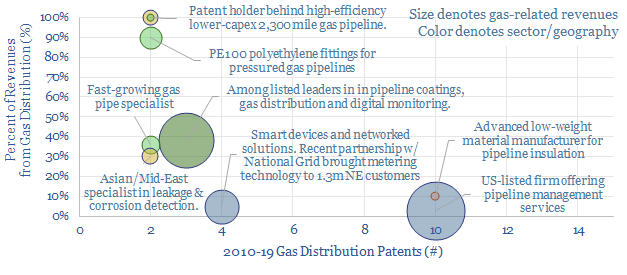
This data-file tracks over 800 ex-China patents for the pipeline transportation of natural gas, filed from 2010 to 2019. The aim is to screen for exciting technologies and companies with technologies to improve gas distribution, as natural gas demand is set to treble in the most economic route to an energy transition.
Global research into natural gas transportation technologies remained consistent from 2010 – 2016 averaging c85 filings per year. Since 2017, however, the number of patent filings has actually decreased. From 2017 – 2019, there have been an average of just c40 patents filed per year – a c50% drop from the ’10-’16 average.
Innovative growth companies with a focus on pipeline gas transport include 3 publicly listed firms and 6 venture-stage start-ups. They are commercialising next-generation materials, leak monitoring and remote metering solutions.
Larger and listed companieswith recent innovations in gas distribution are described in this short note, including Air Liquide, Air Products, Kogas, Tokyo Gas, Shawcor and Ecolab.
While it was an interesting exercise to screen for new patents that might improve the century old industry of gas distribution, we are left thinking that the best opportunities for traditional gas distribution companies in the energy transition are to minimze methane leaks, improve compressor efficiency, and consider adjacent sectors such as CCS, demand shifting and power infrastructure.
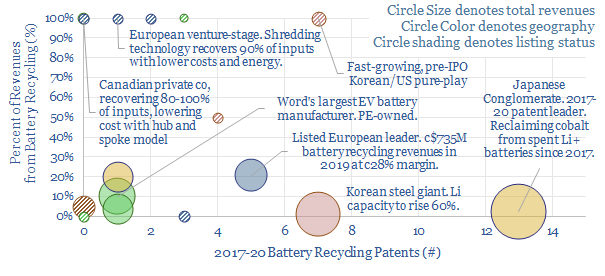
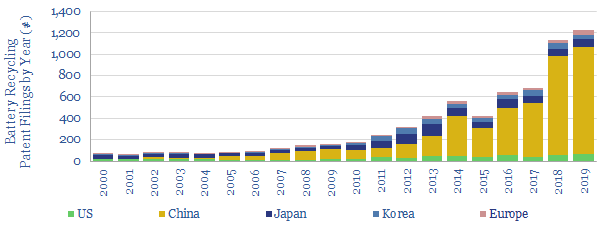
This data-file tracks over 6,000 patents filed into battery recycling technology, focusing in on 1,800+ post-2010, Western-filed patents. This matters as annual battery disposal requirements will ramp up to over 250kTpa over the next decade. Hence the pace of patent development has been escalating at a 15% CAGR.
18 technology leaders are profiled ex-China, based on their patent filings and public disclosures. We tabulate the size, likely battery recycling revenues and recent commercial progress.
The leaders include 6 larger-cap listed companies (two in Japan, two in the US, one in Korea, one in Europe) and 10 private companies, including some exciting, early-stage concepts to improve material recovery and costs.
The final tabsof the file include all of the patents, with summaries, and our notes from recent technical papers.
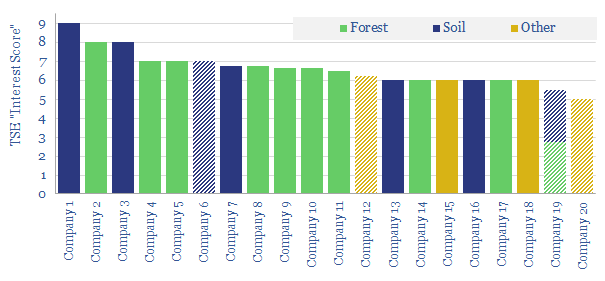
This data-file screens twenty companies involved in measuring and verifying nature-based carbon offsets, in forests and soils. It includes 6 leading companies at the cutting edge (5 private, and 1 subsidiary of a large, listed US corporation).
Traditional methodologies have evolved rapidly, from time-intensive and cumbersome manual methods, into a fully-fledged, technology-driven, real-time remote sensing industry. This is a pre-requisite for the scale-up of nature-based CO2 offsets.
The data-file containsan overview of each of the 20 companies, its size, recent progress and a subjective score of its edge and interest. The file also contains our notes on measuring soil and forest CO2, plus c400 patents that informed the screen.
Natural gas currently fuels two-thirds of residential and commercial heating, which in turn comprises c10% of global CO2. We have assessed ten technologies to decarbonize heat, including heat pumps, renewables, biogas and hydrogen. The lowest cost and most practical solution is to double down on natural gas, alongside nature-based carbon offsets. Global gas demand for heating should continue rising by 3bcfd per year.
Cookies?
This website uses necessary cookies. Our cookies are simply to improve your experience. We do not undertake any advertising or targeting via our cookies. By clicking 'accept' or continuing to use the website, you consent to our use of cookies.AcceptRead More
Privacy & Cookies Policy
Privacy Overview
This website uses cookies to improve your experience while you navigate through the website. Out of these, the cookies that are categorized as necessary are stored on your browser as they are essential for the working of basic functionalities of the website. We also use third-party cookies that help us analyze and understand how you use this website. These cookies will be stored in your browser only with your consent. You also have the option to opt-out of these cookies. But opting out of some of these cookies may affect your browsing experience.
Necessary cookies are absolutely essential for the website to function properly. This category only includes cookies that ensures basic functionalities and security features of the website. These cookies do not store any personal information.
Any cookies that may not be particularly necessary for the website to function and is used specifically to collect user personal data via analytics, ads, other embedded contents are termed as non-necessary cookies. It is mandatory to procure user consent prior to running these cookies on your website.