Thunder Said Energy is a research firm focused on economic opportunities that drive the energy transition. Our top ten conclusions into LNG are summarized below, looking across all of our research.
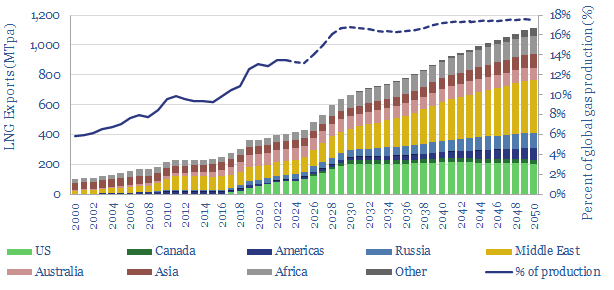
(1) LNG markets treble in our energy transition roadmap, rising from 400MTpa today to 1,100MTpa by 2050, for a c4% CAGR. The main reason is to displace coal, which is 2x more CO2 intensive. This LNG growth rate is 1.5x faster than total global natural gas supply growth, which “merely doubles” from 400bcfd to 800bcfd, for a 2.5% CAGR. The world needs $20bn of new liquefaction capex per year. Our LNG outlook through 2050 is modeled here.
(2) Marginal cost is $10/mcf as a rule-of-thumb for the 2020s. This is summing up the economics across the entire value chain for gas production, gas processing, pipeline transportation, LNG liquefaction, LNG shipping and LNG regasification. The best projects work at $7/mcf. But prices will run well above marginal cost amidst under-supply.
(3) Under-supply in 2023-28 in our supply model augurs for $15-40/mcf spot global LNG prices. After adding +20MTpa of new LNG supplies each year from 2015 to 2022, we think the world will be lucky to add +10MTpa in 2023 and 2024. There is always a further risk of supply disruptions. Meanwhile, Europe’s 15bcfd of Russian gas imports, volumetrically equivalent to 110MTpa of LNG, are shifting. The best note covering our gas outlook is linked here and our European gas models are linked here.
(4) The key challenge is CO2. Liquefying natural gas at -160C requires 300-400kWh/ton of energy, depending on the LNG plant design. This results in 3-4 kg/mcf of Scope 1+2 CO2. Across the value chain, LNG will have 7-10kg/mcf of Scope 1+2 CO2. Adding the Scope 3 from combustion, we reach total CO2 intensity of 60-65kg/mcf. Coal is 130kg/mcfe. Yet it feels like we could die of energy shortages before gas critics listen to “relative CO2” reasoning and countenance long-term LNG contracts.
(5) Rising to the challenge. The LNG industry can satisfy its skeptics. This is earnestly happening. It includes measuring CO2 in LNG supply chains. Then offsetting it via nature-based CO2 removals. Or capturing CO2 from combustion, then sharing regas terminal infrastructure to liquefy it, and ship it away for disposal. We have written a full note on back-carrying CO2 here. CO2 abatement costs range from $50-125/ton, or $3.0-7.5/mcfe. This scores well on our cost curves.
(6) 2020s supply growth will be dominated by the US, which is particularly well placed to assuage gas shortages in Europe. US LNG can treble from 70MTpa in 2021 to 200MTpa by 2030. It requires an extra 17bcfd of gas (c18% total US gas supply growth), which in turn pulls on E&P activity in the Haynesville, Permian and Marcellus.
(7) Longer term supply growth will be dominated by the Middle East, which is particularly well placed to phase out China’s coal. These numbers are mind-blowing. As an idea, if China directly substituted all 4GTpa of its coal (10GTpa of CO2 emissions!), this would require 1,600 MTpa of LNG, i.e., 4x more than today’s entire global LNG market. If you read one note, to understand this topic, we would recommend this one.
(8) Smaller-scale LNG and transport upside? We have reviewed opportunities in LNG in transport, smaller-scale LNG, LNG-fueled trucks, LNG-fueled ships, eliminating methane slip, LNG fuelling stations, small fixed LNG plants, floating LNG plants. There are some interesting concepts, especially for specific applications. But we have not materially de-risked smaller-scale LNG upside in our numbers yet.
(9) Cyclical industries reward counter-cyclical behaviours, and LNG is deeply cyclical. The title chart above shows this nicely, with spurts of growth, punctuated by plateaus, once per decade. It always feels uncomfortable to sanction projects when others are not. But our view is that bravery gets rewarded. “If you build it, the demand will come”.
(10) Companies. Incumbents benefit most from under-supply in the 2020s. Upcoming projects and their sponsors are summarized in our LNG supply model. We have also screened LNG shipping companies. But the question that fascinates us most is whether upcoming project sponsors can avoid the cost inflation that marred the past cycle, with some interesting evidence from patents in our note here.
Around 45 reports and data-files into LNG have led us to these conclusions above; listed in chronological order on our LNG category page. The best way to access our PDF reports and data-files is through a subscription to TSE research.