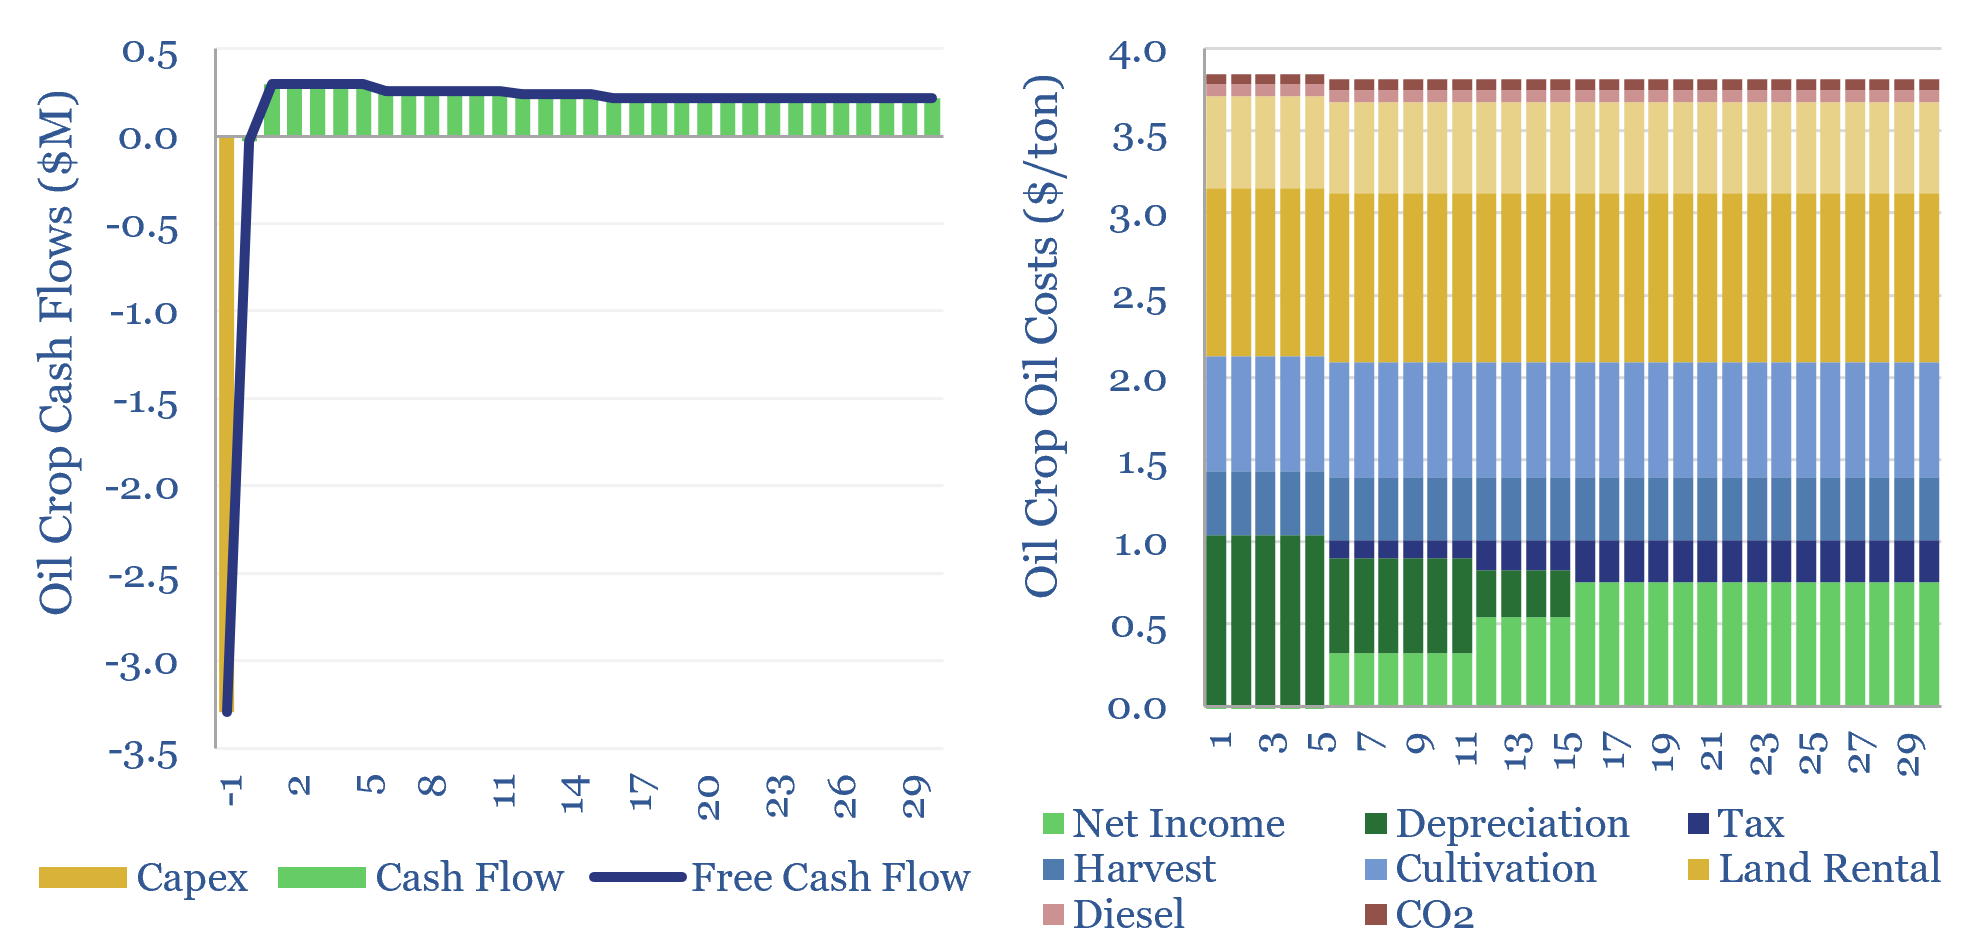
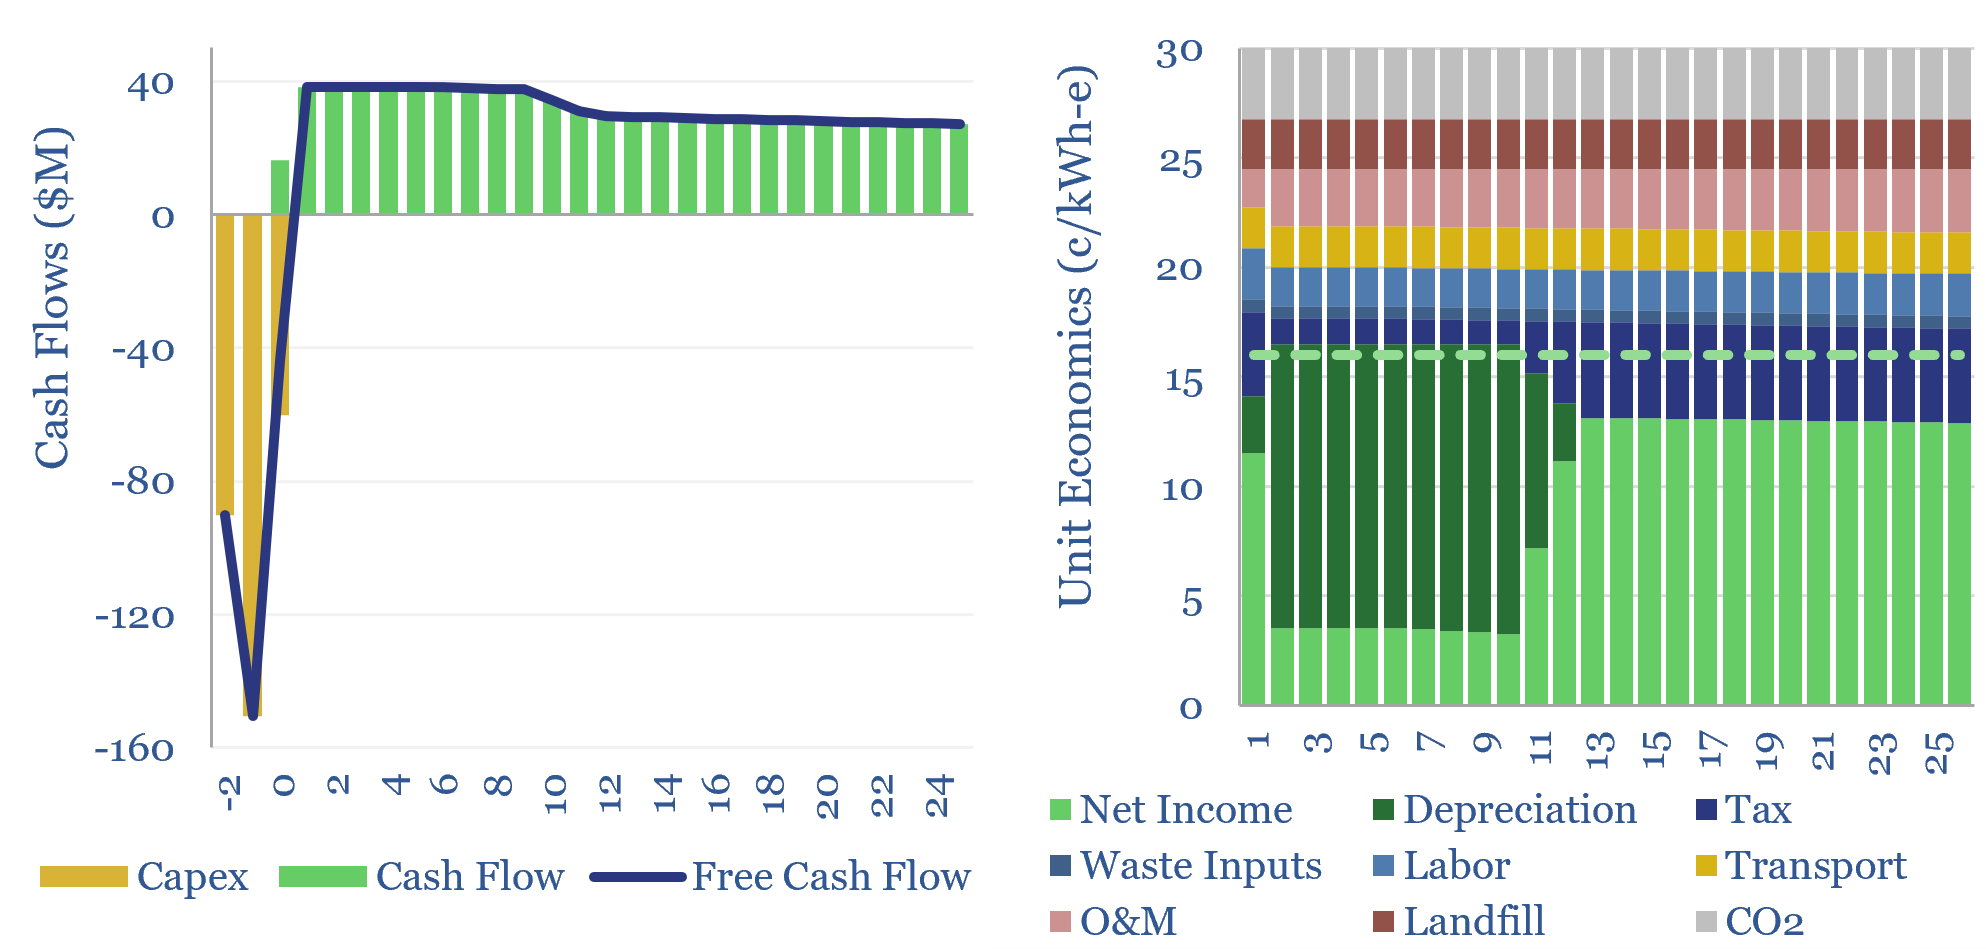
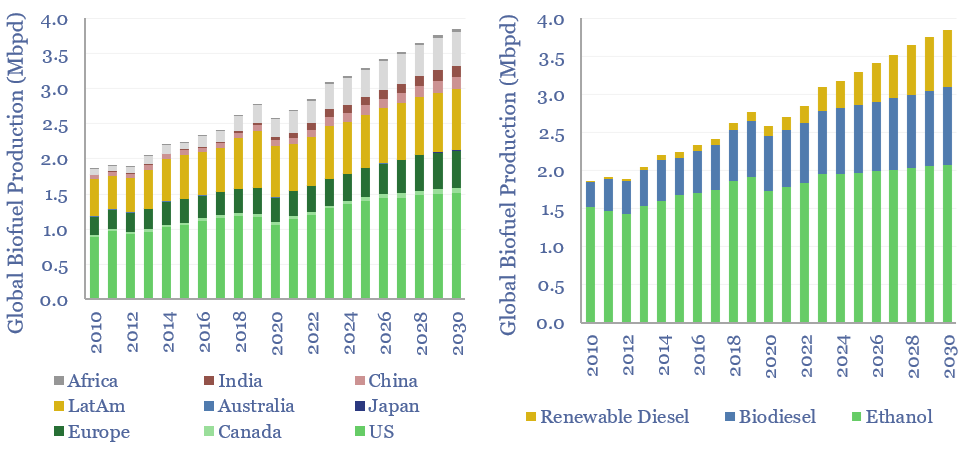
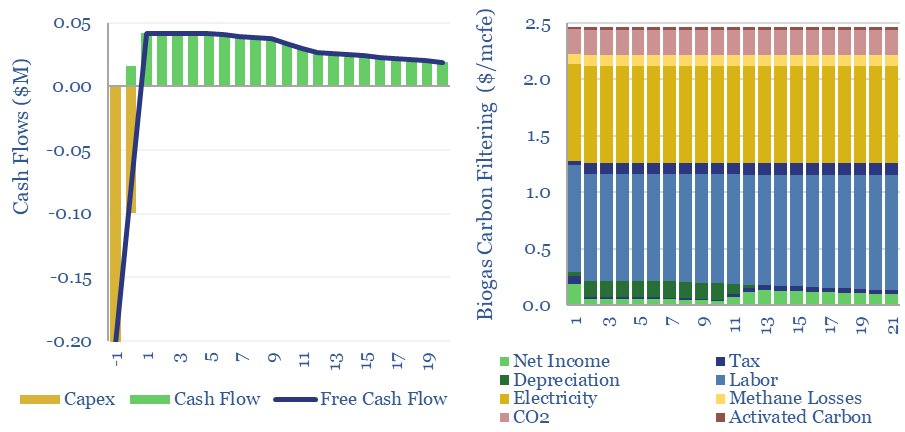
Our new energies research explores economic opportunities to drive the energy transition. Our definition of new energies is that they are not derived from the combustion of extracted resources. Solar radiation is directly converted to electricity in a photovoltaic cell. Wind and hydro power harness moving masses of fluids to drive turbines. Nuclear energy derives heat from fissioning heavy atoms; possibly in the future, from fusing light atoms. Generally these new energies yield electricity directly (i.e., no heat engines are involved). Electricity can be the highest-grade form of energy. But electricity also requires resilient power grids, sophisticated power electronics and possibly also energy storage via batteries. Achieving an energy transition requires moving ‘Heaven and Earth’, to de-bottleneck bottlenecks in power transmission (heaven) and mined metals and materials (earth). We also consider hydrogen and biofuels among new energies.
Solar Research
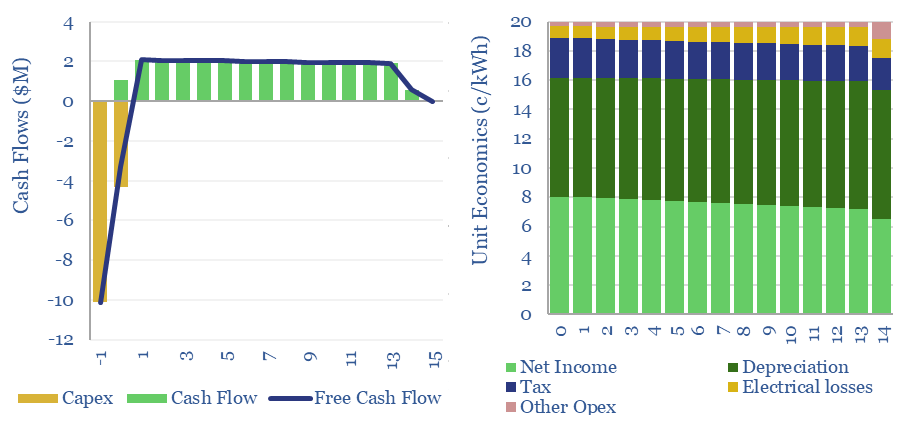
Solar trackers are worth $10bn pa. They typically raise solar revenues by 30%, earn 13% IRRs on their capex costs, and lower LCOEs by 0.4 c/kWh. But these numbers are all likely to double, as solar gains share, grids grow more volatile, and AI unlocks further optimizations? This 14-page report explores the theme and who benefits?
Download
This data-file summarizes the leading companies in solar trackers, their pricing (in $/kW), operating margins (in %), company sizes, sales mixes and recent news flow. Five companies supply 70% of the market, which is worth $10bn pa, and increasingly gaining in importance?
Download
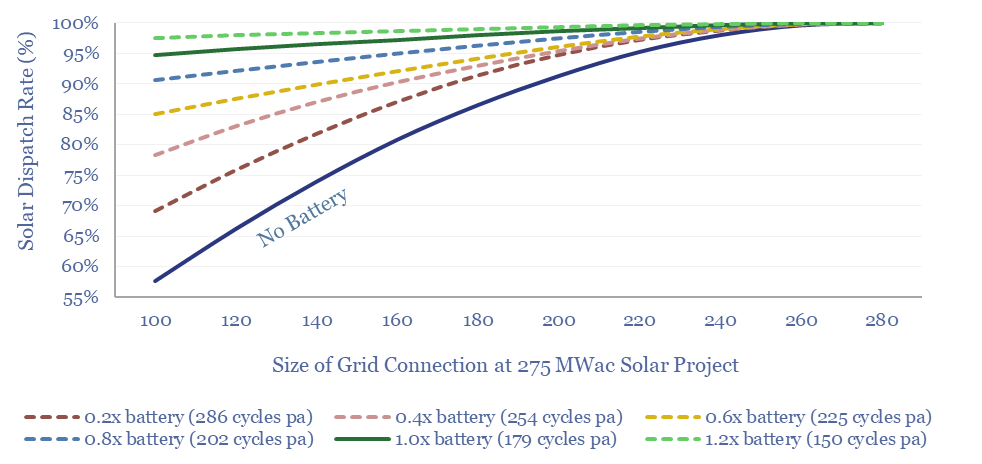
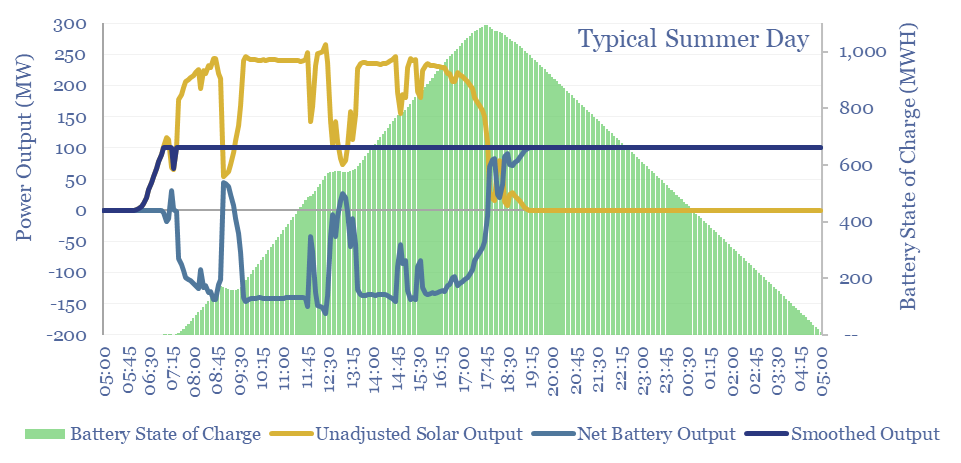
This 9-page study finds unexpectedly strong support for co-deploying grid-scale batteries together with solar. The resultant output is stable, has synthetic inertia, is easier to interconnect in bottlenecked grids, and can be economically justified. What upside for grid-scale batteries?
Download
Solar+battery co-deployments allow a large and volatile solar asset to produce a moderate-sized and non-volatile power output, during 40-50% of all the hours throughout a calendar year. The smooth output is easier to integrate with power grids, including with a smaller grid connection. The battery will realistically cycle 100-300 times per year.
Download
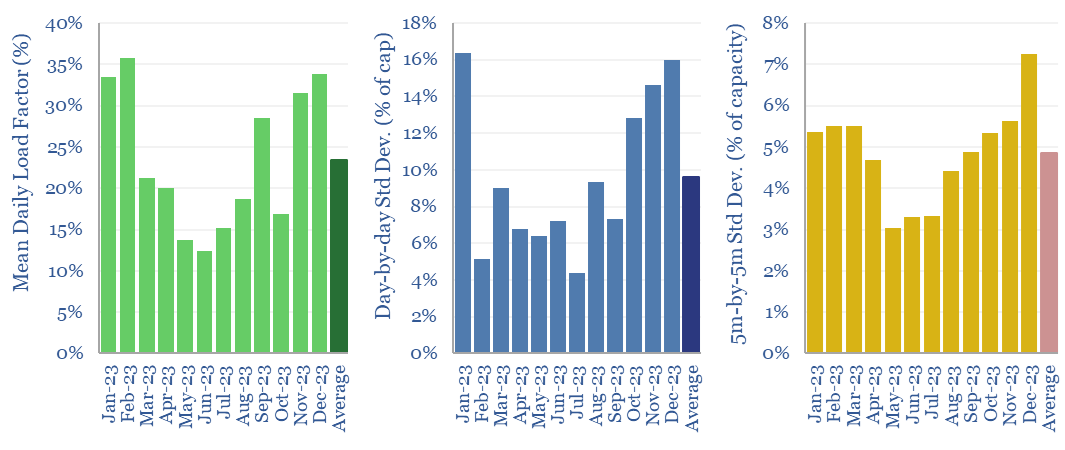
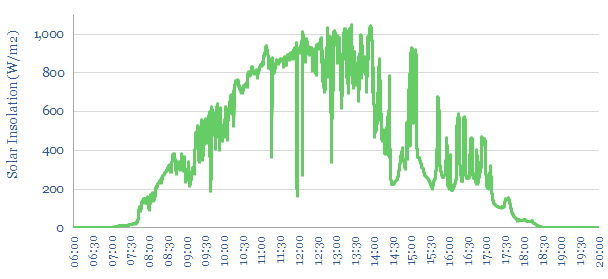
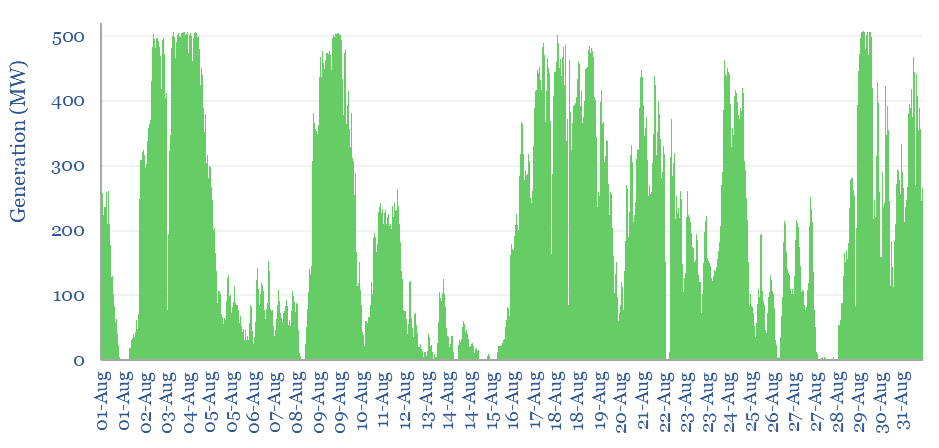
The volatility of solar generation is evaluated in this case study, by tracking the output from a 275MW solar project, at 5-minute intervals, throughout an entire calendar year. Output is -65% lower in winter than summer, varies +/-10% each day, and +/- 5% every 5-minutes, including steep power drops that in turn require back-ups.
Download
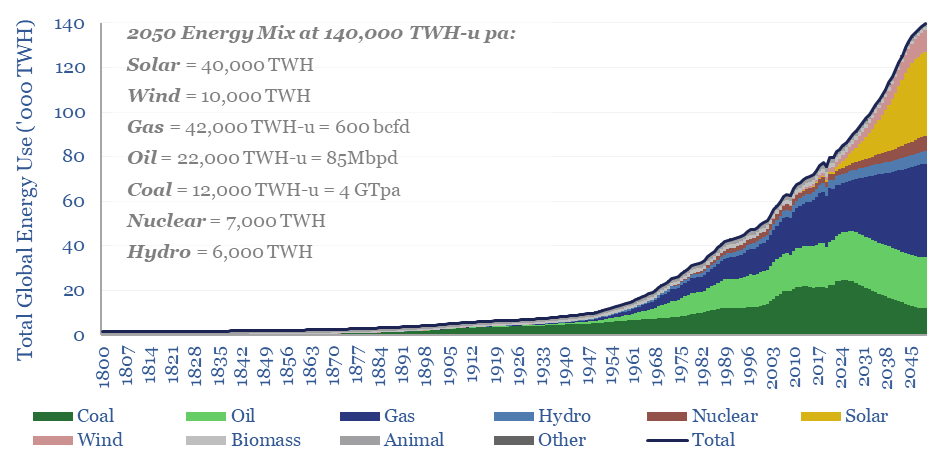
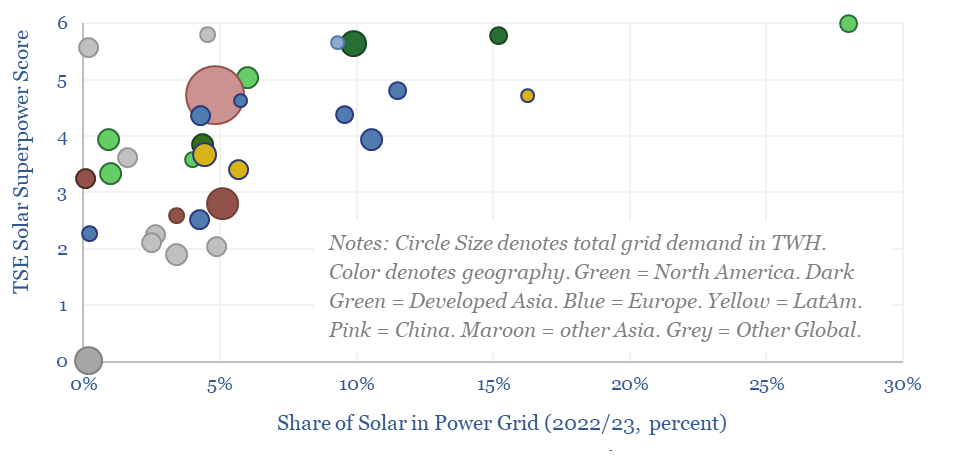
Solar ramps from 6% of global electricity in 2023, to 35% in 2050. But could any regions become Solar Superpowers and reach 50% solar in their grids? And which regions will deploy most solar? This 15-page note proposes ten criteria and ranks 30 countries. The biggest surprises will be due to capital costs, grid bottlenecks and pragmatic backups.
Download
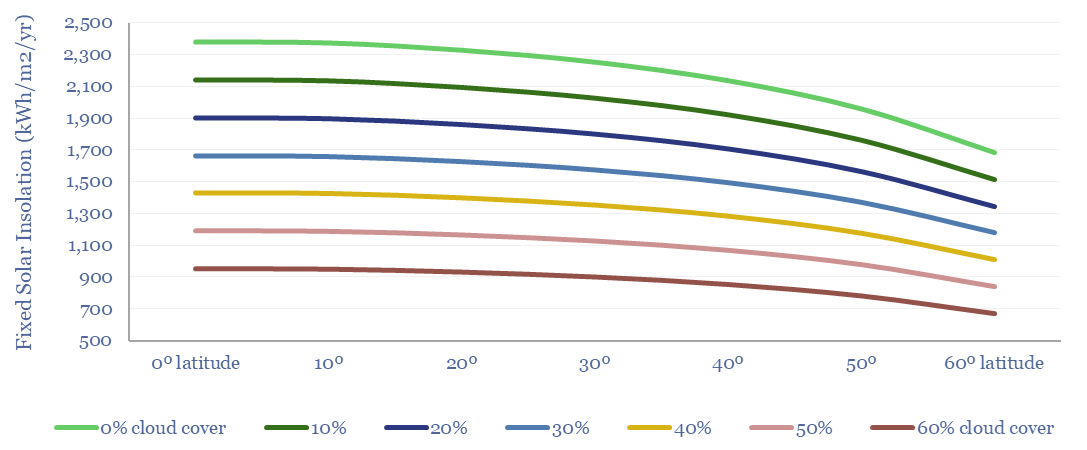
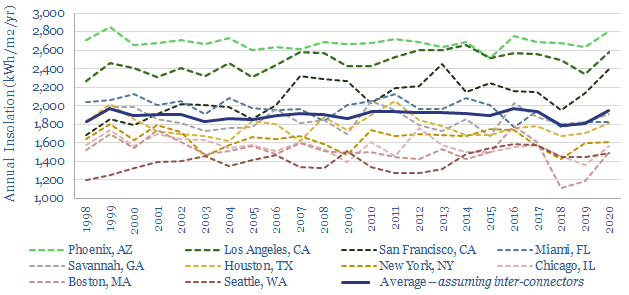
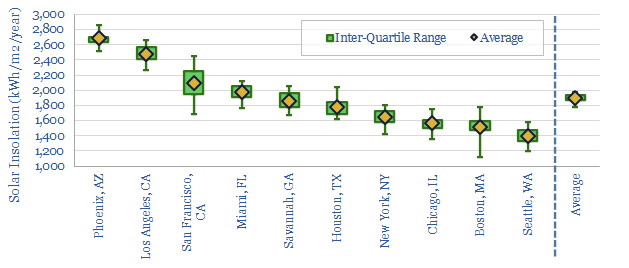
Solar insolation varies from 600-2,500 kWh/m2/year at different locations on Earth, depending on their latitude, altitude, cloudiness, panel tilt and panel azimuth. This means the economics of solar can also vary by a factor of 4x. Seasonality is a key challenge at higher latitudes. Active strategies are emerging for orienting solar modules.
Download
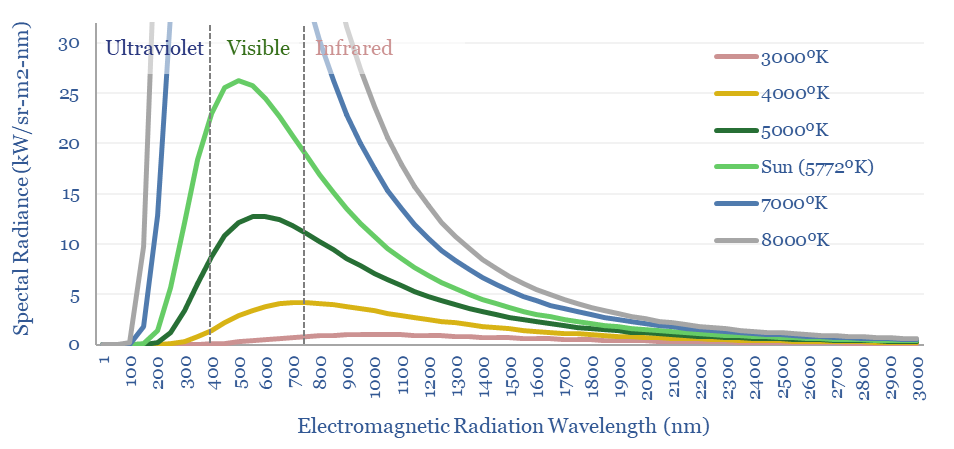
Electromagentic radiation is a form of energy, exemplified by light, infrared, ultraviolet, microwaves and radiowaves. What is the energy content of light? How much of it can be captured in a solar module? And what implications? We answer these questions by explaining the Planck Equation and Shockley-Queisser limit from first principles.
Download
This data-file is a screen of leading companies in vapor deposition, manufacturing the key equipment for making PV silicon, solar, AI chips and LED lighting solutions. The market for vapor deposition equipment is worth $50bn pa and growing at 8% per year. Who stands out?
Download
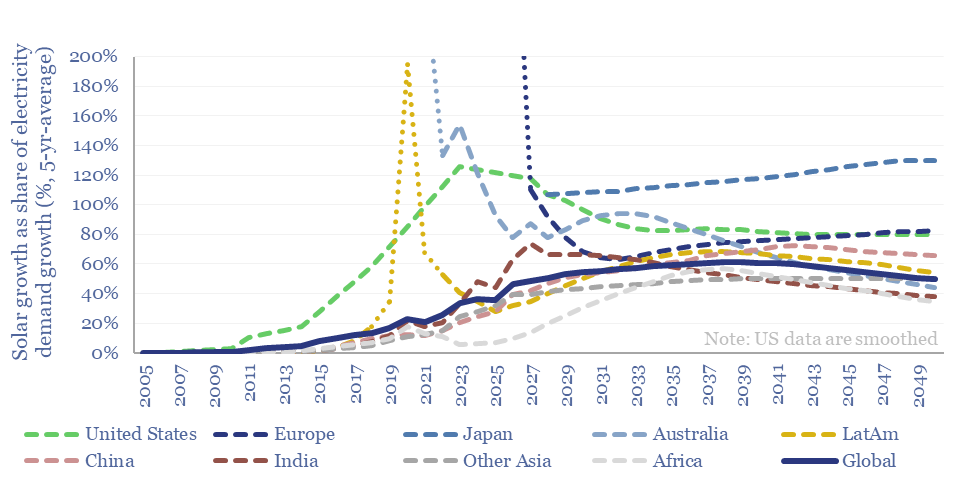
How much new solar can the world absorb in a given year? And are core markets such as the US now maturing? This 15-page note refines our solar forecasts using a new methodology. Annual solar adds will likely plateau at 50-100% of total electricity demand growth in most regions. What implications and adaptation strategies?
Download
50 companies make conductive silver pastes to form the electrical contacts in solar modules. This data-file tabulates the compositions of silver pastes based on patents, averaging 85% silver, 4% glass frit and 11% organic chemicals. Ten companies stood out, including a Korean small-cap specialist.
Download
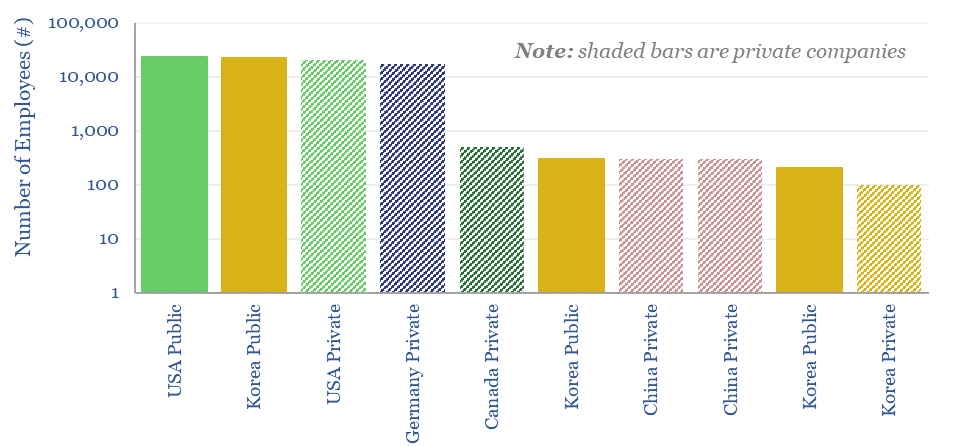
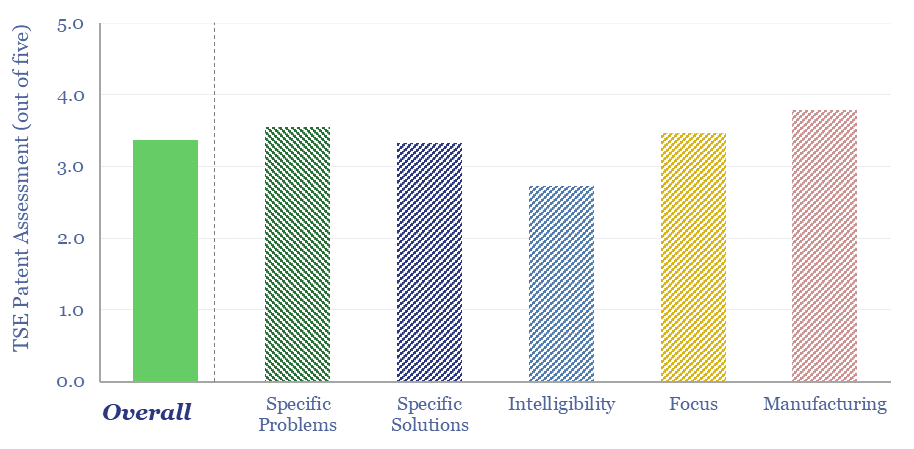
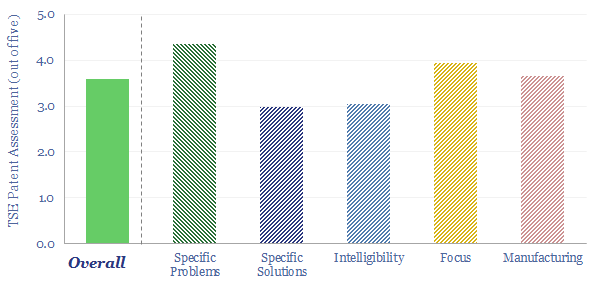
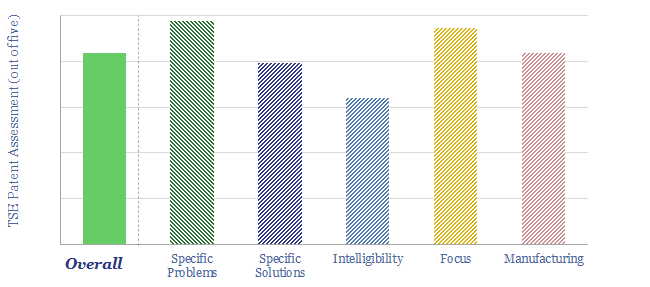
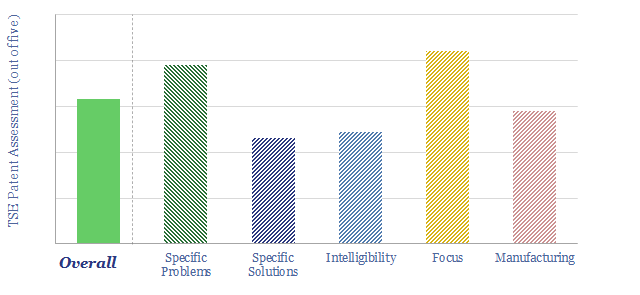
This data-file is our LONGi technology review, based on recent patent filings. The work helps us to de-risk increasingly efficient solar modules, a growing focus on perovskite-tandem cells, and low-cost solar modules, with simple manufacturing techniques that may ultimately displace bottlenecked silver from electrical contacts. Key conclusions in the data-file.
Download
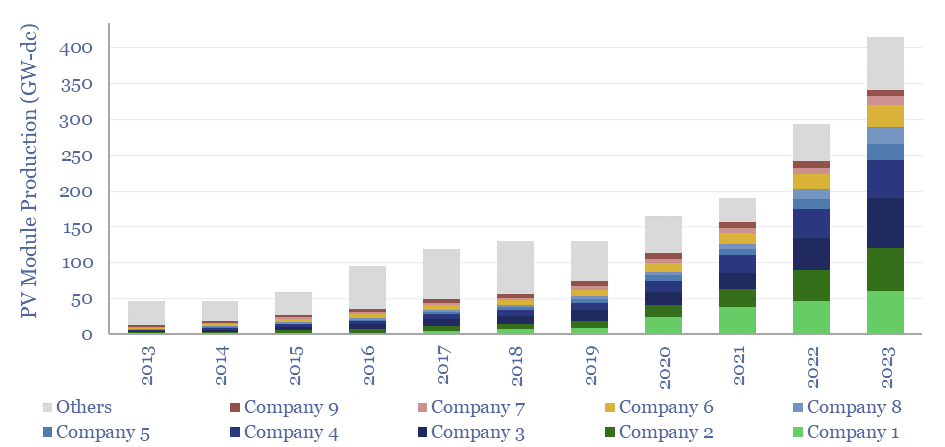
The world produced over 400GW of solar modules in 2023, which is up 10x from a decade ago. This data-file breaks down solar module production by company and over time, comparing the companies by solar module selling prices ($/kW), margins (%), efficiency (%), transparency, and technology development.
Download
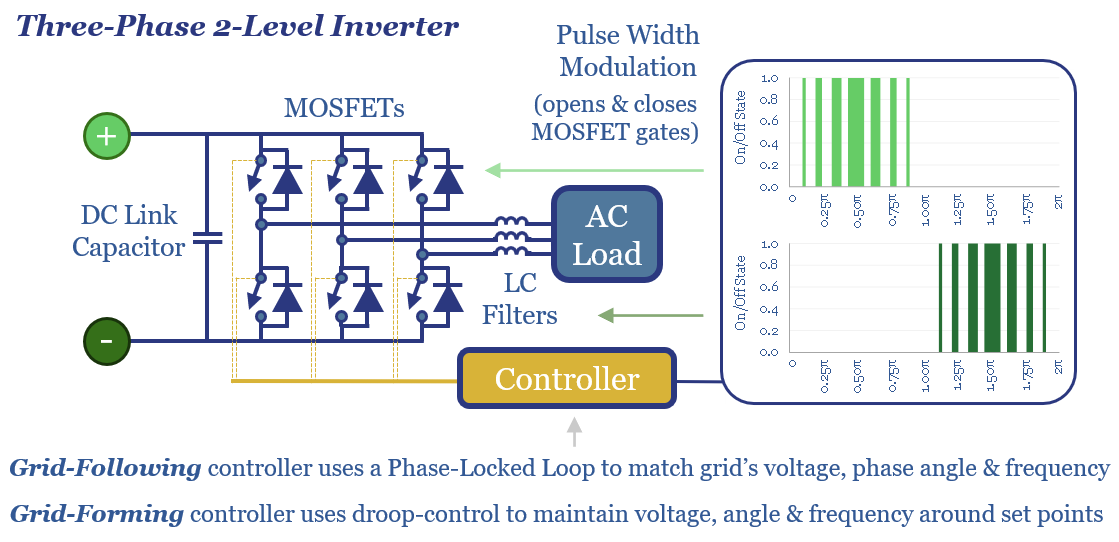
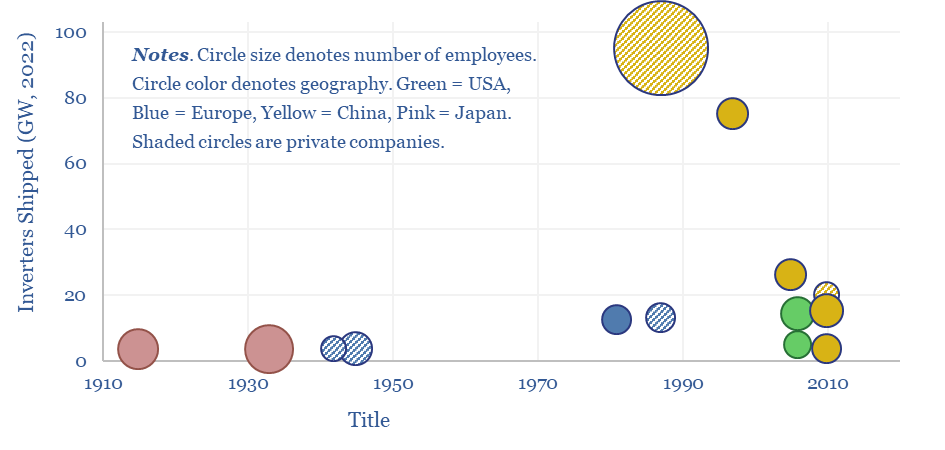
This data-file tracks some of the leading solar inverter companies and inverter costs, efficiency and power electronic properties. As China now supplies 85% of all global inverters, at 30-50% lower $/W pricing than Western companies, a key question explored in the data-file is around price versus quality.
Download
Semiconductors underpin solar panels, electric vehicles and electronics. Hence this 20-page note aims to explain semiconductor physics from first principles: their conductivity and resistance, their use in devices, plus implications for materials value chains and the energy transition itself?
Download
This datafile calculates the conductivity and resistivity of semiconductors from first principles, based on their bandgap, doping, electron and hole mobility, temperature, the Fermi-Dirac distribution and the Effective Density of States. Put in any inputs you like to compute the resistance of silicon, germanium or GaAs.
Download
Solar encapsulants are 300-500ฮผm thick films, protecting solar cells from moisture, dirt and degradation; electrically insulating them at 4 x 10^15 ฮฉcm resistivity; and yet allowing 90% light transmittance. The industry is moving away from commoditized EVA towards specialized blends of co-polymers and additives. Is there a growing moat around Mitsui Chemicals' solar encapsulants?
Download
Polysilicon is a highly pure, crystalline silicon material, used predominantly for photovoltaic solar, and also for 'chips' in the electronics industry. Global polysilicon capacity is estimated to reach 1.65MTpa in 2023, and global polysilicon production surpasses 1MTpa in 2023. China now dominates the industry, approaching 90% of all global capacity.
Download
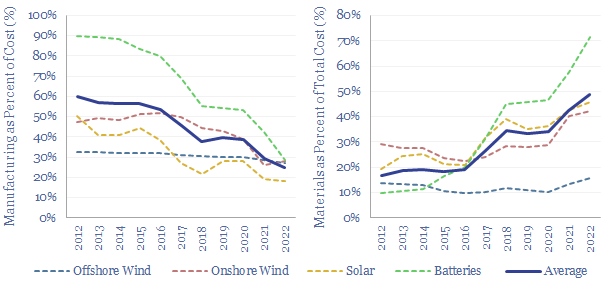
Over the past decade, costs have deflated by 85% for lithium ion batteries, 75% for solar and 25% for onshore wind. Now new energies are entering a new era. Future costs are mainly determined by materials. Bottlenecks matter. Deflation is slower. Even higher-grade materials are needed to raise efficiency. This 14-page note explores the new … Continue reading "New energies: the age of materials?"
Download
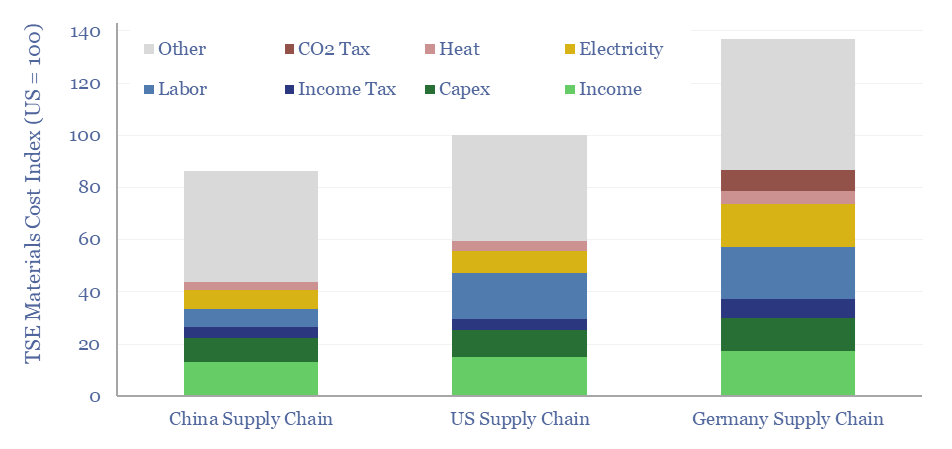
Utility-scale solar costs have deflated by 75% in the past decade to around $1,000/kW. 60% has been the scale-up to mass manufacturing, and 40% has been rising efficiency of solar modules. Materials costs now look likely to dominate future costs and their trajectory. And advanced materials can help double efficiency again from here? Who benefits?
Download
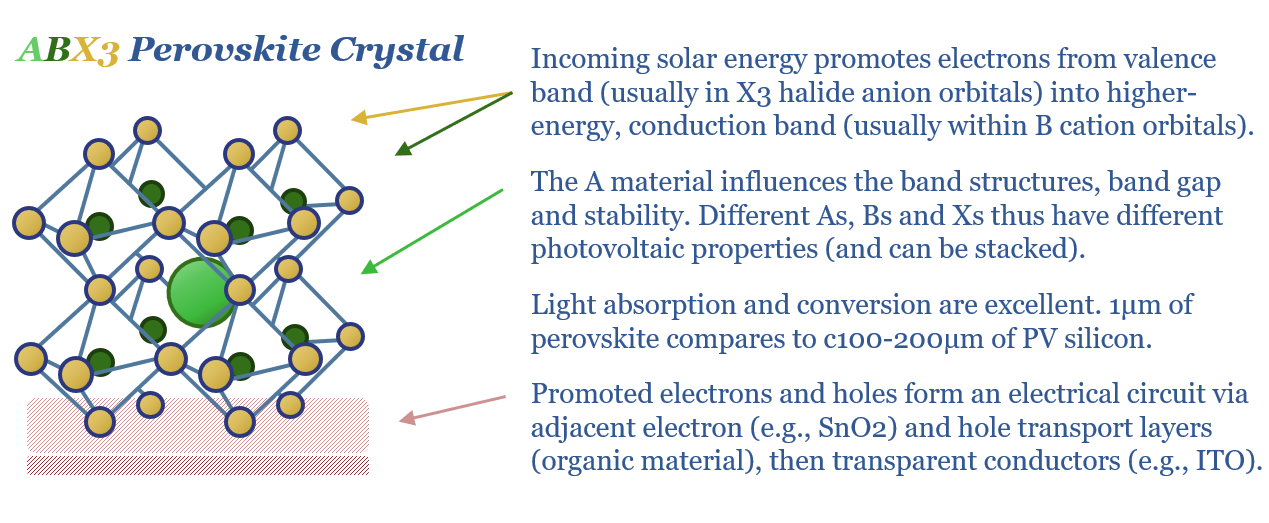
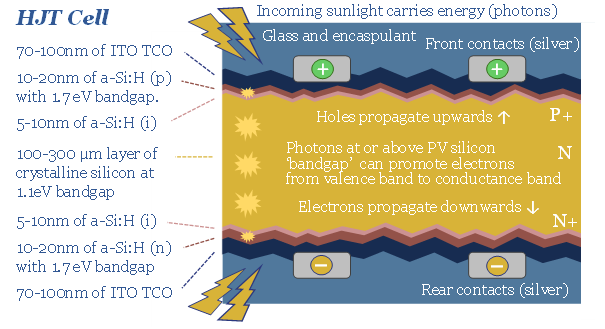
HJT solar modules are accelerating, as they are highly efficient, and easier to manufacture. But HJT could also be a kingmaker for Indium metal, which is used in transparent and conductive thin films (ITO). Our forecasts see primary Indium use rising 4x by 2050. Indium is 100x rarer than Rare Earth metals. It could be a bottleneck. What implications?
Download
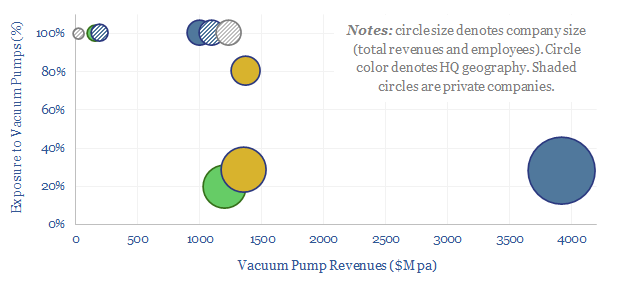
The global market for vacuum pumps is worth $15bn per year, with growing importance for making semiconductors, solar panels and AI chips. This data-file reviews ten leading companies in vacuum pumps, including one European-listed capital goods leader, a European pure-play and a Japanese-listed pure-play.
Download
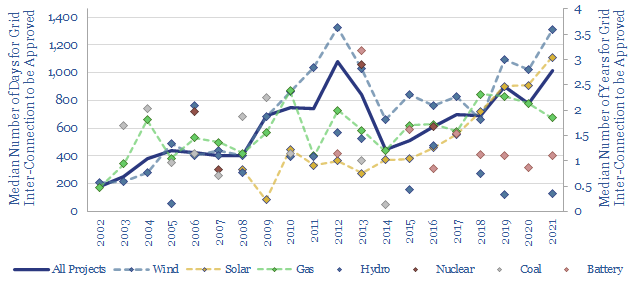
Is the power grid becoming a bottleneck for the continued acceleration of renewables? The median approval time to tie a new US power project into the grid has climbed by 30-days/year since 2001, and doubled since 2015, to over 1,000 days (almost 3-years) in 2021. Wind and solar projects are now taking longest. This data-file looks for de-bottlenecking opportunities, and wonders about changing terms of trade in power markets.
Download
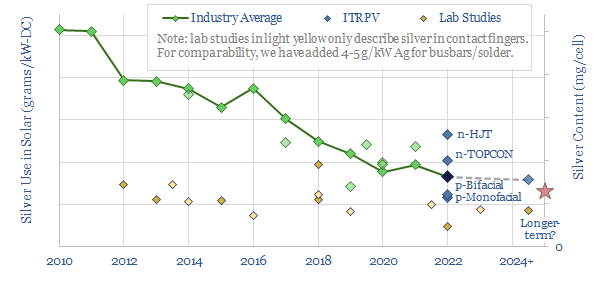
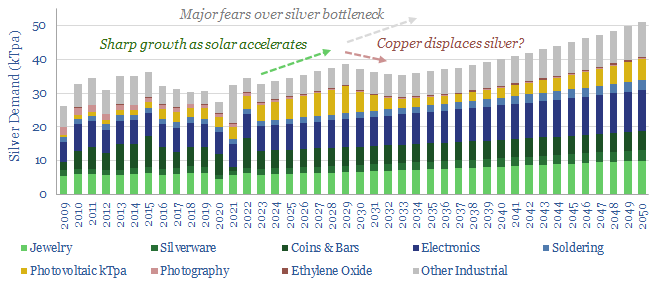
Ramping new energies is creating bottlenecks in materials. But how much can material use be thrifted away? This is a case study of silver intensity in the solar industry, which halved in the past decade, and could halve again. Conclusions matter for solar companies, silver markets, other bottlenecks.
Download
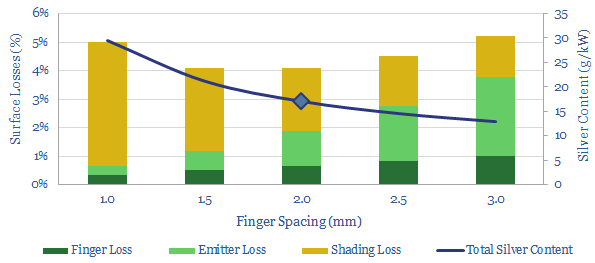
This data-file calculates the losses in a solar cell from first principles. Losses on the surface of the cell are typically c4%, due to contact resistance, emitter resistance and shading. Sensitivity analysis suggests there may be future potential to halve silver content in a solar cell from 20g/kW to 10g/kW without materially increasing the losses beyond 4%.
Download
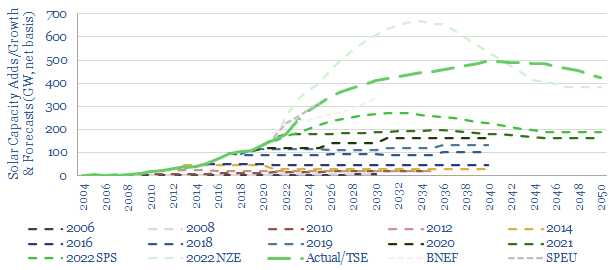
Forecasts for future solar growth have an unsatisfyingly uncertain range, varying by 3x. Hence this 15-page note discusses the future of solar. Solar capacity additions likely accelerate 3.5x by 2030 and 5x by 2040. But this creates bottlenecks, including for seven materials; and requires >$1trn pa of additional power grid capex plus $1trn pa of power electronics capex.
Download
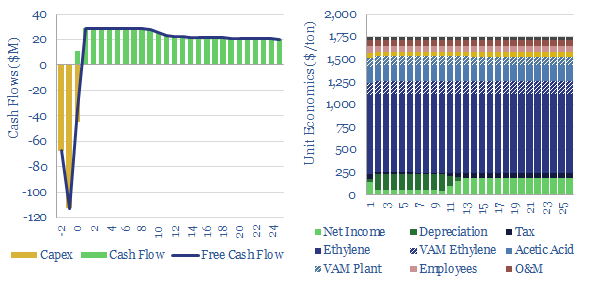
Ethylene vinyl acetate is produced by reacting ethylene with vinyl acetate monomer. This data-file estimates production costs, with a marginal cost between $1,500-2,000/ton, and a total embedded CO2 intensity of 3.0 tons/ton. EVA comprises 5% of the mass of a solar panel and could be an important solar bottleneck.
Download
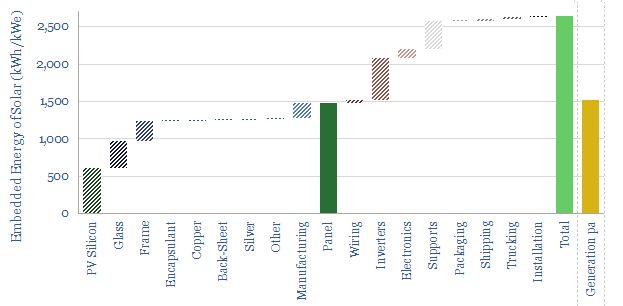
What is the energy payback and embedded energy of solar? We have aggregated the consumption of 10 different materials (in kg/kW) and around 10 other energy-consuming line-items (in kWh/kW). Our base case estimate is 2.5 MWH/kWe of solar and an energy payback of 1.5-years. Numbers and sensitivities can be stress-tested in the data-file.
Download
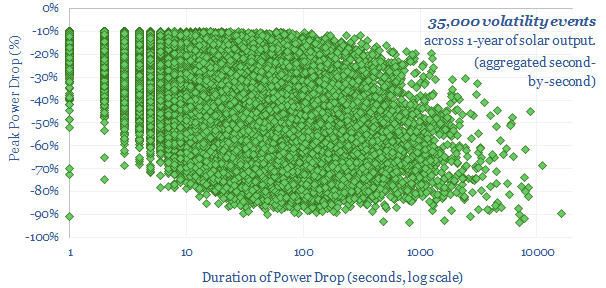
This 20-page note quantifies the statistical distribution of short-term volatility at solar power plants. Solar output typically flickers downwards by over 10%, around 100 times per day. Can industrial processes truly be โpowered by solarโ? What opportunities will arise to buffer the volatility?
Download
We have aggregated the volatility and power drops across an entire year of second-by-second solar data. Each day typically sees 100 volatility events where output drops by over 10%, and 10 events where output drops by over 70 events. Volatility also varies day by day.
Download
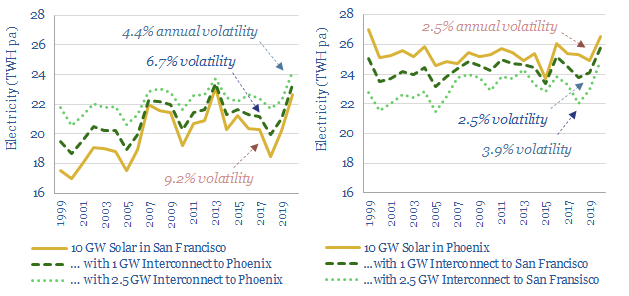
The solar energy reaching a given point on Earthโs surface varies by +/- 6% each year. These annual fluctuations are 96% correlated over tens of miles. And no battery can economically smooth them. Solar heavy grids may thus become prone to unbearable volatility. Our 17-page note outlines this important challenge, and finds that the best solutions are to construct high-voltage interconnectors and keep power grids diversified.
Download
This data-file aggregates the average annual volatility of solar (and wind) resources across ten locations, mainly cities, in the United States. Annual volatility of incoming solar energy reaching ground level tends to vary by +/- 6% per year, is 96% correlated across different locations within that city, and 50-70% correlated with other cities in the same region.
Download
Can large-scale power transmission smooth renewables' volatility? To answer this question, this horrible 18MB data-file aggregates 20-years of hour-by-hour solar insolation arriving at four cities in the US. The volatility in year-by-year can be halved by a single inter-connector.
Download
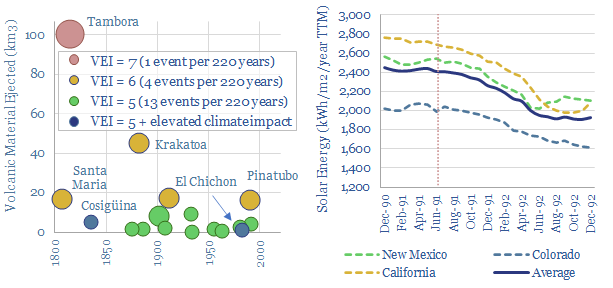
Every 30-years on average, a giant volcano erupts, ejecting >10km3 of debris, including aerosols that dim the sun and temporarily cool the planet by 0.5-1C. After Mount Pinatubo erupted in 1991, US solar insolation fell by 20% in 1992. What implications for global energy security and energy transition?
Download
The front contacts in todayโs solar cells are made of screen-printed silver, absorbing 11% of 2021โs silver market. Silver can be substituted with copper, but manufacturing is c5x more costly. So we expect a silver spike, then a switch. This 16-page note explains our outlook, and who benefits?
Download
An of overview of manufacturing methods is given in this data-file. Costs are 70% correlated with energy intensity, ranging from well below 0.3 MWH/ton to well above 7MWH/ton. The lowest cost techniques take place at huge throughput in the mining industry, while the most intricate are used in semiconductor.
Download
Trackers re-position solar panels to face the sun, as it arcs across the sky, day-by-day, season-by-season, due to the Earth's 23.5-degree tilt. Solar tracker efficiency improvements typically range from 20-40%. Capex cost increases are c20%. Thus 40-90% of utility solar now uses trackers.
Download
A new solar cell is vying to re-shape the PV industry, with 2-5% efficiency gains and c25-35% lower silicon use. This 13-page note reviews TOPCon cells, which will take some sting out of solar re-inflation, tighten silver bottlenecks and may further entrench Chinaโs solar giants.
Download
Nexwafe is growing standalone silicon wafers on mono-crystalline seed wafers, with no need to slice ingots. It should improve solar efficiency, materials intensity and CO2 intensity. Our technology review found 60 patent filings and can partly de-risk growth ambitions.
Download
First Solar is a solar manufacturer with capacity to produce 8GW of solar panels per year, using CdTe thin film technology. It has production in the US and uses 60% less energy than photovoltaic silicon. Efficiency is interesting. It is usually lower for CdTe than c-Si, but 70% of First Solar's patents target improvements.
Download
Wind Research
The volatility of wind generation is illustrated in this data-file, by aggregating the data for a large wind project in Australia, every five minutes, across an entire calendar year. Intra-day and inter-day volatility is 30-60% higher than for solar. 2-6 day feasts and famines are hard to backstop with batteries. Solar also cannibalizes wind?
Download
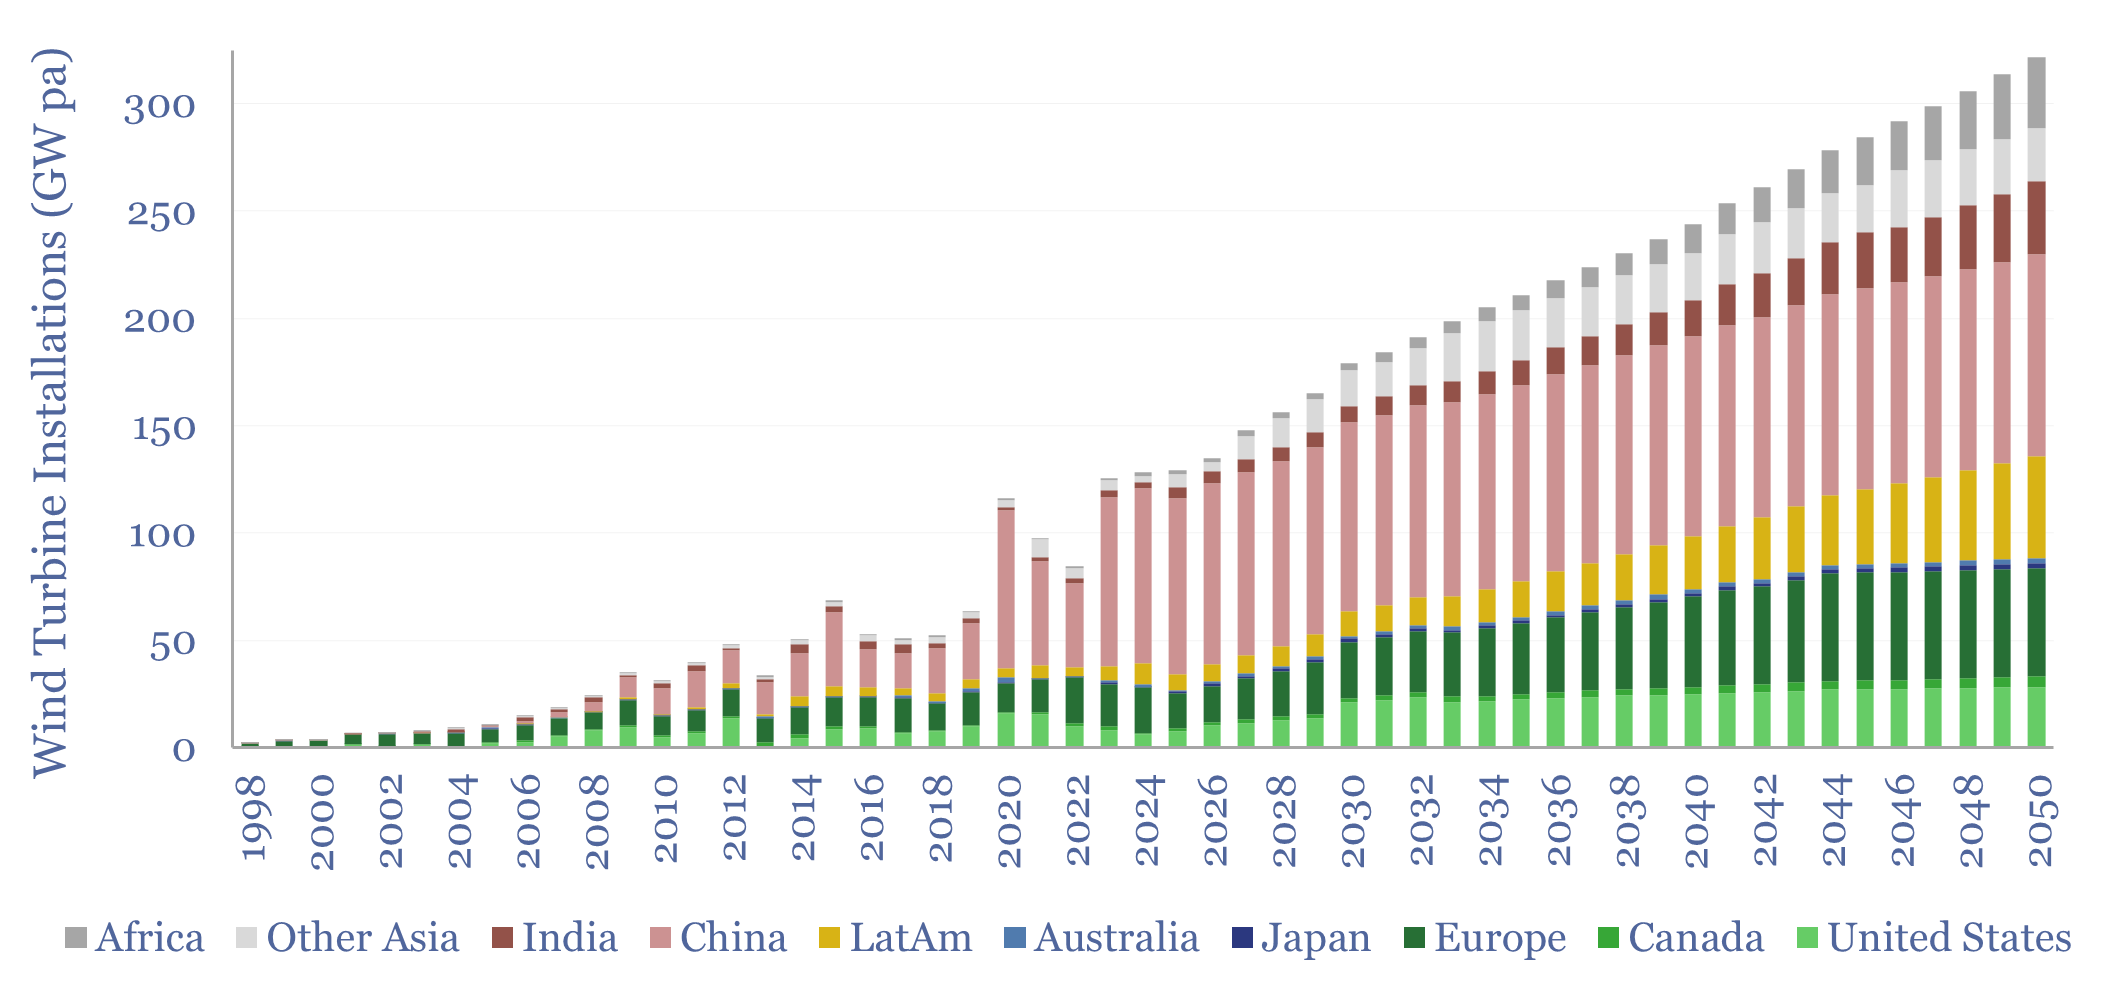
This 14-page report re-visits our wind industry outlook. Our long-term forecasts are reluctantly being revised downwards by 25%, especially for offshore wind, where levelized costs have reinflated by 30% to 13c/kWh. Material costs are widely blamed. But rising rates are the greater evil. Upscaling is also stalling. What options to right this ship?
Download
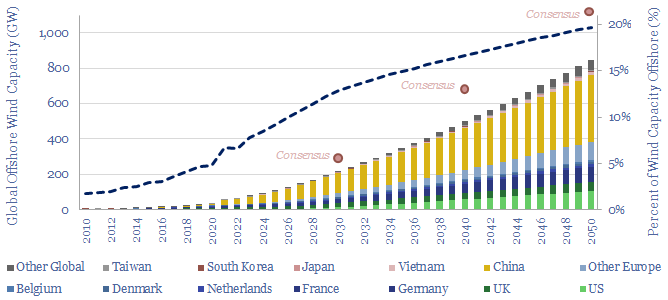
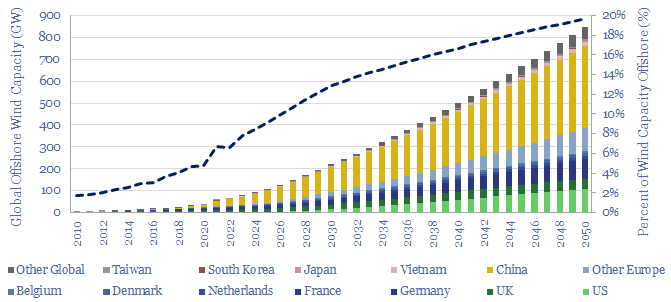
Global offshore wind capacity stood at 60GW at the end of 2022, rising at 8GW pa in the past half decade, comprising 7% of all global wind capacity, and led by China, the UK and Germany. Our forecasts see 220GW of global offshore wind capacity by 2030 and 850GW by 2050, which in turn requires a 15x expansion of this market.
Download
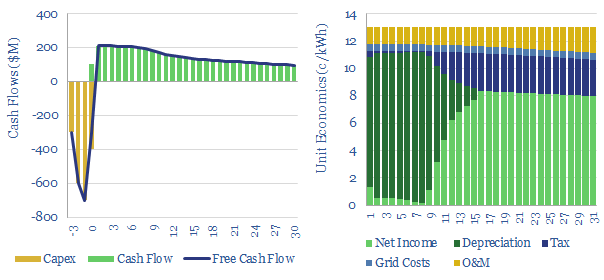
This model estimates the levelized cost of offshore wind at 13c/kWh, to generate a 7% IRR off of capex costs of $4,000/kW and a utilization factor of 40-45%. Each $400/kW on capex adds 1c/kWh and each 1% on WACC adds 1.3 c/kWh to offshore wind levelized costs.
Download
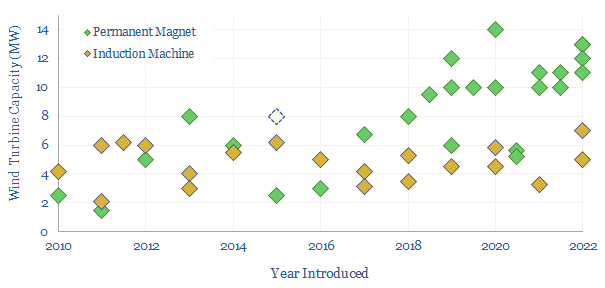
Wind turbines can use doubly fed induction generators (DFIGs) or permanent magnet synchronous generators (PMSGs) based around Rare Earth metals. This data-file captures the trends in DFIGs vs PMSGs over time by tabulating 40 examples, as turbines have grown larger, and different wind turbine manufacturers have adopted different strategies.
Download
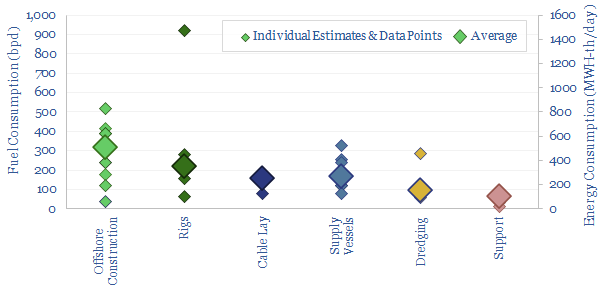
This database tabulates the typical fuel consumption of offshore vessels, in bpd and MWH/day. We think a typical offshore construction vessel will consume 300bpd, a typical rig consumes 200bpd, supply vessels consume 150bpd, cable-lay vessels consume 150bpd, dredging vessels consume 100bpd and medium-sized support vessels consume 50bpd. Examples are given in each category, with typical variations in the range of +/- 50%.
Download
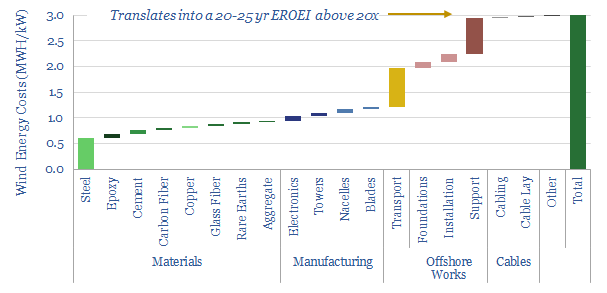
This data-file estimates 3MWH of energy is consumed in manufacturing and installing 1kW of offshore wind turbines, the energy payback time is usually around 1-year, and total energy return on energy invested (EROEI) will be above 20x. These estimates are based on bottom-up modelling and top-down technical papers.
Download
Is the power grid becoming a bottleneck for the continued acceleration of renewables? The median approval time to tie a new US power project into the grid has climbed by 30-days/year since 2001, and doubled since 2015, to over 1,000 days (almost 3-years) in 2021. Wind and solar projects are now taking longest. This data-file looks for de-bottlenecking opportunities, and wonders about changing terms of trade in power markets.
Download
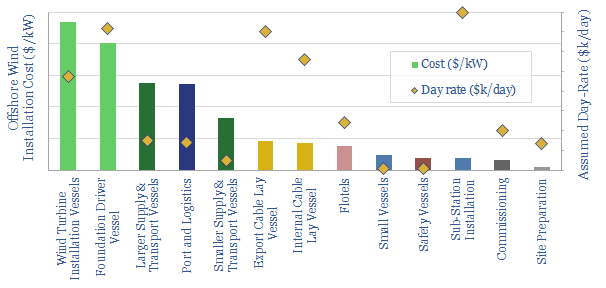
An offshore wind project is likely to cost $2,500/kW, of which c$1,500/kW is turbines and $1,000/kW is offshore installation costs. This data-file aims to estimate the breakdown by vessel type, day-rates and costs per turbine.
Download
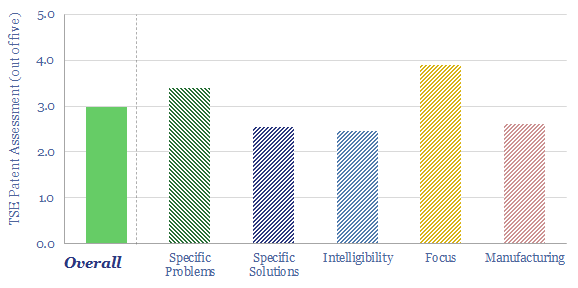
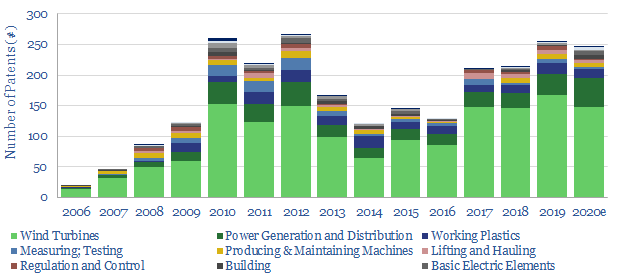
Goldwind is one of the largest wind turbine manufacturers in the world, headquartered in Beijing, and shares are publicly listed. The wind industry is increasingly aiming to mimic the inertia and frequency responses of synchronous power generators. Goldwind has published some interesting case studies. Hence we have reviewed its patents to see if we can find an edge?
Download
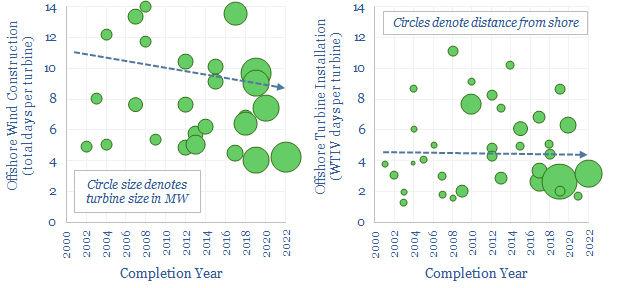
Wind turbine installation vessels are estimated to cost $100-500/kW in the breakdown of a typical offshore wind project's capex. Total offshore construction time is around 10 days per turbine. Wind turbine installation vessel use averages around 5 days per turbine. Data from past projects are tabulated in this data-file.
Download
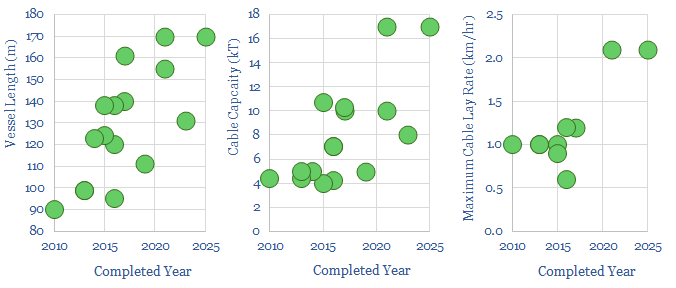
This is a database of cable installation vessels for offshore wind and power transmission; tabulating costs (in $M), contract awards (in $/km), capacity (in tons), installation speeds (in meters per hour), power ratings (in MW), crew sizes and positioning systems. There is a paradox over costs.
Download
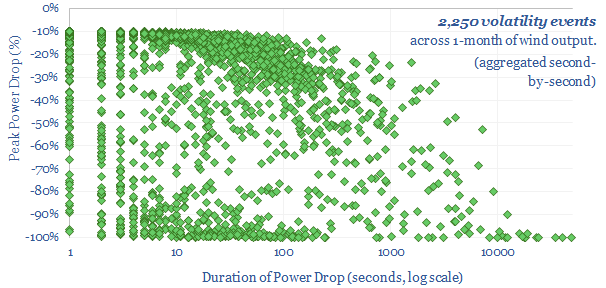
We have evaluated the second-by-second data on the power output of a 25MW onshore wind farm in Germany. A typical day sees 75 volatility events. Compared to solar, wind power drops slightly less frequently, but more extensively (often >90%) and for longer (often several hours or days). Both wind and solar show high short-term volatility.
Download
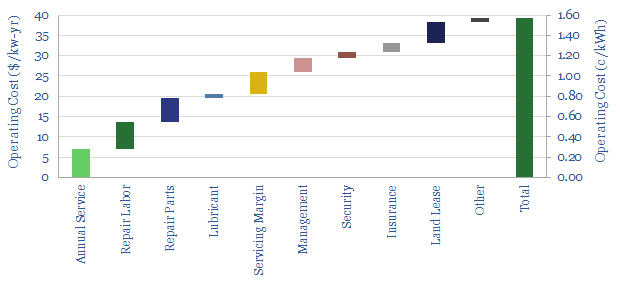
Opex for a wind power project is typically $40/kW-year, or around 1-2c/kWh. Around $25/kW is maintenance, suggesting the wind maintenance market is now worth >$20bn per year. The best route to lower cost is up-scaling turbines and wind assets.
Download
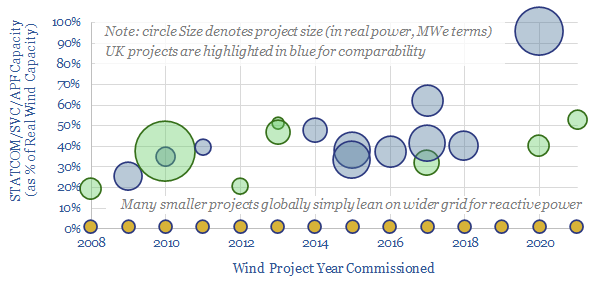
Wind and solar have so far leaned upon conventional power grids. But larger deployments will increasingly need to produce their own reactive power; controllably, dynamically. Demand for STATCOMs & SVCs may thus rise 30x, to over $25-50bn pa. This 20-page note outlines the opportunity and who benefits?
Download
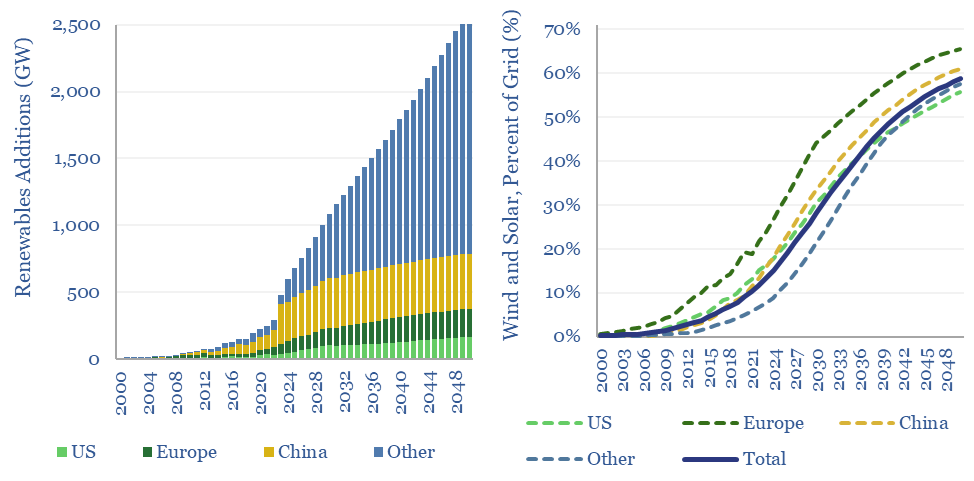
This model aims to calculate global wind and solar capacity additions. How many GW of new capacity would be needed for renewables to reach c25% of the global energy mix by 2050, up from 4% in 2021? In total energy terms, this means a 10x scale up, to 30,000 TWH of useful wind+solar energy in 2050. Gross global wind and solar capacity additions will surpass +1,000 GW by 2040.
Download
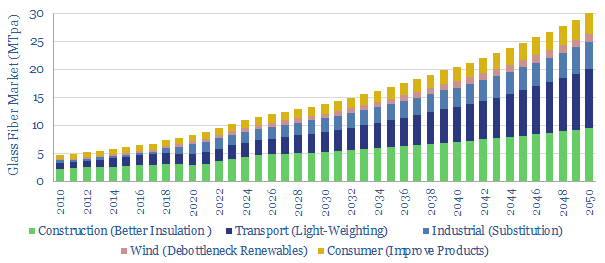
Glass fiber makes up 50% of a wind turbine blade, lightens vehicles and insulates homes for 30-70% energy savings. Hence we see demand rising 3.5x in the energy transition. To appraise the opportunity, this 13-page note assesses the market, costs, CO2 intensity and leading companies.
Download
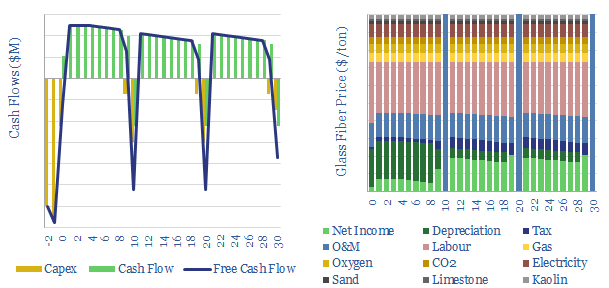
This data-file models the economics of producing glass fiber, the key component in fiberglass for wind turbines; but also a light-weight insulating material. Marginal cost is likely $2,000/ton, with a CO2 intensity of 1.5 tons/ton. Some Chinese product is 50% cheaper but 2x more CO2 intensive.
Download
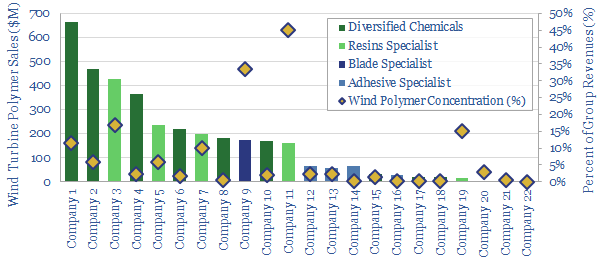
This data-file tabulates details for 20 companies that make epoxy- or polyurethane resins and adhesives, especially those that feed into the construction of wind turbines. We think there are 5 public companies ex-China with 5-35% exposure to this sub-segment of the wind industry.
Download
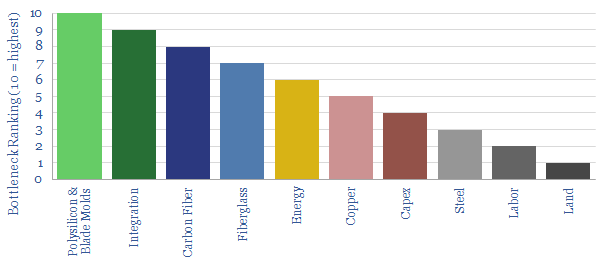
How fast can wind and solar accelerate, especially if energy shortages persist? This 11-page note reviews the top ten bottlenecks. Seven value chains will tighten enormously in the coming years. Paradoxically, however, ramping renewables could exacerbate near-term energy shortages.
Download
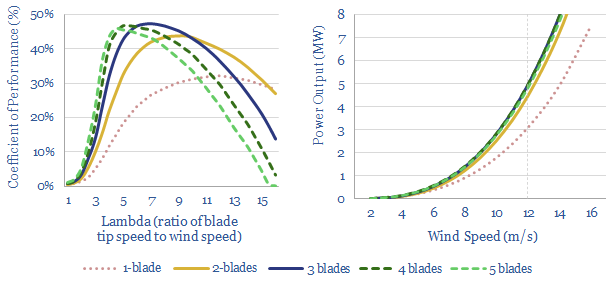
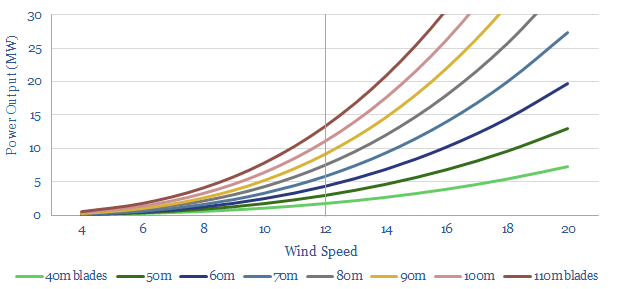
This data-file is an overview of wind power physics. Specifically, how is the power of a wind turbine calculated, in MW, as a function of wind speed, blade length, blade number, rotational speed (in RPM) and other efficiency factors (lambda). A large, modern offshore wind turbine will have 100m blades and surpass 10MW power outputs.
Download
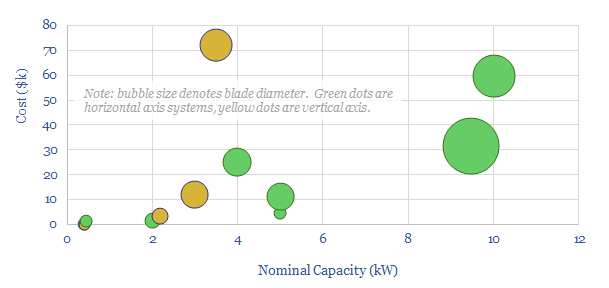
This screen compares the offerings of a dozen small-scale wind turbine providers, with power ratings below 30kW, for residential energy generation. Costs range from $1,000-6,000/kW.ย The three key challenges are performance, relaibility and cost.
Download
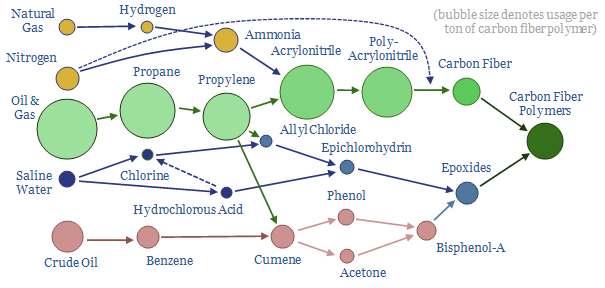
Energy transition will catapult carbon fiber demand upwards from today's 120kTpa baseline, across wind turbine blades, more efficient vehicles and hydrogen tanks. Hence this 16-page note explores opportunities, economics, CO2 intensity and leading companies.ย
Download
Carbon fiber production costs are estimated at $25/kg in this data-file, in order to generate a 10% IRR at a new world-scale carbon fiber plant. Energy economics are broken down across the value chain. The production process will likely emit 30 tons of CO2 per ton of carbon fiber if powered by a mixture of gas and electricity.
Download
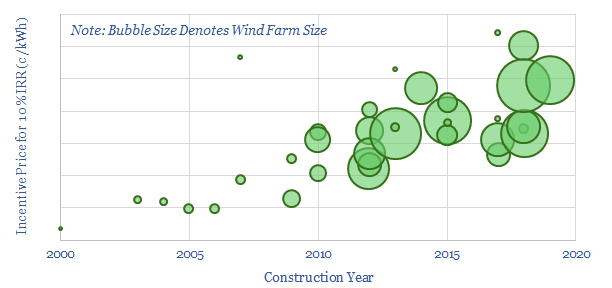
Some commentators expect the levelized costs of offshore wind to fall another two-thirds by 2050. The justification is some eolian equivalent of Mooreโs Law. Our 16-page report draws five contrasts. Wind costs are most likely to move sideways, even as the industry builds larger turbines. Implications for developers are explored.
Download
Siemens Gamesa is a leader in offshore wind, pushing the boundaries towards a 14MW turbine with an incredible 222m rotor diameter. Our main debate from reviewing its patents is whether the engineering challenges of large turbines is consistent with deflation expectations.
Download
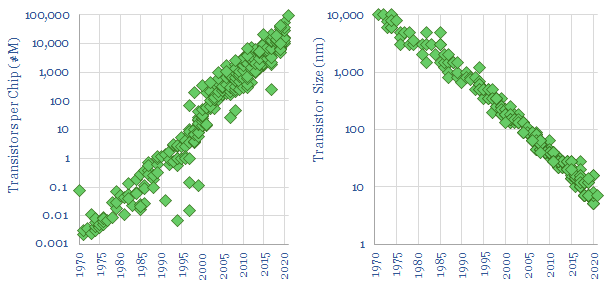
Mooreโs law entails that computing performance doubles every 18-months. Which has held true since 1965. This exponential progress has been driven by three positive feedback loops. Can these same feedback loops unlock a similar trajectory for new energies costs? We find mixed evidence.
Download
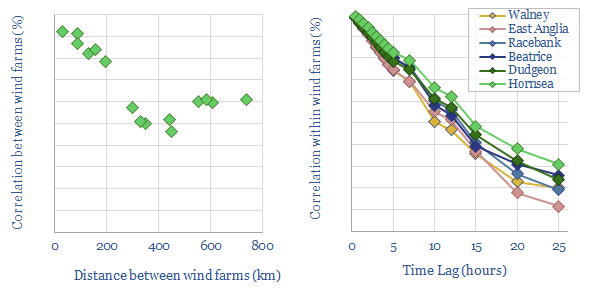
This data-file examines the correlations between different wind farms' generation rates. The output from individual wind farms is 67% correlated on average, at any given point in time, and as high as 90% with a 100km x 100km area. Auto-correlation was also high, as windy/non-windy periods can last 2-10 days.
Download
The levelized cost of onshore wind is estimated in this economic model, at 5-7c/kWh to generate 5-10% levered IRRs on new wind project costing $1,000-3,000/kW. The model also contains a granular breakdown of wind capex costs, operating costs, and other economic assumptions for wind projects.
Download
UK wind power has almost trebled since 2016. But its output is volatile, now varying between 0-50% of the total grid. Hence this 14-page note assesses the volatility, using granular, hour-by-hour data from 2020, to outline which backup opportunities are best-placed.
Download
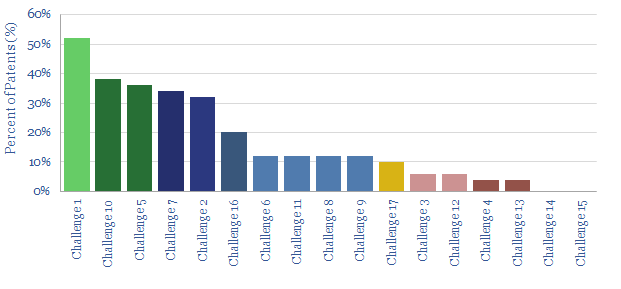
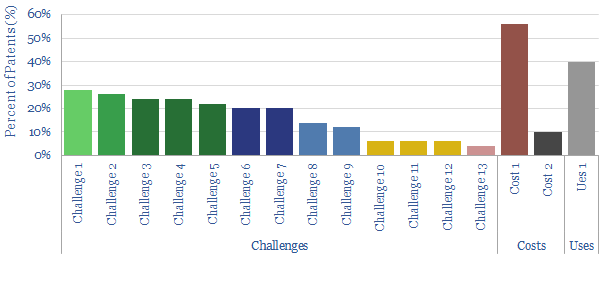
A dozen challenges for floating offshore wind projects are ranked in this 4-page note, by reviewing 50 recent patents across the industry. We model these challenges are likely to double capex and levelized costs, compared with traditional offshore wind. The potential for floating offshore wind is also location dependent.
Download
This data-file ranks the greatest challenges for the floating offshore wind industry, by reviewing 50 recent patents, filed by leading companies. The challenges are relatively immutable. They likely double capex and levelized costs, compared with traditional offshore wind.
Download
This data-file aggregates 2,000 patents filed by Vestas and compares them with 15,000 patents filed by competitors. Although other companies have made headlines with larger turbines, we find Vestas may have an edge overall, particularly in the category of operations, monitoring, maintenance and ensuring turbines' longevity.
Download
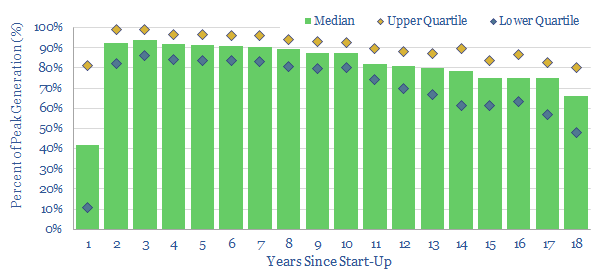
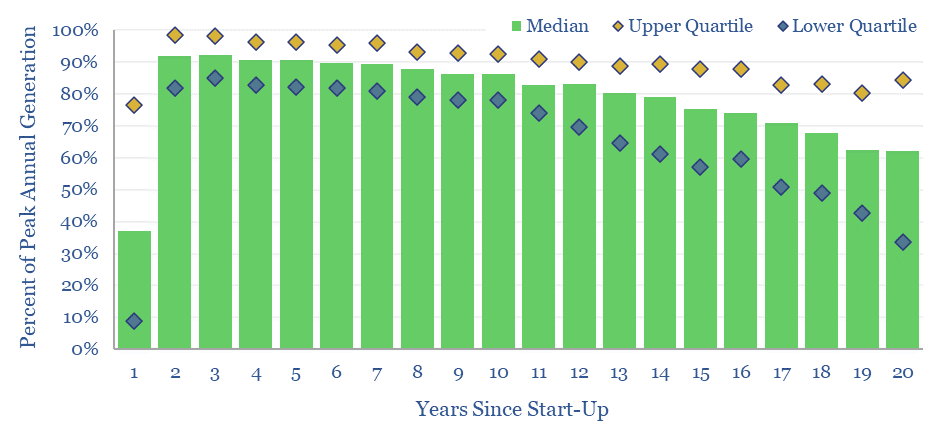
This 4-page PDF presents our conclusions from tabulating the ‘decline rates’ of 1,215 US wind power plants, which have reported data to the US EIA. US wind generation profiles are not dissimilar from well-managed oil and gas fields; some projects may suffer 2% lower IRRs versus forecasts if they have not factored in declines; and … Continue reading "Wind power: decline rate conclusions?"
Download
This data-file aggregates wind generation by facility, across the US, at 1,400 wind farms, going back 20-years. Wind power decline rates average 1% per year, then possibly accelerate to 3-4% per year in years 10-20. However wind generation is also noisy, typically varying +/- 7% YoY. This matters for the economics and ultimate share of wind.
Download
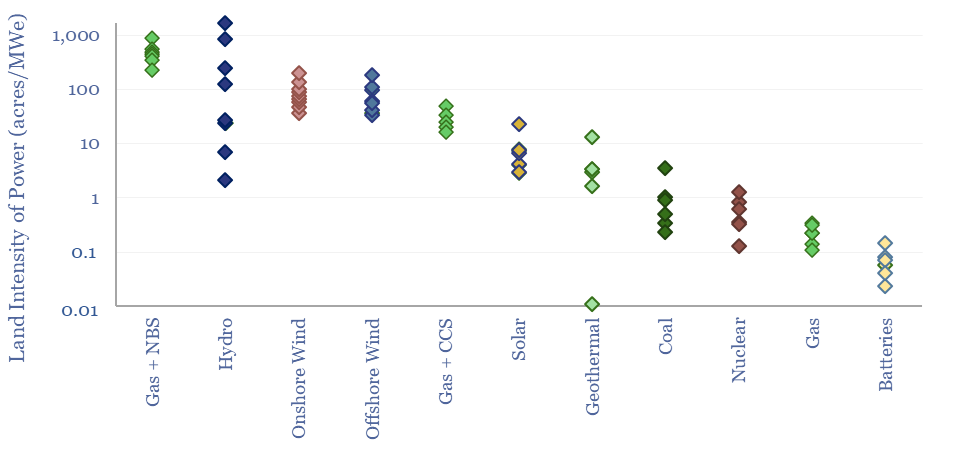
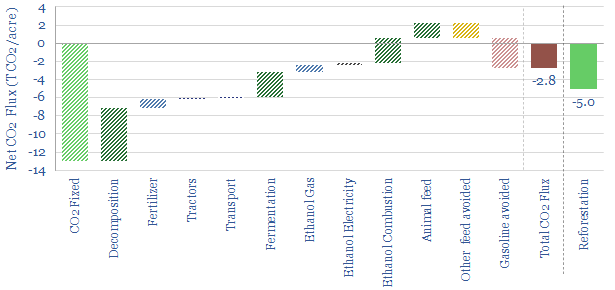
This data-file compares the land intensity of energy technologies and energy transition technologies. Land use is estimated in acres per MW of power generation, or in tons of CO2-equivalents abated per acre per year. Numbers vary by an order of magnitude. Data are sourced from technical papers and our broader work.
Download
This data-file tabulates the capex costs of 35 offshore wind projects in the UK, with 8.5GW of capacity, which have been installed since the year 2000.ย There is little evidence for deflation. Rather, breakeven power prices appear to have risen at a 2.5% CAGR over the past decade. Our modelling is show in the data-file.
Download
This data-file tracks wind turbine manufacturers, their market shares and their margins over time. By 2024, fifteen companies account for 95% of global wind turbine installations. This includes large Western incumbents, and a growing share for Chinese entrants, which now comprise over half of the total market, limiting sector-wide operating margins to c3%.
Download
This data-file contains a simple model for how wind speeds and wind power co-vary with altitude. 2x greater power could likely be harnessed by a kite at 300m than a similar-sized turbine at 80m.ย
Download
Nuclear Research
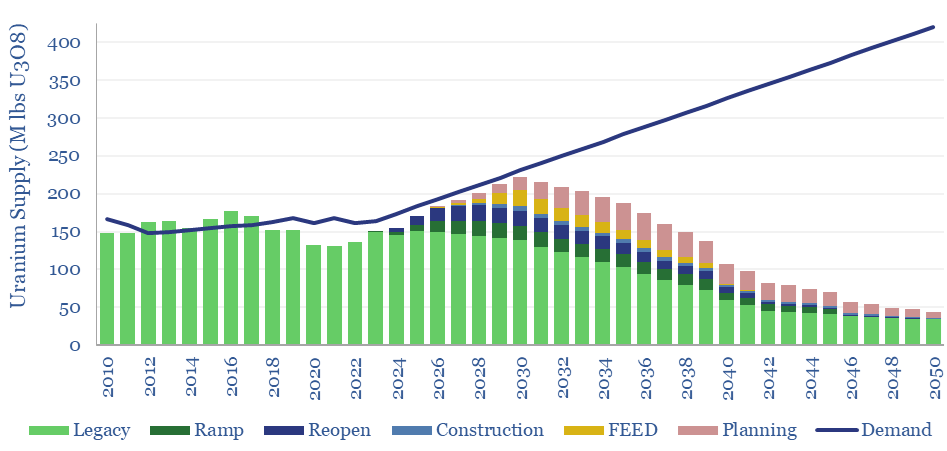
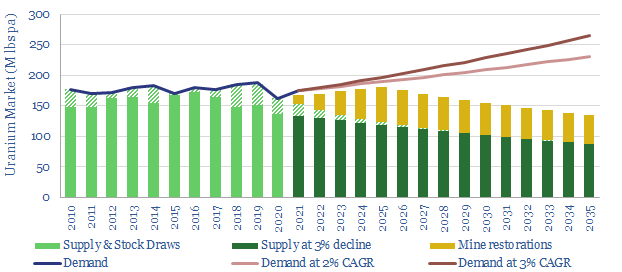
Our global uranium supply-demand model sees the market 5% under-supplied through 2030, including 7% market deficits at peak in 2025, as demand ramps from 165M lbs pa to 230M lbs pa in 2030. This is even after generous risking and no room for disruptions. What implications for broader power markets, decarbonization ambitions, and uranium prices?
Download
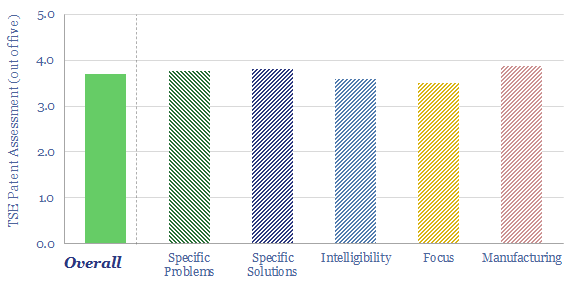
Oklo is a next-generation nuclear company, based in California, recently going public via SPAC at a $850M valuation, backed by Sam Altman, of Y-Combinator and OpenAI fame. Oklo's fast reactor technology absorbs high energy neutrons in liquid metal and targets ultimate costs of 4c/kWh. What details can we infer from assessing Oklo's patents, and can we de-risk the technology in our roadmap to net zero?
Download
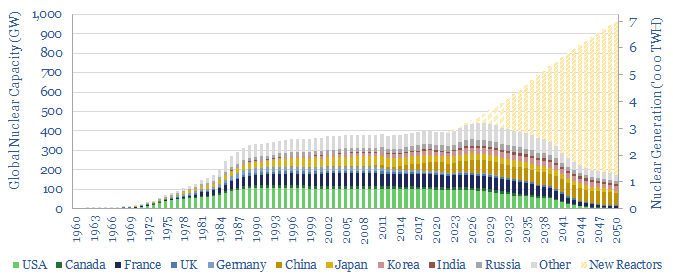
400 GW of nuclear reactors produce 2,800TWH of zero carbon electricity globally each year. But the numbers have been stagnant for two decades. This is now changing. This 14-page note explains why. We expect a >3% CAGR through 2030, and hope for a 2.5x ramp through 2050. A โnuclear renaissanceโ helps the energy transition.
Download
How much nuclear capacity would need to be constructed in our roadmap to net zero? This breakdown of global nuclear capacity forecasts that 30 GW of new reactors must be brought online each year through 2050, if the nuclear industry was to ramp up to 7,000 TWH of generation by 2050, which would be 6% of total global energy. There is a precedent. Delaying shutdowns helps too.
Download
X-Energy is a next-generation nuclear company, progressing a demonstration project in Washington State, due to start up in 2027. The key innovation is using TRISO fuels, whose manufacturing is locked up with a concentrated patent library. Long-term costs are suggested at 6c/kWh.
Download
TerraPower is one of the most active next-generation nuclear companies, with funding from Bill Gates, and 600 engineers working towards the first, 345MWe Natrium reactor before 2030. We could not entirely de-risk a "breakthrough" due to the breadth and novelty of its patents.
Download
Terrestrial Energy is a next-generation nuclear fission company, aiming to build a small modular reactor: specifically a 2 x 195MWe Integral Molten Salt Reactor with ultimate costs below $3,000/kWe, yielding levelized costs of 5-7c/kWh. 80 patents lock up 8 core innovations in a high-quality library that helps de-risk the potential.
Download
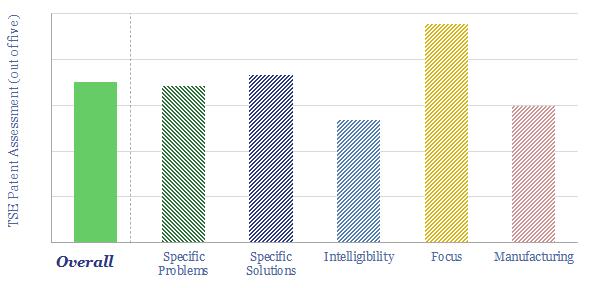
General Fusion is developing a magnetized target fusion reactor, compressing plasma via high-pressure pistons. It hopes to commercialize 100-200MWe fusion reactors with 5-6.5c/kWh levelized costs of electricity in the late 2020s. Our patent de-risks several innovations. Although complexity is high and we note four residual risks for the technology.
Download
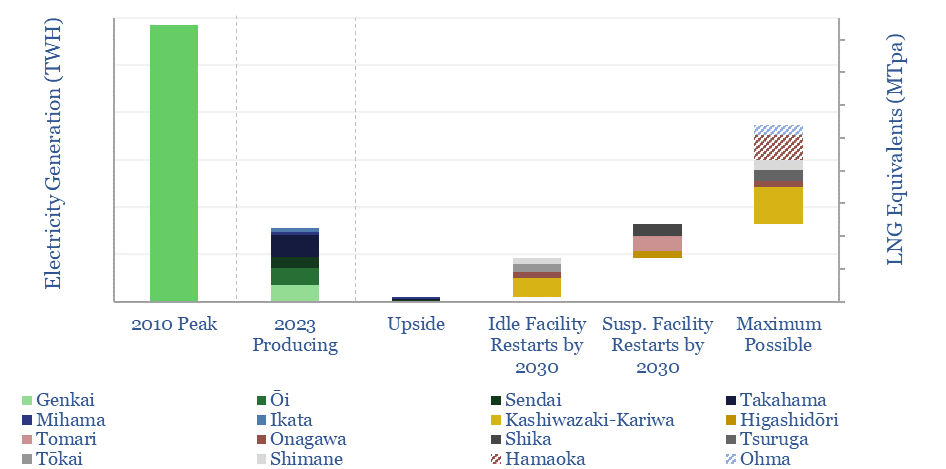
This data-file on ย looks through 17 major nuclear plants in Japan with 45GW of operable capacity, covering the key parameters and re-start news on each facility. Japan's nuclear restart had ramped output back to 78TWH pa by 2023, and may rise by a further 100 TWH by 2030, to meet targets for 20% nuclear in the country's generation mix.
Download
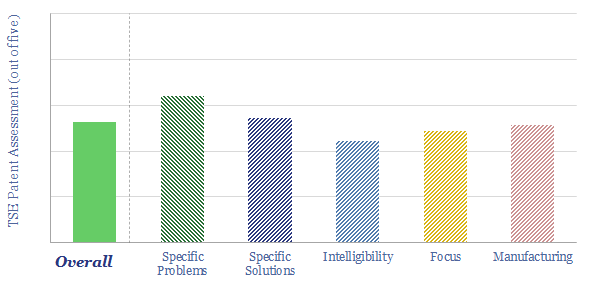
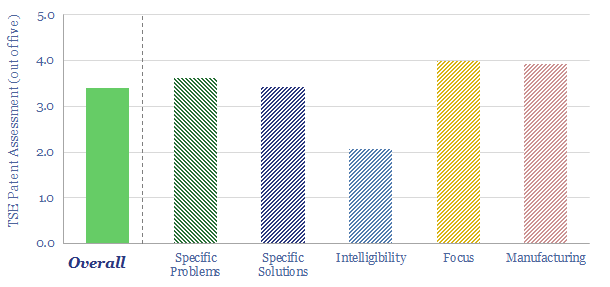
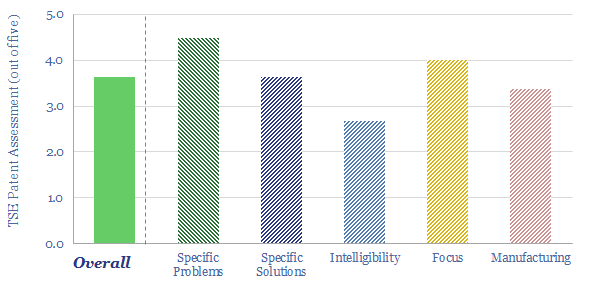
Our patent review found CFS to have a high-quality patent library, of specific, intelligible, commercially-minded innovations to densify the magnets that would confine plasma in a tokamak for nuclear fusion. Specific details, and minor hesitations are in the data-file.ย
Download
Nuclear fusion could provide a limitless supply of zero-carbon energy from the 2030s onwards. The goal of this 20-page note is simply to understand the challenges for fusion reactors, especially deuterium-tritium tokamaks. Innovations need to improve EROI, stability, longevity and costs.
Download
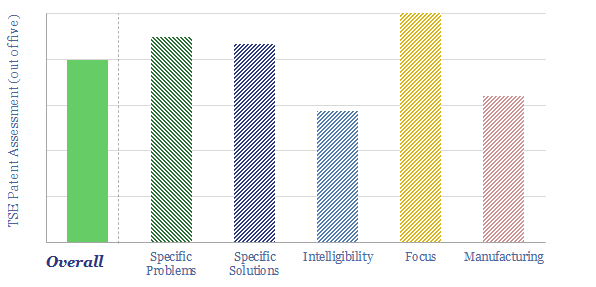
NuScale is developing a small modular nuclear reactor (SMR), producing 77MWe of power. It is the first SMR design to win US regulatory approval and the first plant is being built in Romania for 2028. NuScale's patents scored well on our framework.
Download
Nuclear power can backstop much volatility in renewables-heavy grids, for costs of 15-25c/kWh. This is at least 70% less costly than large batteries or green hydrogen, but could see less wind and solar developed overall. Our 13-page note reviews the opportunity.
Download
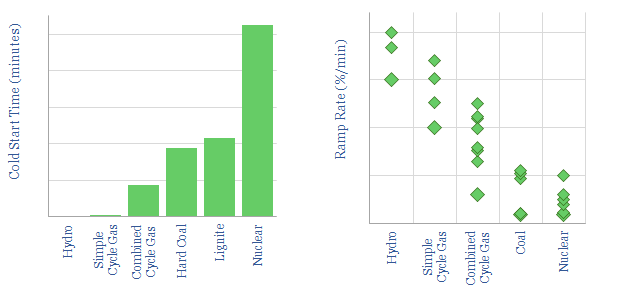
This data-file aggregates the ramp-up rates of power generation sources, as they start up from "cold", and then as they ramp up (in MW per minute). Hydro and simple cycle gas turbines are fastest, followed by CCGTS, coal and nuclear.
Download
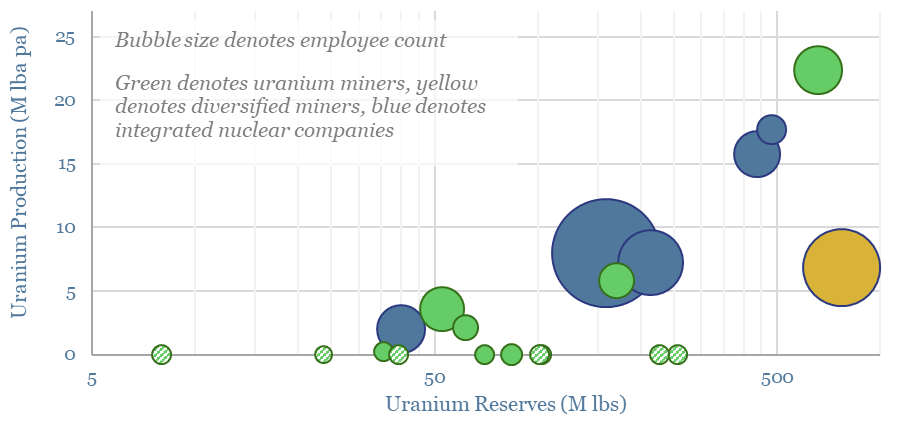
Uranium markets could be 50-75M lbs under-supplied by 2030. This deficit is deeper than other commodities in our roadmap toย net zero. Demand is driven by China, constructing reactors for 50-70% less than the West, yielding zero carbon power at 6-8c/kWh. This 18-page note presents the outlook and screens uranium miners.
Download
This data-file disaggregates the marginal costs of a new uranium mine, as a simple function of uranium prices, ore grade, capex and opex. Our base case is a marginal cost of $60/lb for a 10% IRR. Cash costs range from $7-40/lb. But lower ore grades can easily require $90/lb uranium to justify investment.
Download
Global uranium production is broken down by company and by country in this data-file, which also screens 20 of the most noteworthy companies in uranium mining, the reserves, production and operational details. This matters as another contracting cycle is underway in the uranium industry, due to rising power demand, next-gen nuclear, but also supply disruptions linked to geopolitics.
Download
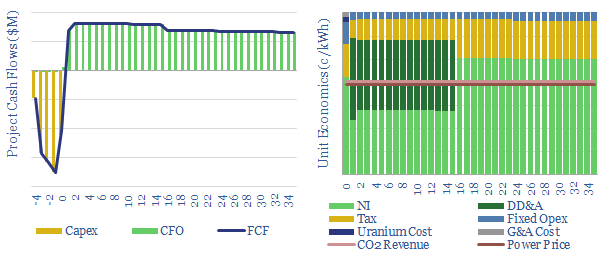
This data-file models the costs of nuclear power project, based on technical papers and past projects around the industry. An up-front capex cost of $6,000/kW might yield a levelized cost of 15c/kWh. But 6-10c/kWh is achievable via a renaissnace in next-generation nuclear.
Download
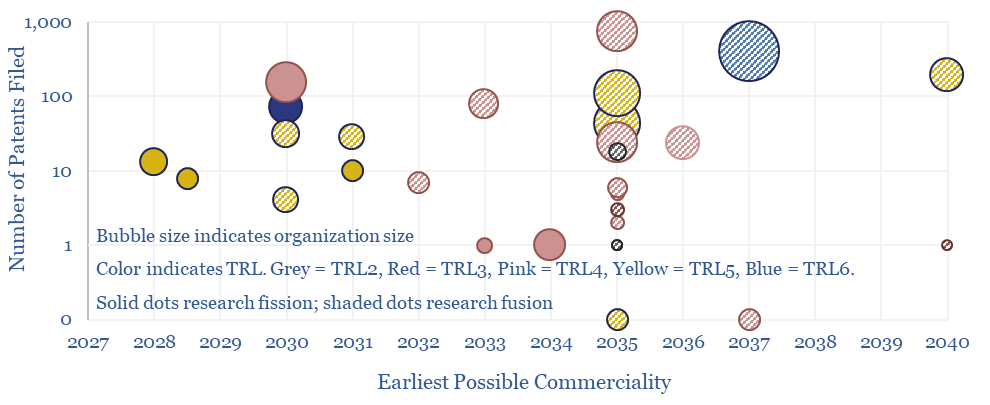
This data-file screens c30 next-generation nuclear companies at the cutting edge of fission and fusion technology. The median one employs 100 people, is developing a 150MWe reactor, and couldย reachย commerciality by 2035. But how has this landscape of companies progressed in the past few years?
Download
Batteries Research
Thunder Said Energy is a research firm focused on economic opportunities that can drive the energy transition. Our top ten conclusions into batteries and energy storage are summarized below, looking across all of our research.
Download
This 9-page study finds unexpectedly strong support for co-deploying grid-scale batteries together with solar. The resultant output is stable, has synthetic inertia, is easier to interconnect in bottlenecked grids, and can be economically justified. What upside for grid-scale batteries?
Download
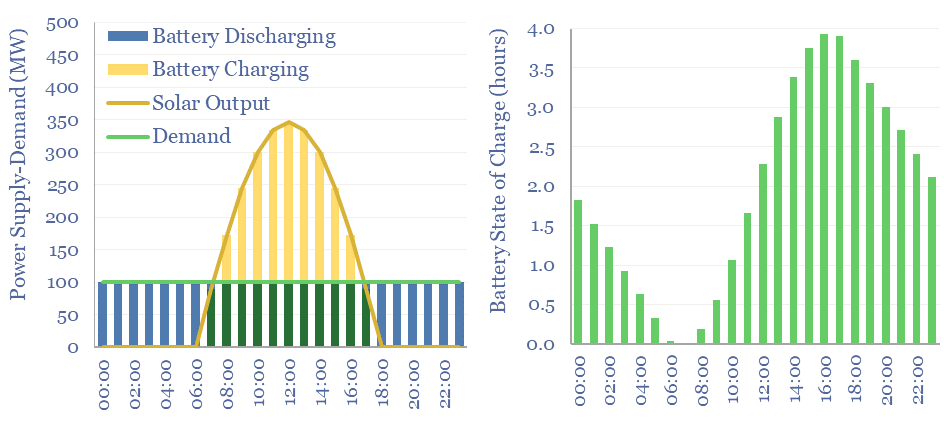
Solar+battery co-deployments allow a large and volatile solar asset to produce a moderate-sized and non-volatile power output, during 40-50% of all the hours throughout a calendar year. The smooth output is easier to integrate with power grids, including with a smaller grid connection. The battery will realistically cycle 100-300 times per year.
Download
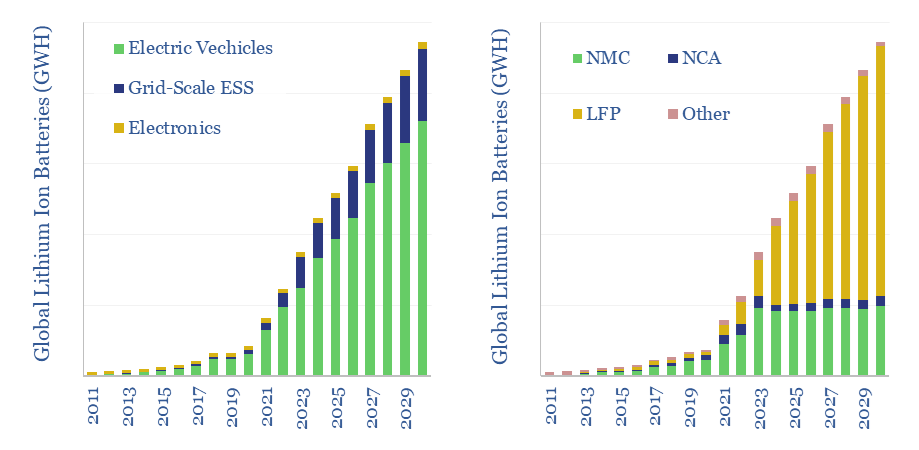
The lithium ion battery market reached 900GWH in 2023, representing 7x growth in the past half-decade since 2018, and 20x growth in the past decade since 2013. Volumes treble again by 2030. This data-file breaks down global ithium ion battery volumes by chemistry and be end use. A remarkable shift to LFP is underway, and NMC sales may even have peaked.
Download
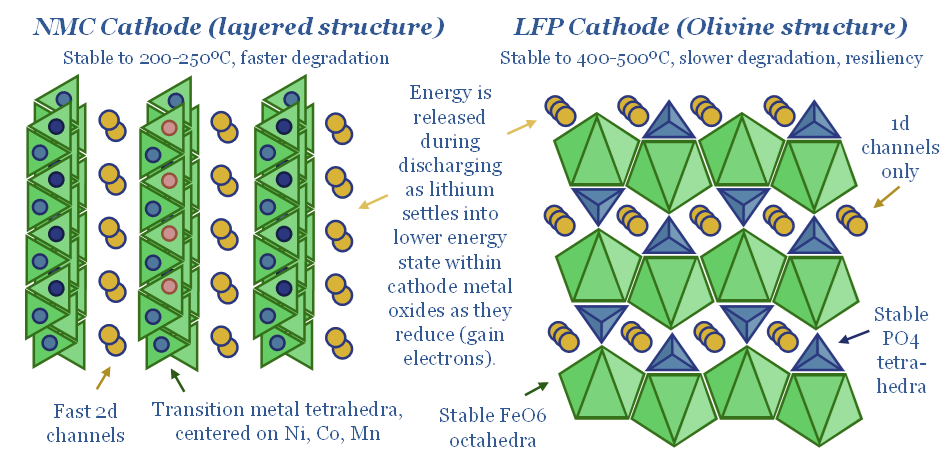
LFP batteries are fundamentally different from incumbent NMC cells: 2x more stable, 2x longer-lasting, $15/kWh cheaper reagents, $5/kWh cheaper manufacturing, and $25/kWh cheaper again when made in China. This 15-page report argues LFP will dominate future batteries, explores their costs, and draws implications for EVs and renewables.
Download
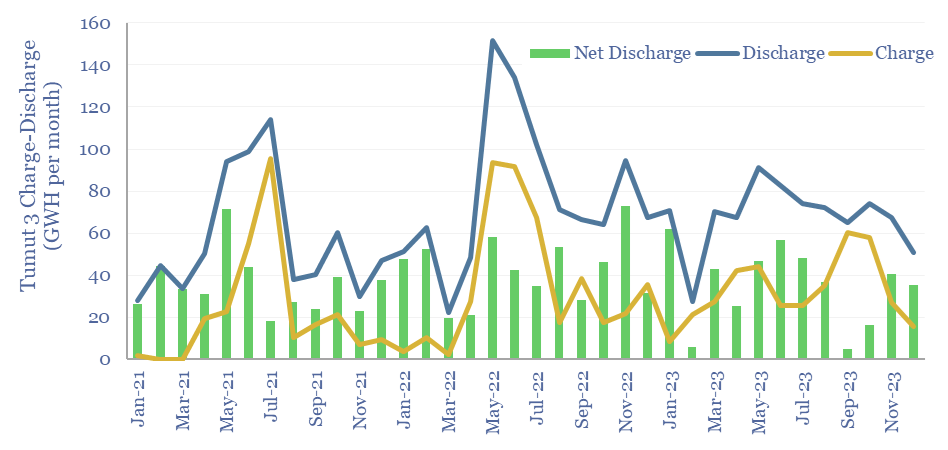
Pumped hydro facilities can provide long-duration storage, but the utilization rate is low, and thus the costs are high, according to today's case study within the Snowy hydro complex in Australia. Tumut-3 can store energy for weeks-months, then generate 1.8 GW for 40+ hours, but it is only charging/dischaging at 12% of its nameplate capacity.
Download
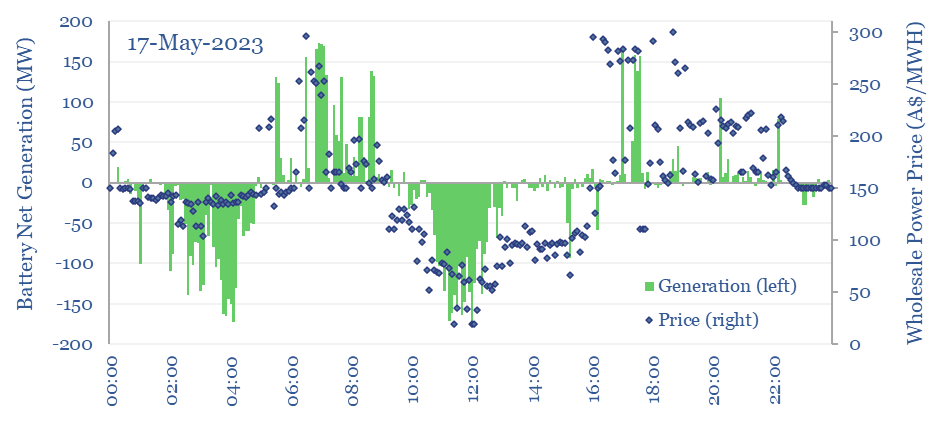
Grid-scale batteries are not simply operated to store up excess renewables and move them to non-windy and non-sunny moments, in order to increase reneawble penetration rates. Their key practical rationale is providing short-term grid stability to increasingly volatile grids that need 'synthetic inertia'. Their key economic rationale is arbitrage. Numbers are borne out by our case study into battery operations.
Download
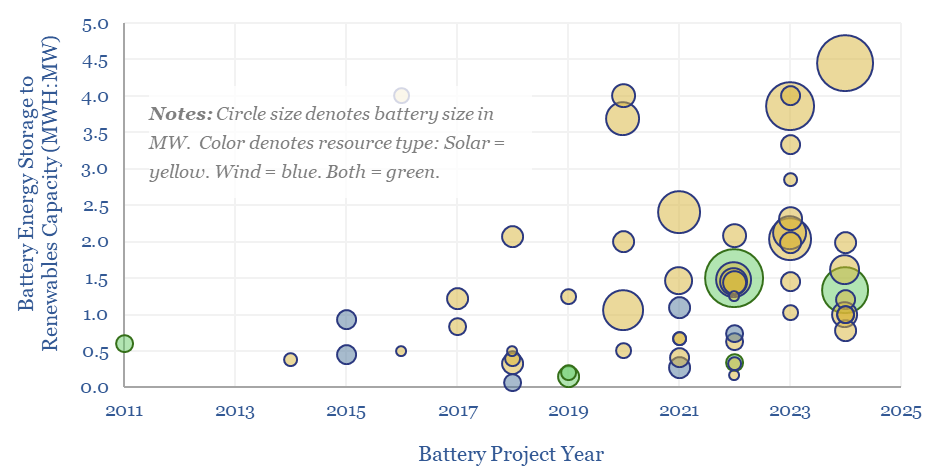
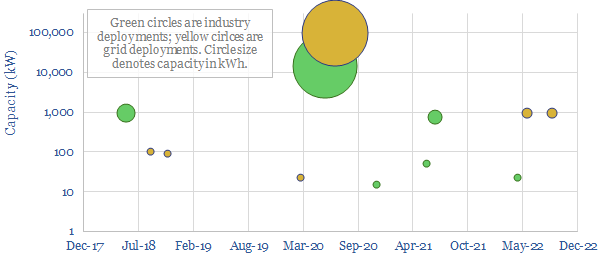
More and more renewables plus batteries projects are being developed as grids face bottlenecks? On average, projects in 2022-24 supplemented each MW of renewables capacity with 0.5MW of battery capacity, which in turn offered 3.5 hours of energy storage per MW of battery capacity, for 1.7 MWH of energy storage per MW of renewables.
Download
Our base case estimates for Compressed Air Energy Storage costs require a 26c/kWh storage spread to generate a 10% IRR at a $1,350/kW CAES facility, with 63% round-trip efficiency, charging and discharging 365 days per year. Our numbers are based on top-down project data and bottom up calculations, both for CAES capex (in $/kW) and CAES efficiency (in %) and can be stress-tested in the model. What opportunities?
Download
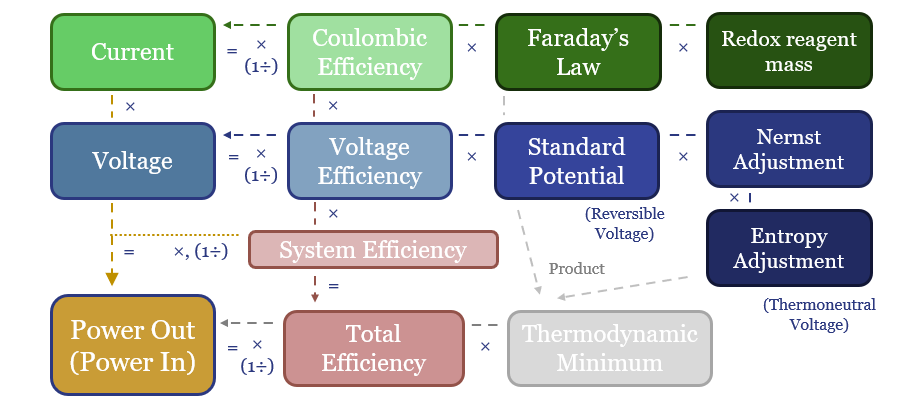
Batteries, electrolysers and cleaner metals/materials value chains all hinge on electrochemistry. Hence this 19-page note explains the energy economics from first principles. The physics are constructive for lithium and next-gen electrowinning, but perhaps challenge green hydrogen aspirations?
Download
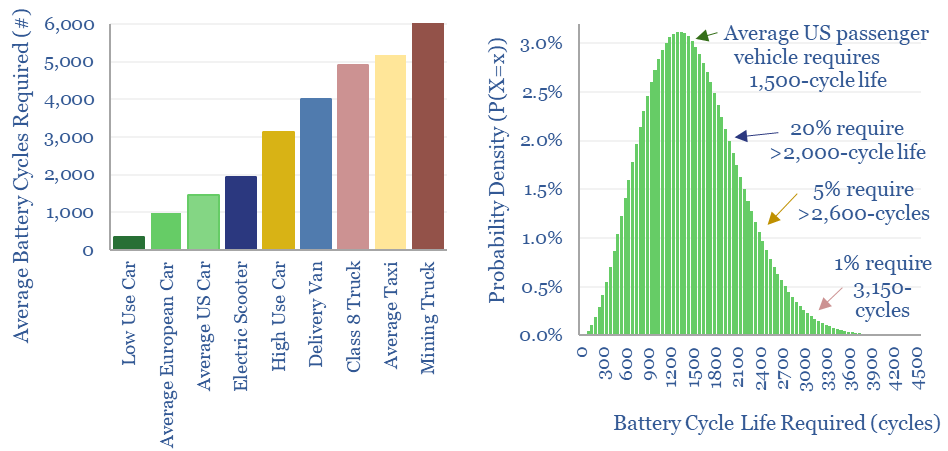
Electric vehicle battery life will realistically need to reach 1,500 cycles for the average passenger vehicle, 2,000-3,000 cycles after reflecting a margin of safety for real-world statistical distributions, and 3,000-6,000 cycles for higher-use commercial vehicles. This means lithium ion batteries may be harder to displace with novel chemistries?
Download
Thermal energy storage will outcompete other batteries and hydrogen for avoiding renewable curtailments and integrating more solar? Overlooked advantages are discussed in this 21-page report, plus a fast-evolving company landscape. What implications for solar, gas and industrial incumbents?
Download
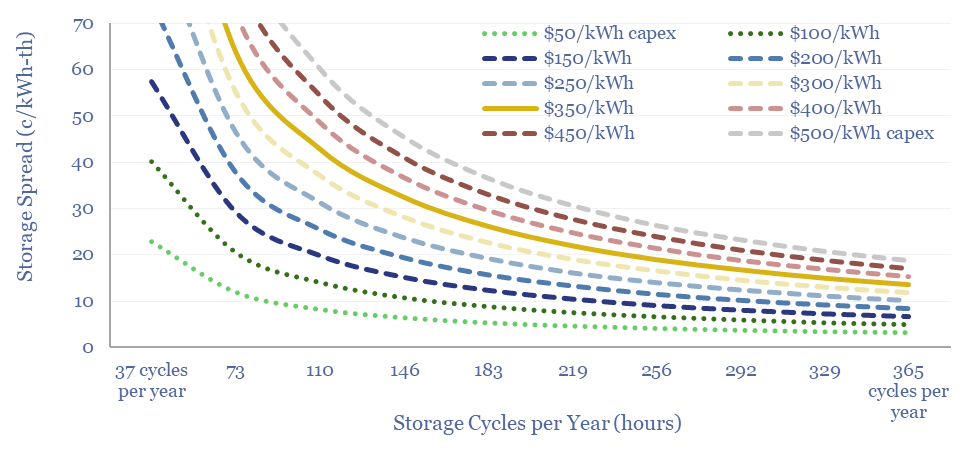
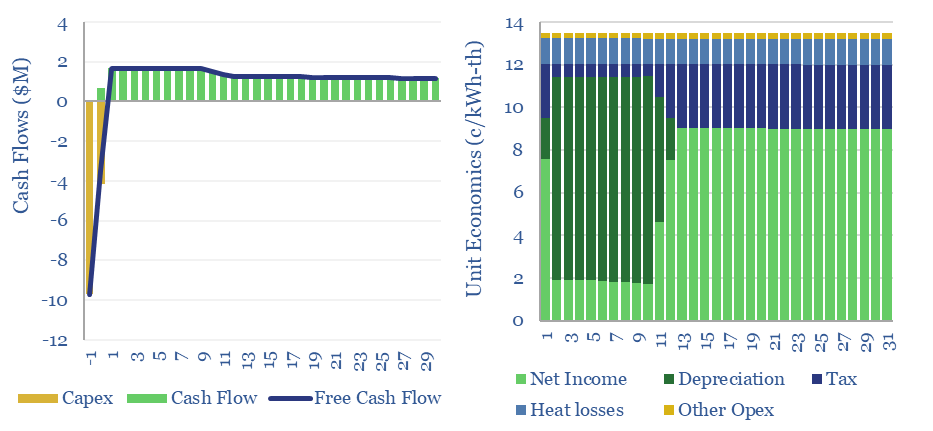
This data-file captures the costs of thermal energy storage, buying renewable electricity, heating up a storage media, then releasing the heat for industrial, commercial or residential use. Our base case requires 13.5 c/kWh-th for a 10% IRR, however 5-10 c/kWh-th heat could be achieved with lower capex costs.
Download
How much wind, solar and/or batteries are required to supply a stable power output, 24-hours per day, 7-days per week, or at even longer durations? This data-file stress-tests different scenarios, with each 1MW of average load requiring at least 3.5MW of solar and 3.5MW of lithium ion batteries, for a total system cost of at least 18c/kWh, and up to 800c/kWh.
Download
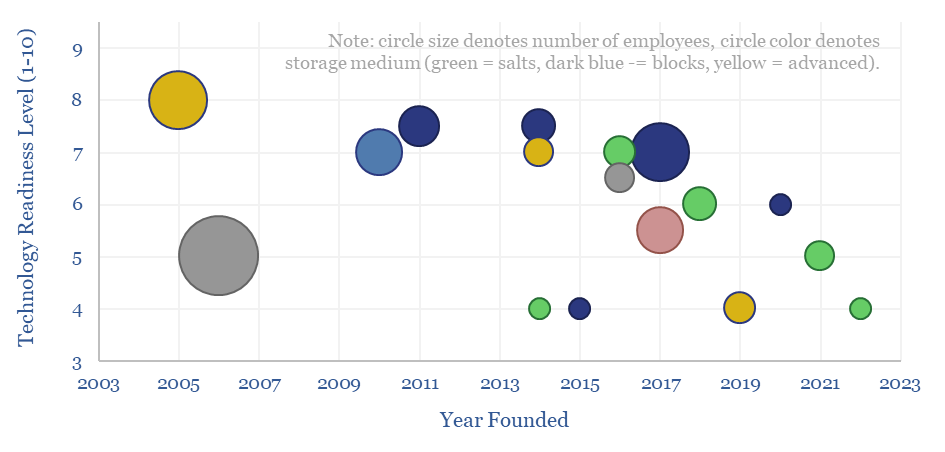
This data-file is a screen of thermal energy storage companies, developing systems that can absorb excess renewable electricity, heat up a storage medium, and then re-release the heat later, for example as high-grade steam or electricity. The space is fast-evolving and competitive, with 17 leading companies progressing different solutions.
Download
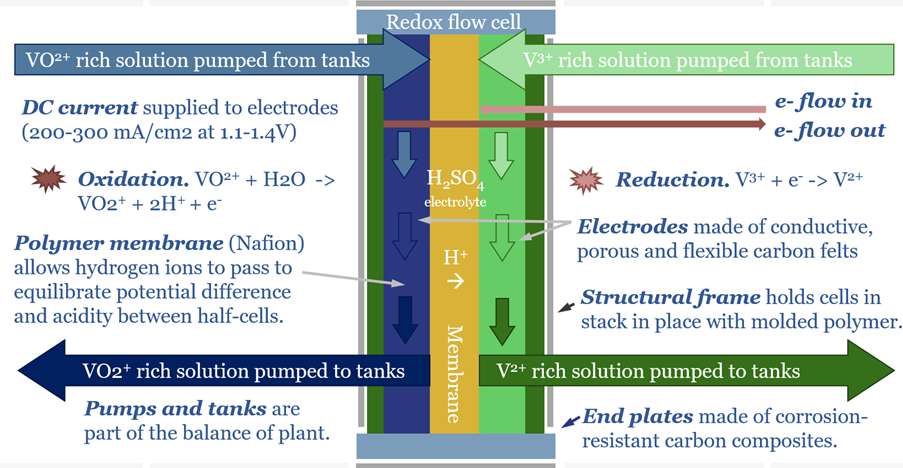
Redox flow batteries have 6-24 hour durations and require 15-20c/kWh storage spreads. They will increasingly compete with lithium ion batteries in grid-scale storage. Does this unlock a step-change for peak renewables penetration? Or create 3-30x upside for total global Vanadium demand? This 15-page note is our outlook for redox flow batteries.
Download
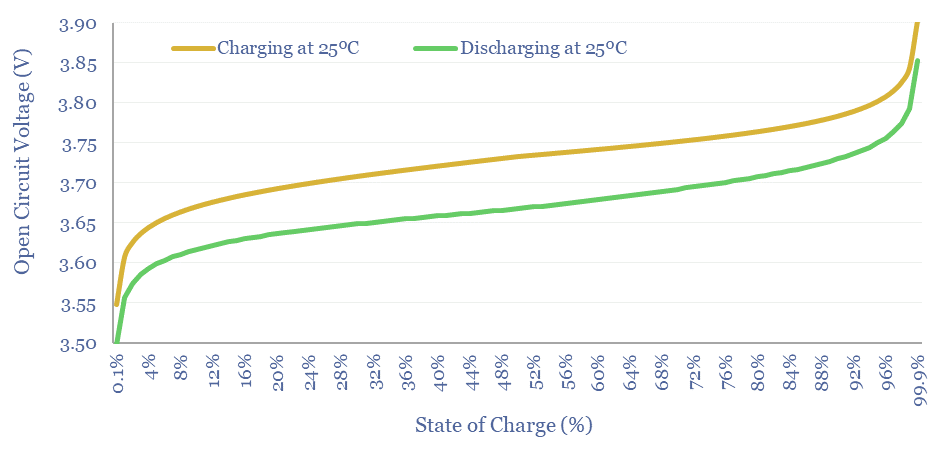
What determines the Voltage of an electrochemical cell, such as a lithium ion battery, redox flow battery, a hydrogen fuel cell, an electrolyser or an electrowinning plant? This note explains electrochemical voltages, from first principles, starting with Standard Potentials and the Nernst Equation.
Download
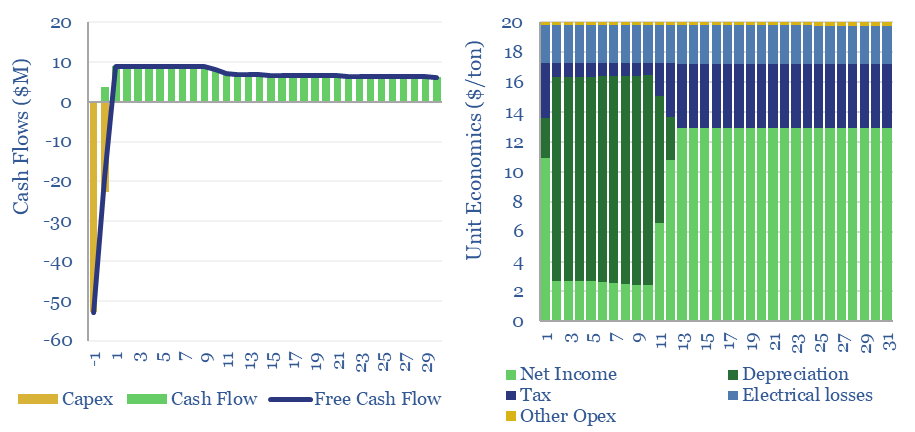
Redox flow battery costs are built up in this data-file, especially for Vanadium redox flow. In our base case, a 6-hour battery that charges and discharges daily needs a storage spread of 20c/kWh to earn a 10% IRR on $3,000/kW of up-front capex. Longer-duration redox flow batteries start to out-compete lithium ion batteries for grid-scale storage.
Download
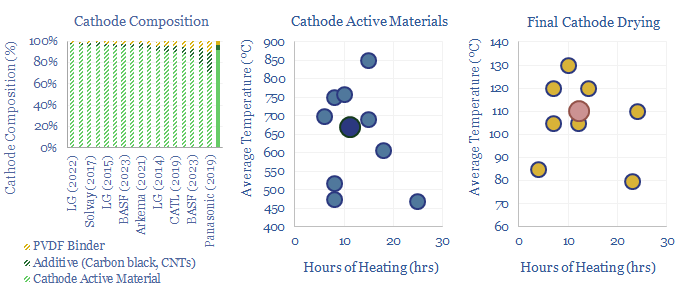
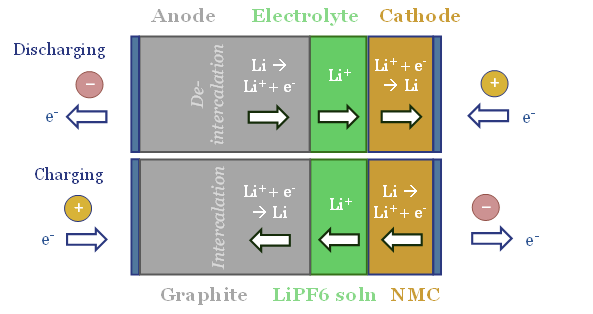
Lithium ion batteries famously have cathodes containing lithium, nickel, manganese, cobalt, aluminium and/or iron phosphate. But how are these cathode active materials manufactured? This data-file gathers specific details from technical papers and patents by leading companies such as BASF, LG, CATL, Panasonic, Solvay and Arkema.
Download
Solvay is a chemicals company with growing exposure to battery materials, especially the PVDF binders that hold together active materials in the electrodes. But also increasingly in electrolyte solvents, salts and additives. Interestingly, our patent review finds optimizations of this overall system can improve the longevity and energy density of batteries, which may also lead to consolidation across the battery supply chain?
Download
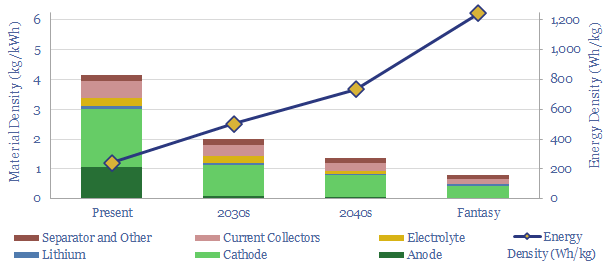
Today's lithium ion batteries have an energy density of 200-300 Wh/kg. I.e., they contain 4kg of material per kWh of energy storage. Technology gains can see lithium ion batteries' energy densities doubling to 500Wh/kg in the 2030s, trebling to 750 Wh/kg by the 2040s, and the best possible energy densities are around 1,250 Wh/kg. This is still 90% below hydrocarbons, at 12,000 Wh/kg.
Download
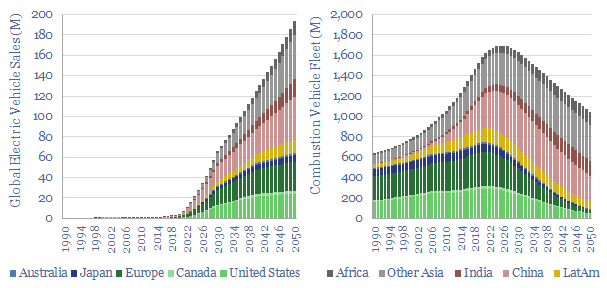
Electric vehicles are a world-changing technology, 2-6x more efficient than ICEs, but how quickly will they ramp up to re-shape global oil demand? This 14-page note finds surprising โstickinessโ. Even as EV sales explode to 200M units by 2050 (2x all-time peak ICE sales), the global ICE fleet may only fall by 40%. Will LT oil demand surprise to the upside or downside?
Download
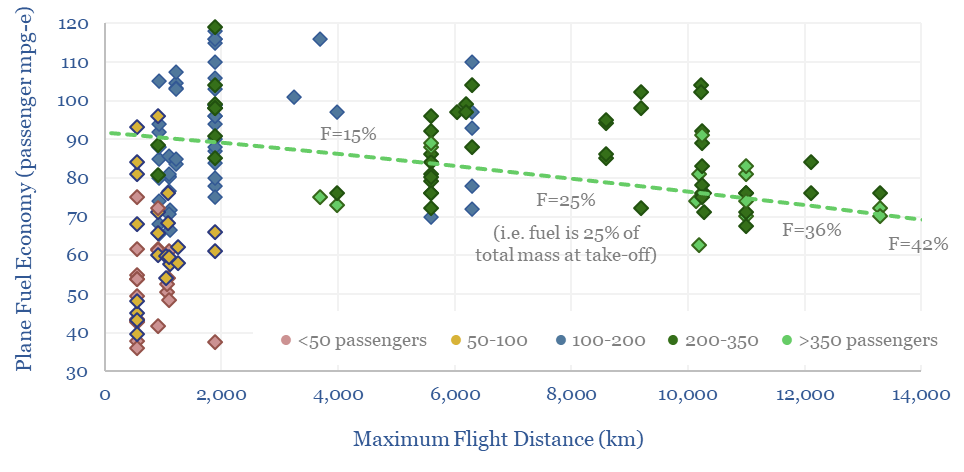
This data-file calculates the fuel economy of planes from first principles, using physics to calculate lift and drag, and comparing with actual data from aircraft manufacturers. The typical fuel economy of a plane is 80 passenger-mpg to carry 400 passengers, 8,000km at 900kmph, using jet fuel with 12,000 Wh/kg energy density. What sensitivities and decarbonization opportunities?
Download
Amprius is commercializing a lithium-ion battery with a near-100% silicon anode, yielding 80% higher energy density. It can achieve 80% charge within 6-minutes. The company is listed on NYSE. We have reviewed Amprius' silicon anode technology. The patent library is excellent, goes back to 2009 and has locked upon a specific design. This allows us to guess at costs, degradation and longevity.
Download
Hillcrest Energy Technologies is developing an ultra-efficient SiC inverter, which has 30-70% lower switching losses, up to 15% lower system cost, weight, size, and thus interesting applications in electric vehicles. How does it work and can we de-risk the technology?
Download
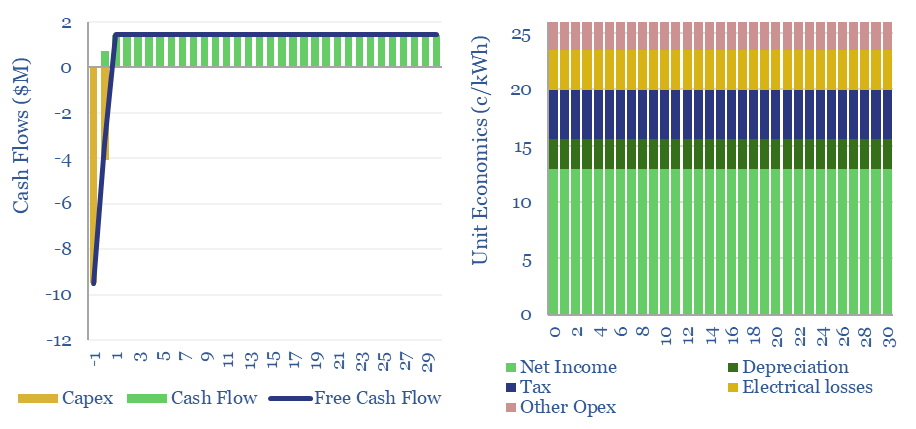
Grid-scale batteries are envisaged to store up excess renewable electricity and re-release it later. Grid-scale battery costs are modeled at 20c/kWh in our base case, which is the 'storage spread' that a LFP lithium ion battery must charge to earn a 10% IRR off $1,200/kW installed capex costs. Other batteries can be compared in the data-file.
Download
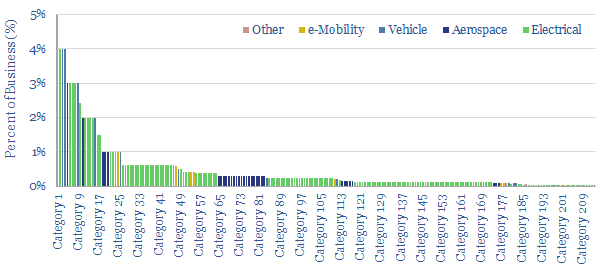
Eaton is a power-electronics super-giant, listed in the US, employing 86,000 people, generating $20bn per year of revenues. We have aimed to guess how $20bn pa of net sales is distributed across 200 different product categories. 75% is exposed to power-electronics, with tailwinds in the energy transition.
Download
This 14-page note offers five rules of thumb to maximize the longevity of lithium-ion batteries, in grid-scale storage and electric vehicles. The data suggest hidden upside in the demand for batteries, for lithium and high-quality power electronics, especially if batteries are to backstop renewables.
Download
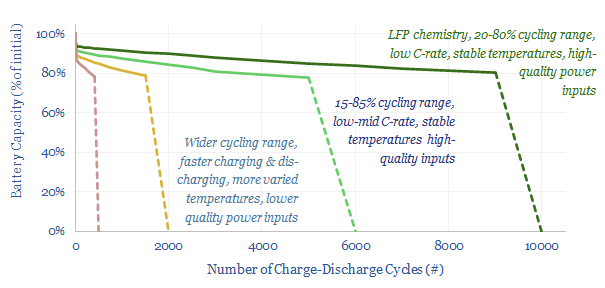
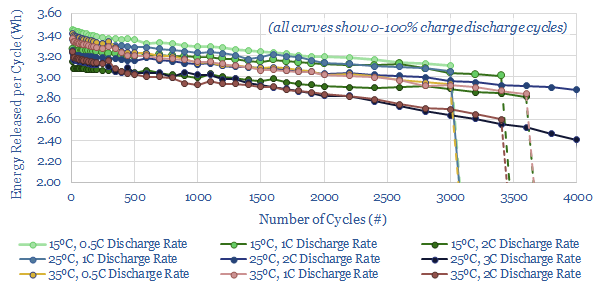
Lithium ion battery degradation rates vary 2-20% per 1,000 cycles. And lithium ion batteries last from 500 - 20,000 cycles. We have aggregated 7M data-points from laboratory tests, in order to quantify what drives battery degradation. LFP chemistry, low C-rates, stable temperatures and limited cycling all help.
Download
Supercapacitors are well suited to smoothing short-term volatility in increasingly renewables-heavy grids. Typical systems are 10kW-10MW, 1M chage-discharge cycles, 5-30 seconds storage and $30/kW costs. Expect the market to surprise to the upside, especially in combination with other power-electronics. Who benefits?
Download
Powin commercializes energy storage hardware and software. Its LFP battery system is 30% more compact than peers, at 200 MWH/acre, and modular, meaning it may be 50% faster to install. Our patent review finds a moat around specific process improvements, to help back up the short-term volatility of solar and wind.
Download
The solar energy reaching a given point on Earthโs surface varies by +/- 6% each year. These annual fluctuations are 96% correlated over tens of miles. And no battery can economically smooth them. Solar heavy grids may thus become prone to unbearable volatility. Our 17-page note outlines this important challenge, and finds that the best solutions are to construct high-voltage interconnectors and keep power grids diversified.
Download
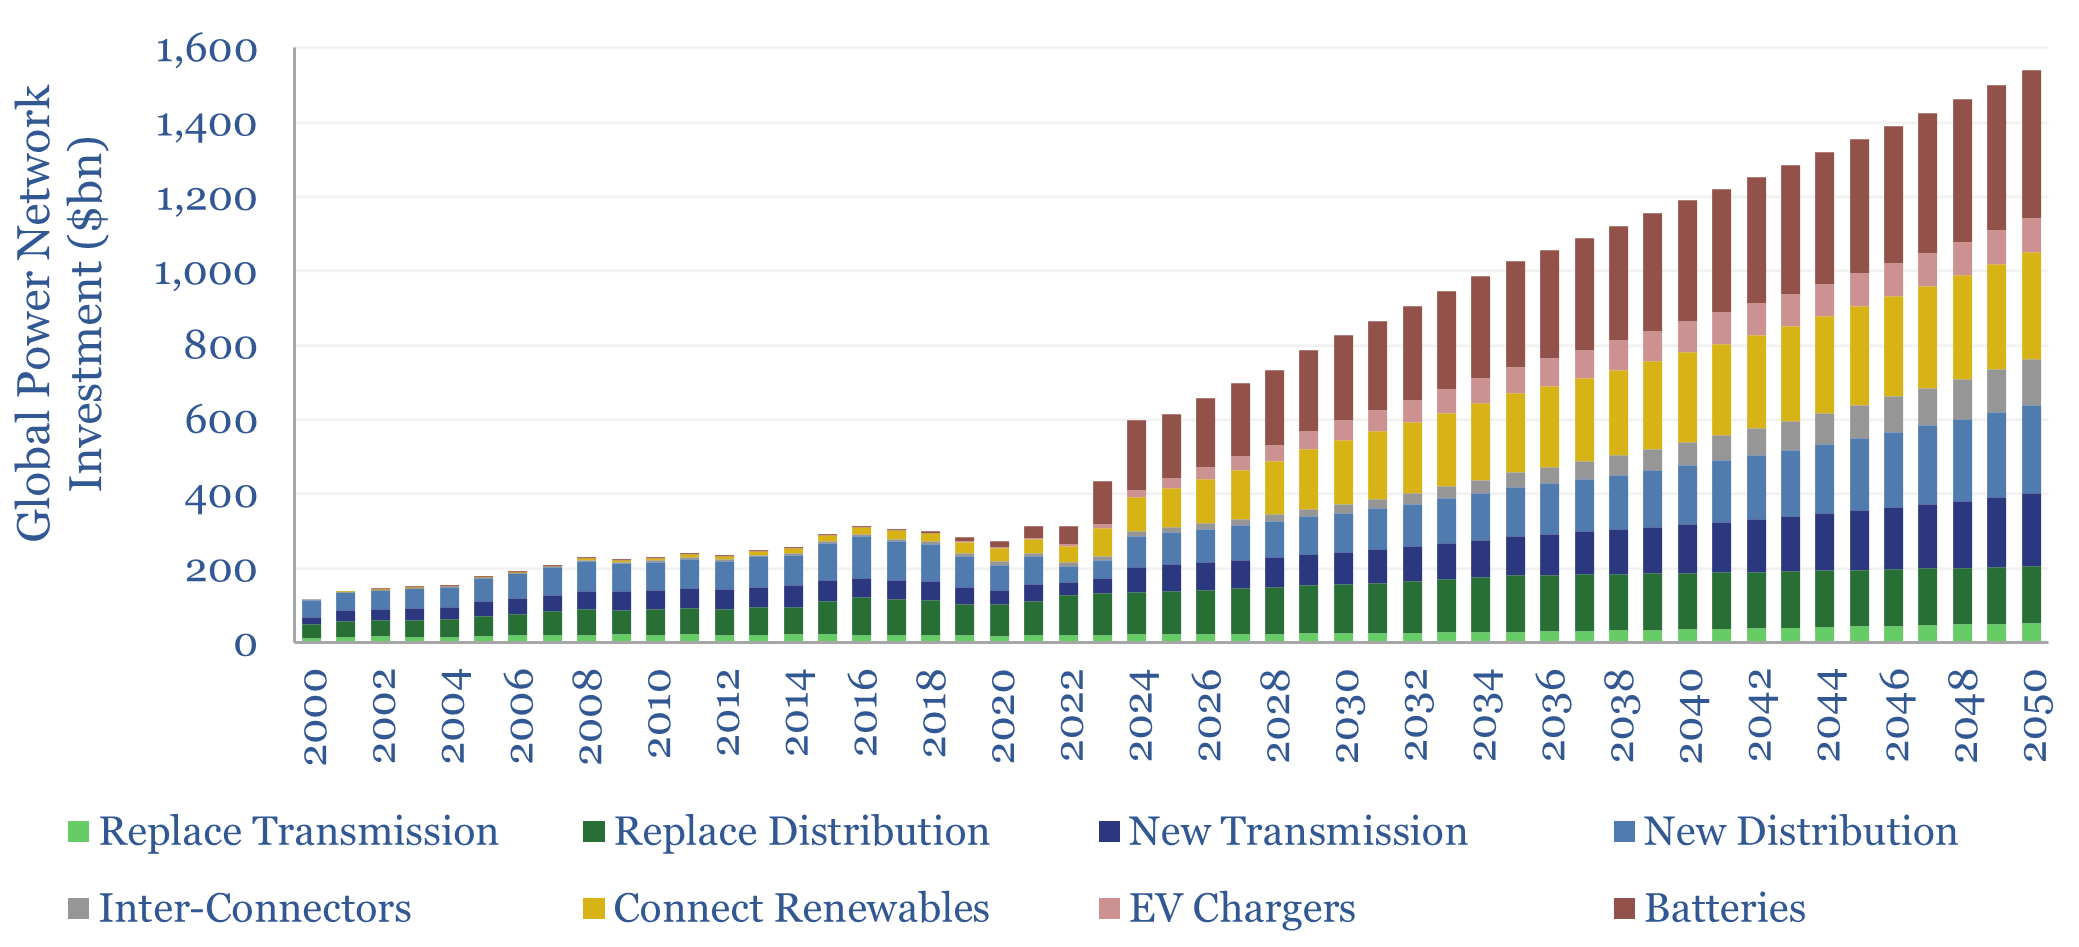
Global investment into power networks averaged $280bn per annum in 2015-20, of which two-thirds was for distribution and one-third was for transmission. Amazingly, these numbers step up to $600bn in 2030, >$1trn in the 2040s and can be as large as all primary energy investment.
Download
Nostromo is commercializing a thermal energy storage system, for commercial buildings in hot climates, where AC can comprise 40-70% of total energy use. It scores highly on our patent framework and can be an interesting alternative to lithium batteries.
Download
Semi-solid electrodes are aimed at "dramatically reducing" costs of lithium ion batteries, with 70-100% higher energy density, plus better safety and reliability, for use in battery storage and electric vehicles. 24M has a moat and is licensing technology to Freyr and Volkswagen.
Download
This data-file assesses pumped hydro costs, to back up wind and solar. A typical project has 0.5GW of capacity, 12-hours storage duration, 80% efficiency, and capex costs of $2,250/kW. Thus it requires a 25c/kWh storage spread, in order to generate a 10% IRR.
Download
CATL produces one-third of the world's lithium ion batteries. Its patents have warned of devastating lithium shortages since at least 2016. Hence in 2021, it announced it would produce commercial sodium-ion batteries by 2023. The technical challenges are captured in its patent library. We cannot fully de-risk its 2023 target.
Download
Direct Lithium Extraction from brines could help lithium scale 30x in the Energy Transition; with costs and CO2 intensities 30-70% below mined lithium; while avoiding the 1-2 year time-lags of evaporative salars. This 15-page note reviews the top ten challenges that decision-makers need to de-risk.
Download
This data-file approximates the costs of battery-grade lithium from brines, via traditional salars the emerging technology of direct lithium extraction. Costs are c40-60% lower than mined lithium in ($/ton of lithium carbonate equivalent). CO2 intensity is 50-80% lower (in kg/kg).
Download
Global graphite volumes grow 6x in the energy transition, mostly driven by electric vehicles. We see the industry moving away from Chinaโs near-exclusive control. The future favors a handful of Western producers, integrated from mine to anode, with CO2 intensity below 10kg/kg. This 10-page note outlines the opportunity.
Download
Power Grids and Power Electronics Research
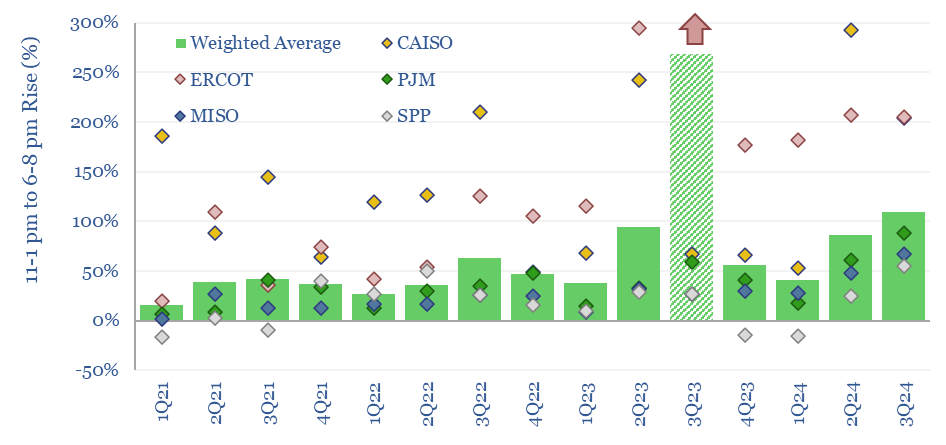
In solar-heavy grids, power prices trough around mid-day, then ramp up rapidly as the sunset. This price distribution over time is known as the duck curve. US power prices are getting 25-30% more ducky each year, based on some forms of measurement. Power prices are clearly linked to the instantaneous share of wind/solar in grids.
Download
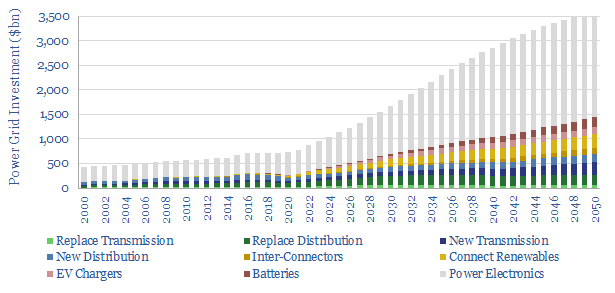
Power grids move electricity from the point of generation to the point of use, while aiming to maximize the power quality, minimize costs and minimize losses. Broadly defined, global power grids and power electronics investment must step up 5x in the energy transition, from a $750bn pa market to over $3.5trn pa. But this theme gets woefully overlooked. This also means it offers up some of the best opportunities in energy transition.
Download
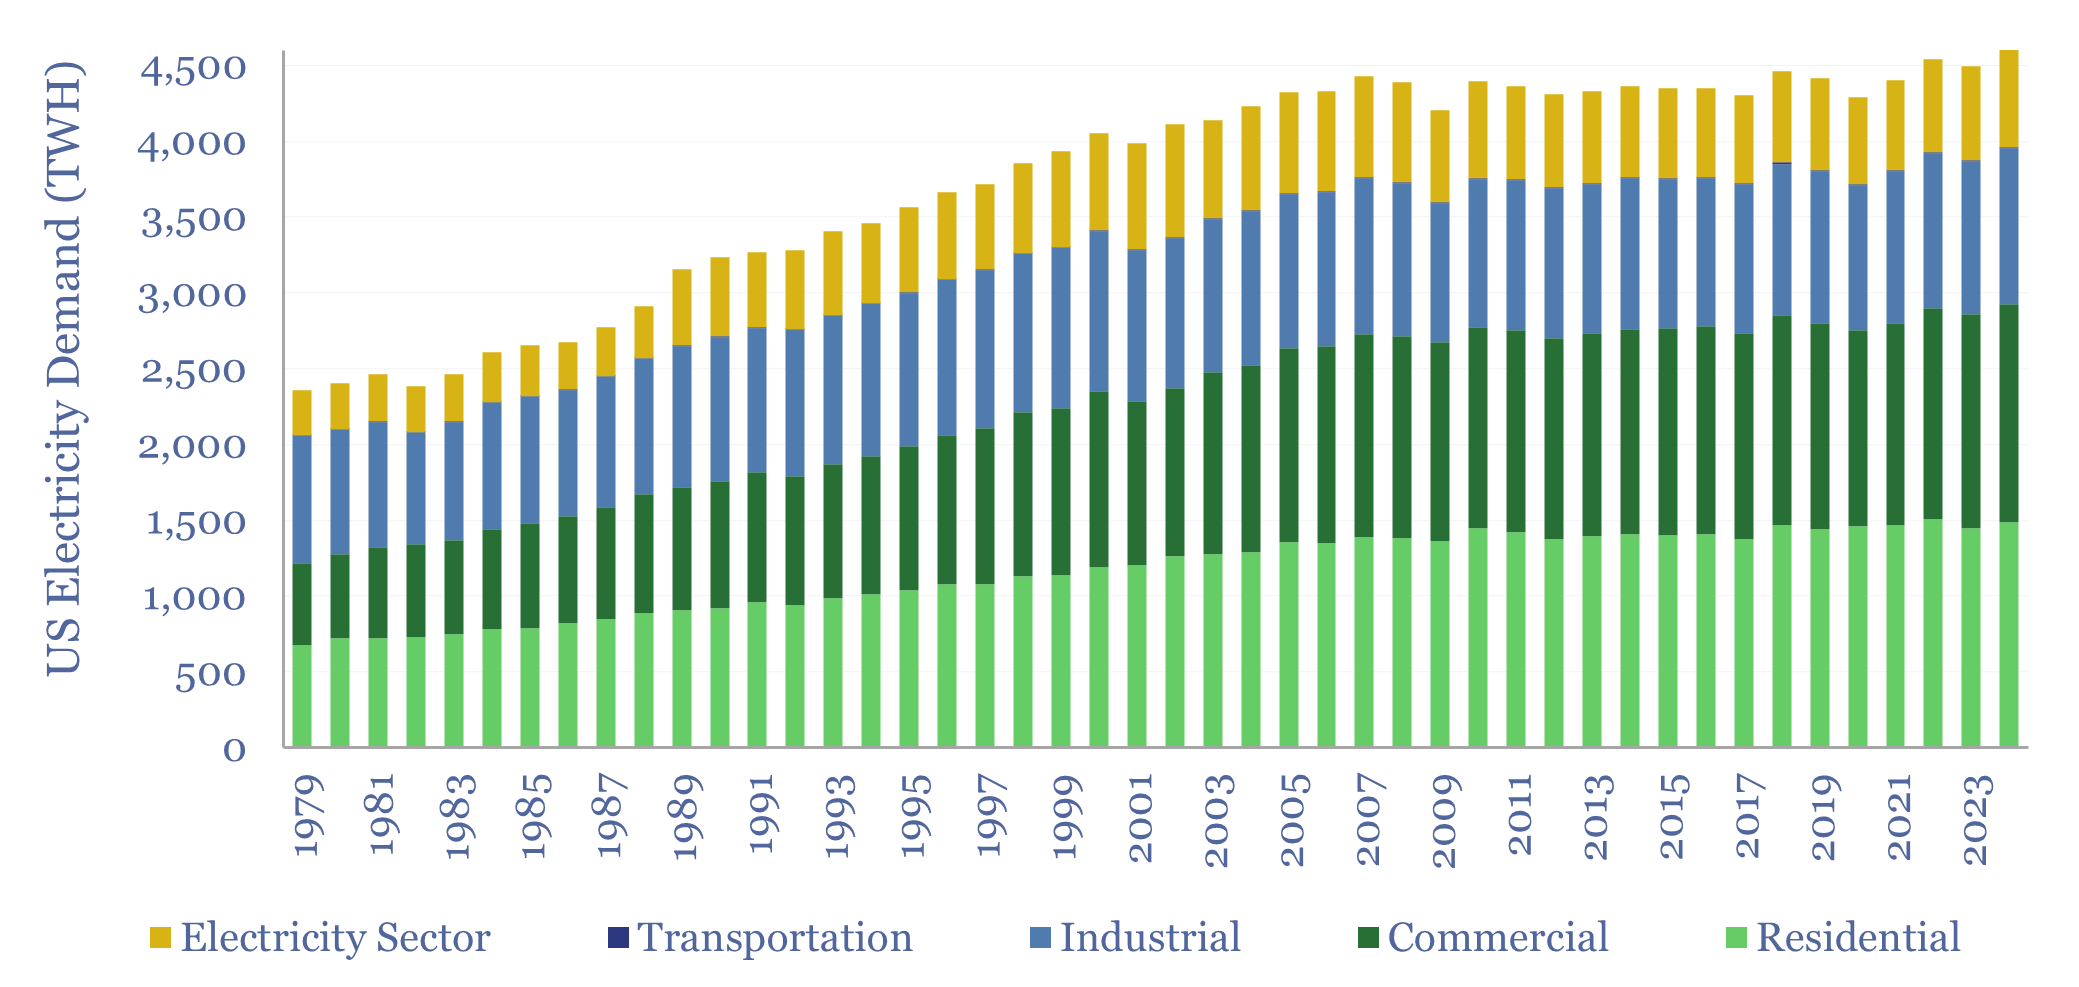
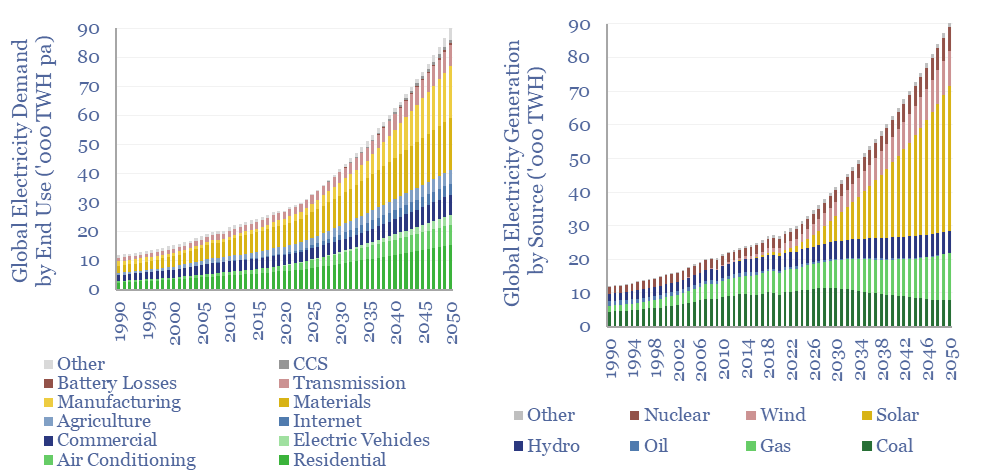
Global electricity supply-demand is disaggregated in this data-file, by source, by use, by region, from 1990 to 2050, triangulating across all of our other models in the energy transition, and culimating in over 50 fascinating charts, which can be viewed in this data-file. Global electricity demand rises 2.5x by 2050 in our outlook.
Download
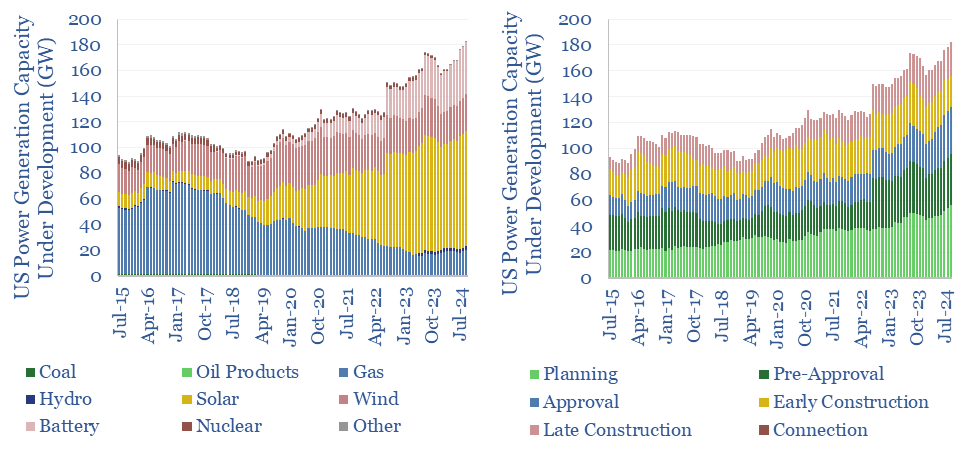
An all-time record of 180GW of new power generation is currently under development in the US in 4Q24, enough to expand the US's 1.3TW power grid by almost 15%. This data-file tracks US power generation under development, as a leading indicator for gas turbine, wind, solar and battery demand. Gas turbines and battery co-deployments are accelerating in 2024, while wind and solar initiations are slowing on grid bottlenecks?
Download
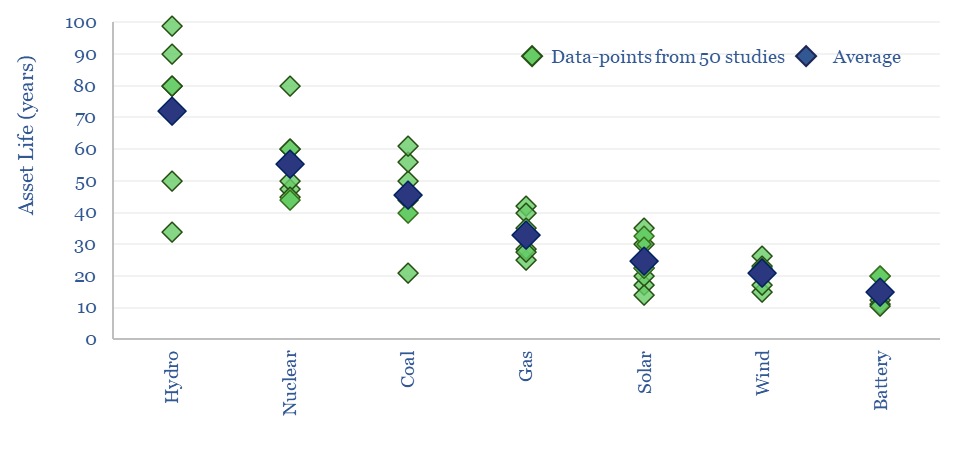
Power generation asset lives average c70-years for large hydro, 55-years for new nuclear, 45-years for coal, 33-years for gas, 20-25 years for wind/solar and 15-years for batteries. This flows through to LCOE models. However, each asset type follows a distribution of possible asset lives, as tabulated and contrasted in this data-file. Asset lives of power … Continue reading "Power generation: asset lives?"
Download
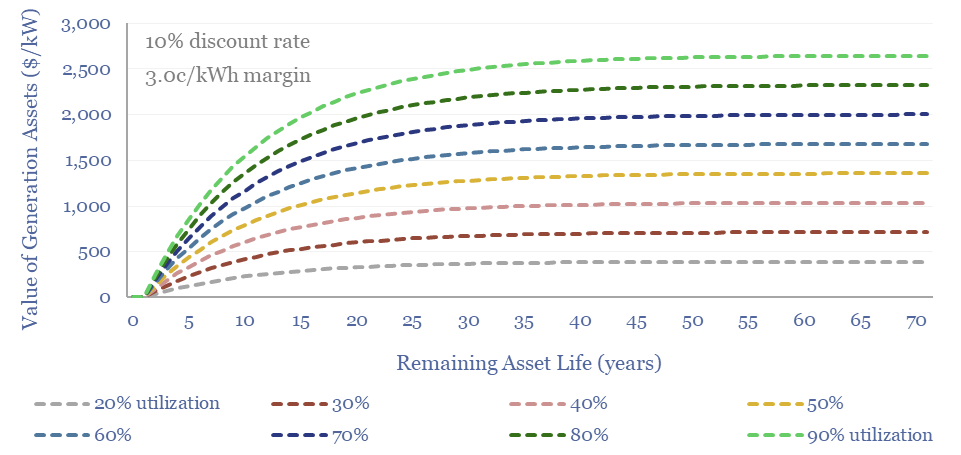
There has never been more controversy over the fair values of power generation assets, which hinge on their remaining life, utilization, flexibility, power prices, rising grid volatility and CO2 credentials. This 16-page guide covers the fair values of generation assets, hidden opportunities and potential pitfalls.
Download
Prysmian E3X technology is a ceramic coating that can be added onto new and pre-existing power transmission cables, improving their thermal emissivity,so they heat up 30% less, have 25% lower resistive losses, and/or can carry 25% increased currents. This data-file locates the patents underpinning E3X technology, identifies the materials used, and finds a strong moat.
Download
Transaction prices for power generation assets are tabulated in this data-file, capturing 65 deals for gas plants, wind, solar, hydro and nuclear, globally and over time. Median prices are c$1,000/kW, but range from $2,500 in the upper decile.
Download
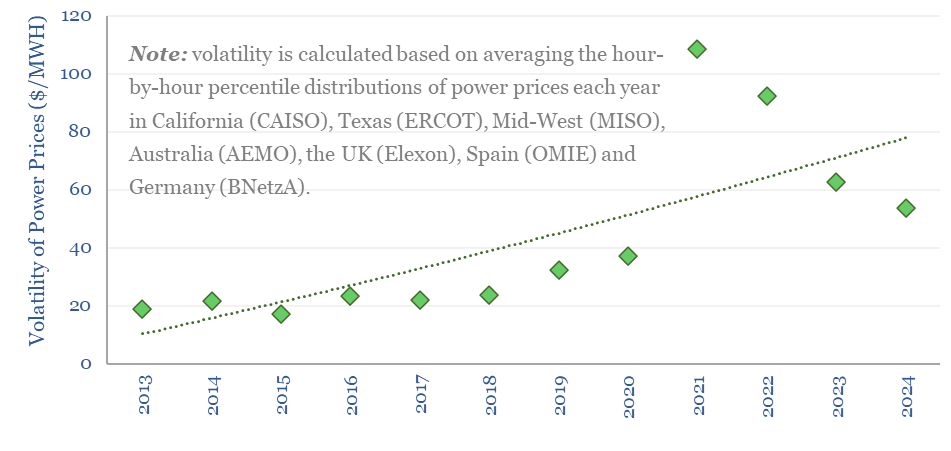
The volatility of power grids has trebled over the past decade from 2013-2023. This data-file tracks the percentile-by-percentile distributions of power prices, each year, in six major grid regions (Texas, California, US MidWest, Australia, the UK and Spain), as a way of tracking increases in global power price volatility. The growing volatility of power grids … Continue reading "Global power price volatility tracker?"
Download
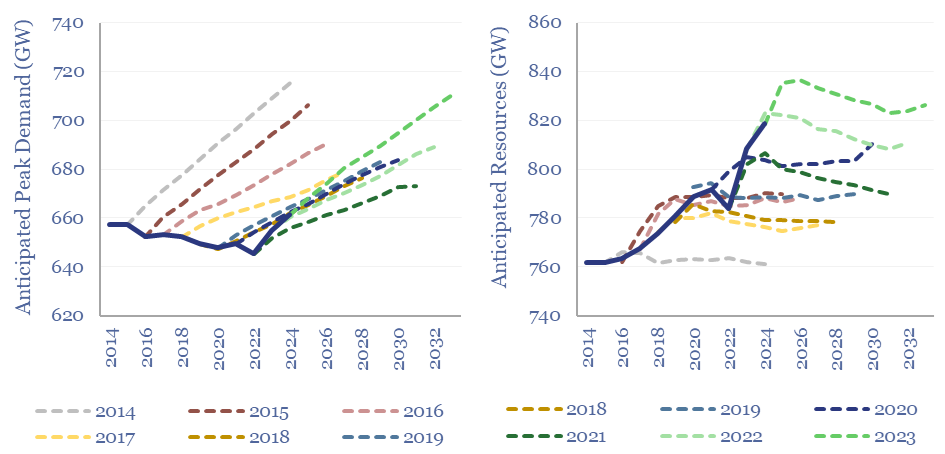
Reserve margins across major ISOs in the US power grid average 29% in 2024, are seen declining to 21% in the next decade by NERC, but could decline further, and below their recommended floors of at least 15%. Reasons include higher demand and controversies over the capacity contributions of renewables. This data-file tabulates reserve margin forecasts, by ISO region, and over time.
Download
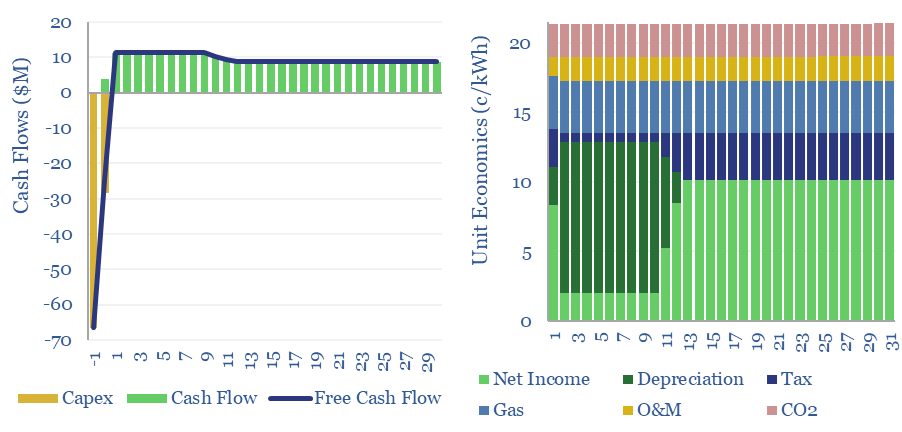
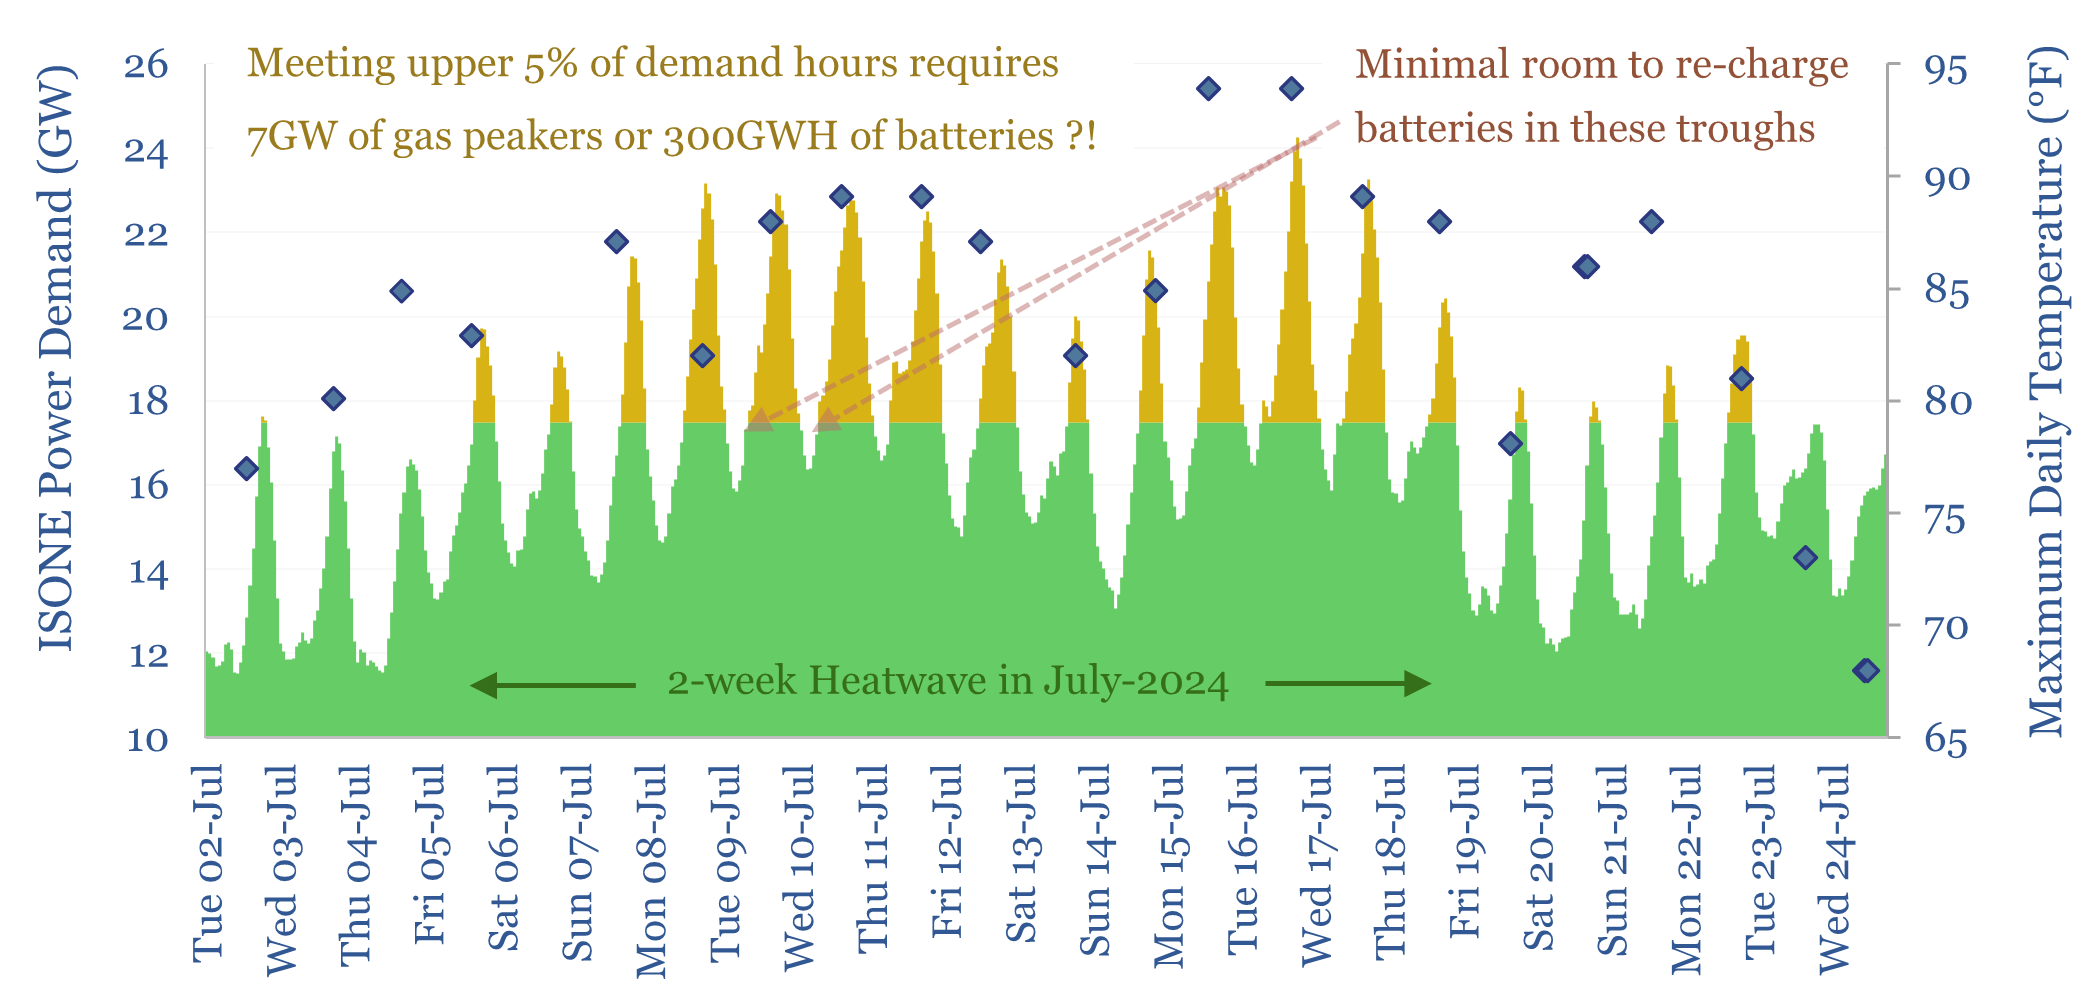
Gas peaker plants run at low utilizations of 2-20%, during times of peak demand in power grids. A typical peaker costing $950/kW and running at 10% utilization has a levelized cost of electricity around 20c/kWh, to generate a 10% IRR with 0.5 kg/kWh of CO2 intensity. This data-file shows the economic sensitivities to volatility and utilization.
Download
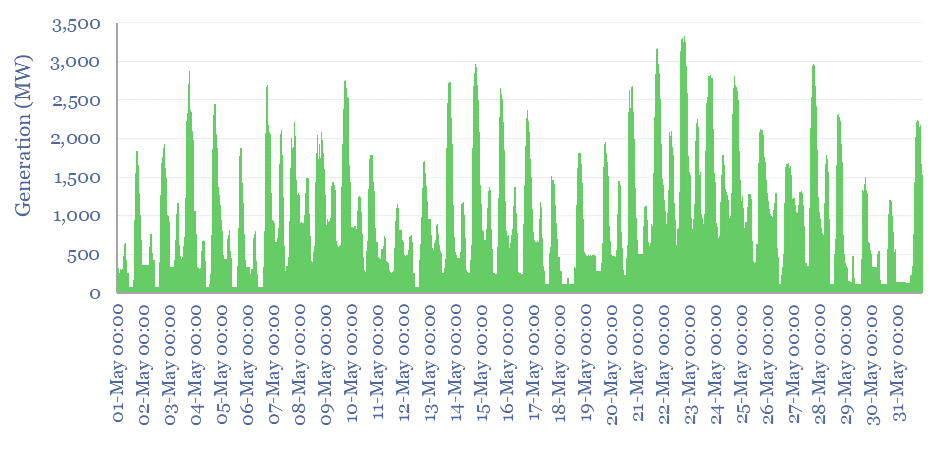
Power generation data are aggregated for ten of the largest CCGTs and gas peaker plants in Australia, across five-minute intervals, May-2024 and May-2014. This makes for a fascinating case study into how gas turbines are used to stabilize power grids, backstop renewables, and how this has changed over time.
Download
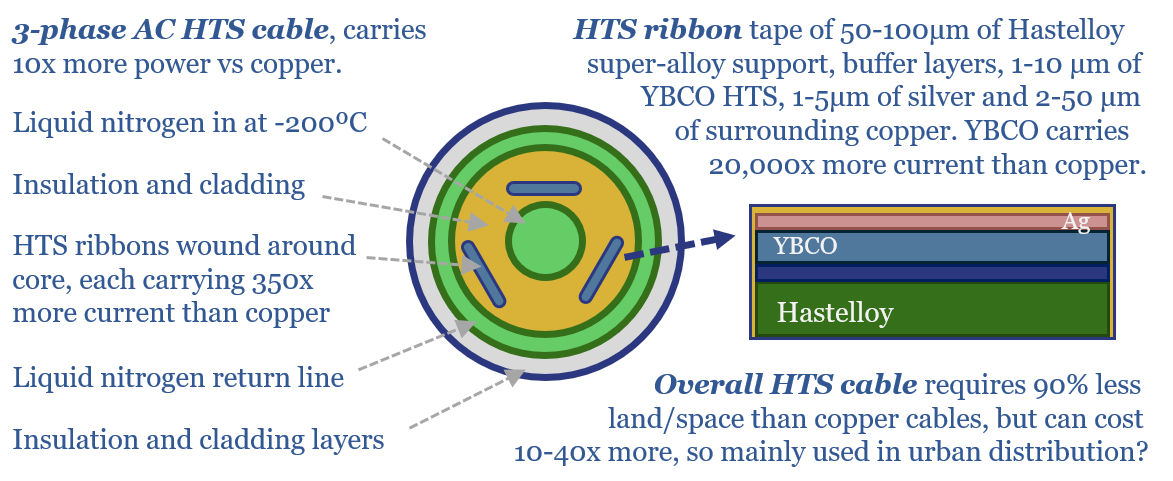
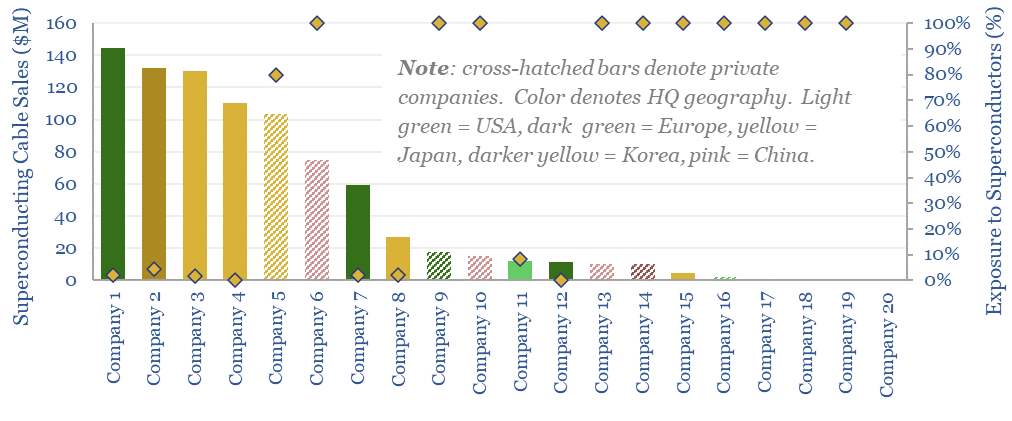
High temperature superconductors (HTSs) carry 20,000x more current than copper, with almost no electrical resistance. They must be cooled to -200ยบC. So costs have been high at 35 past projects. Yet this 16-page report explores whether HTS cables will now accelerate to defray power grid bottlenecks?
Download
This superconductor screen summarizes all of our work into superconductors, screening past projects, active companies, superconductor materials and the properties of commercial HTS tapes. Five listed companies in Europe, Japan and the US are particularly important for superconducting cable projects to relieve grid bottlenecks?
Download
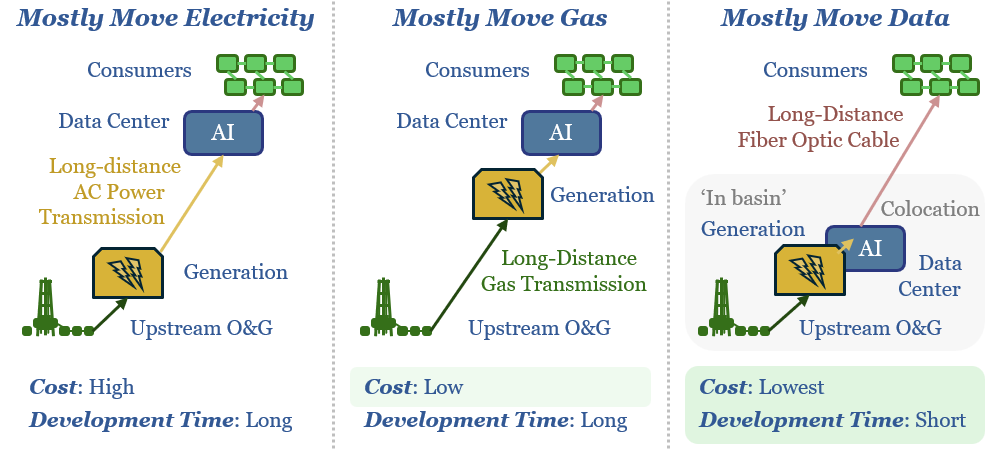
New AI data-centers are facing bottlenecked power grids. Hence this 15-page note compares the costs of constructing new power lines, gas pipelines or fiber optic links for GW-scale computing. The latter is best. Latency is a non-issue. Thus AI reshapes the future of US shale, midstream and fiber-optics?
Download
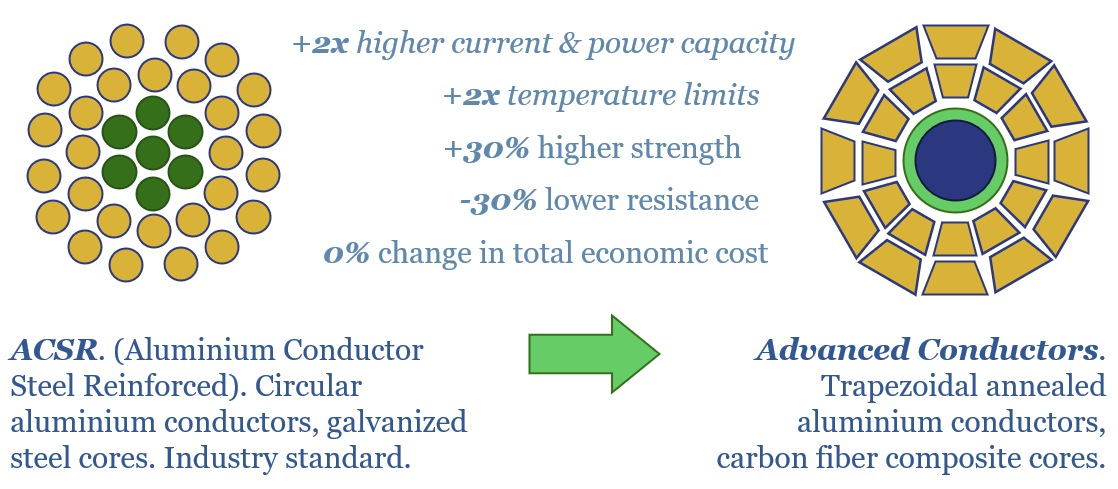
Can todayโs 7M circuit kilometers of transmission lines be upgraded to re-lieve power grid bottlenecks, thus avoiding the 10-year ordeal of permitting a new line? Raising voltage may have hidden challenges. But advanced conductors stand out in this 16-page report. And the theme could double carbon fiber demand?
Download
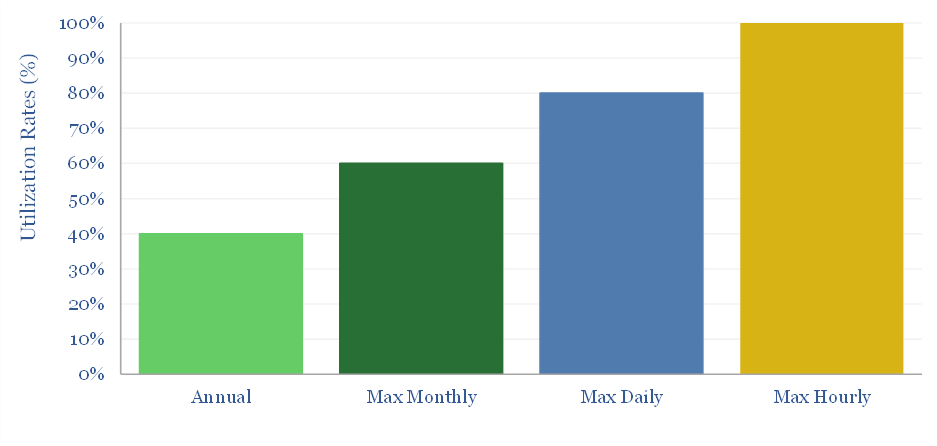
The US has >400GW of large gas-fired power plants running at 40% average annual utilization. Could they help power new loads, e.g., 60GW of AI data-centers by 2030? This 5-page note shows why low utilization does not entail spare capacity, and in turn, estimates the true spare capacity for loads such as data-centers.
Download
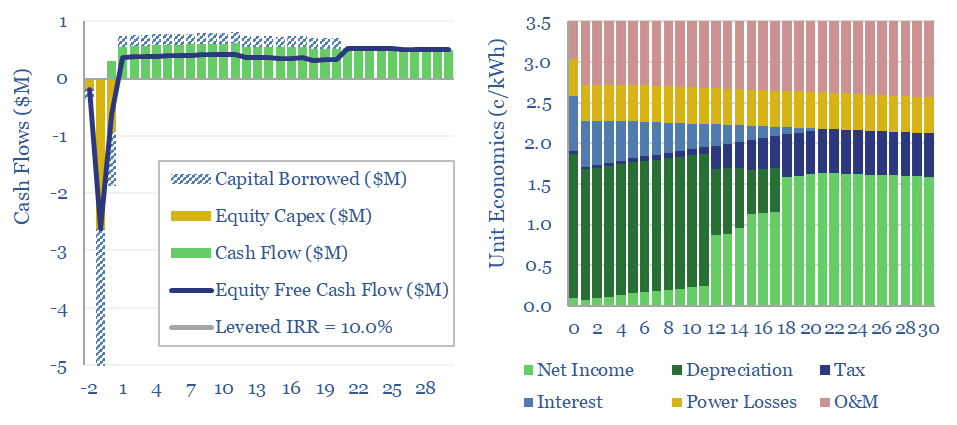
Power distribution costs to residential, commercial and industrial consumers are estimated at 3.5 c/kWh in this model, to generate a 10% levered return, in a 5km x 10MW distribution line, at 17kV, rated up to 400A, with a capex cost of $150/kW-km, a 5% line loss and 40% annualized utilization. All of these inputs can be stress-tested in the data-file.
Download
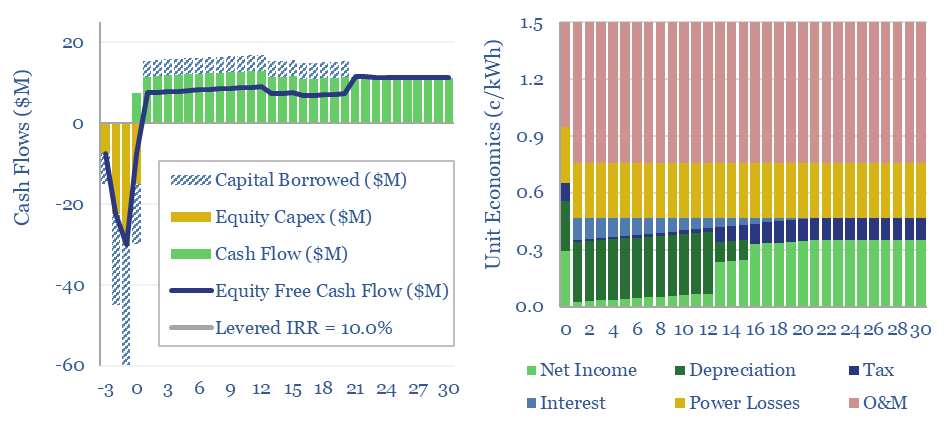
This data-file captures the costs of AC power transmission, requiring a 1.5c/kWh spread to earn a 10% levered IRR on a new 100km and 1,000MW transmission line, with capex costs of $1.5/kW-km. These numbers are supported by backup tabs, tabulating the costs of recent projects and a full granular breakdown for the capex costs of transmission lines.
Download
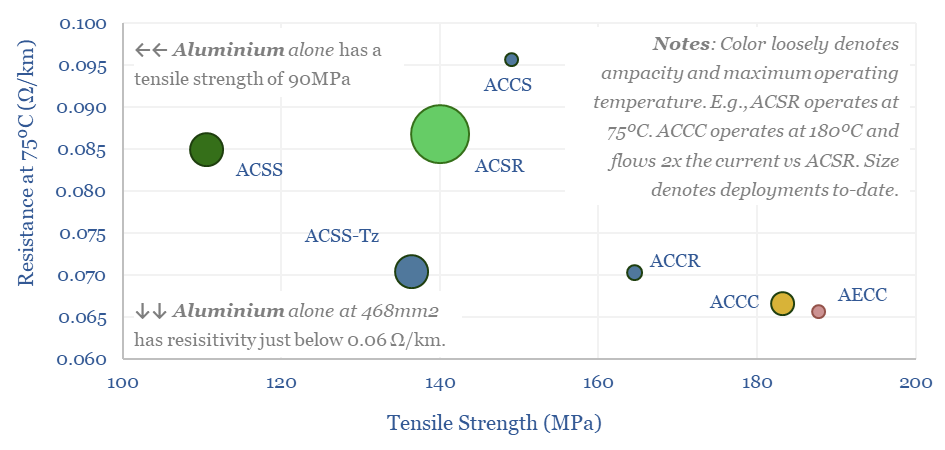
Advanced conductors have 2x higher amperage capacities and temperature limits than standard Aluminium Conductor Steel Reinforced (ACSR) used in AC transmission lines. This data-file screens Advanced conductors versus ACSR on dimensions such as tensile strength, performance and costs, and also screens leading companies.
Download
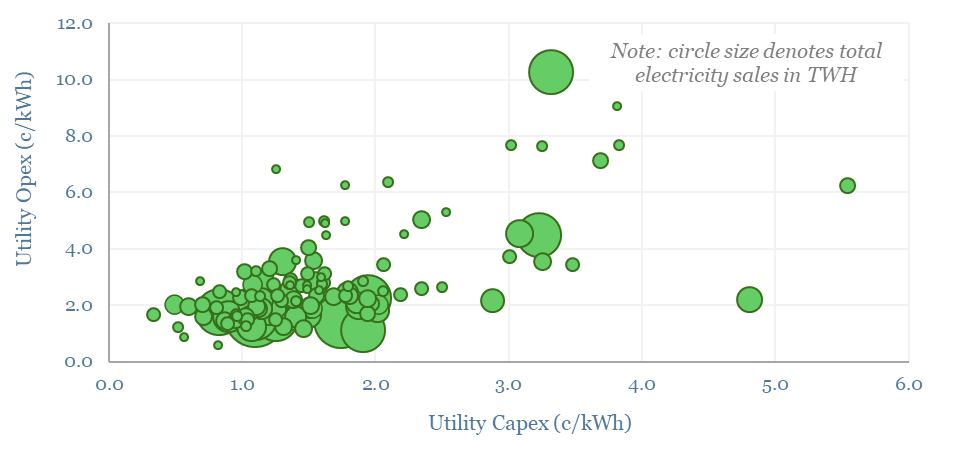
This data-file evaluates transmission and distribution costs, averaging 7c/kWh in 2024, based on granular disclosures for 200 regulated US electric utilities, which sell 65% of the US's total electricity to 110M residential and commercial customers. Costs have doubled since 2005. Which utilities have rising rate bases and efficiently low opex?
Download
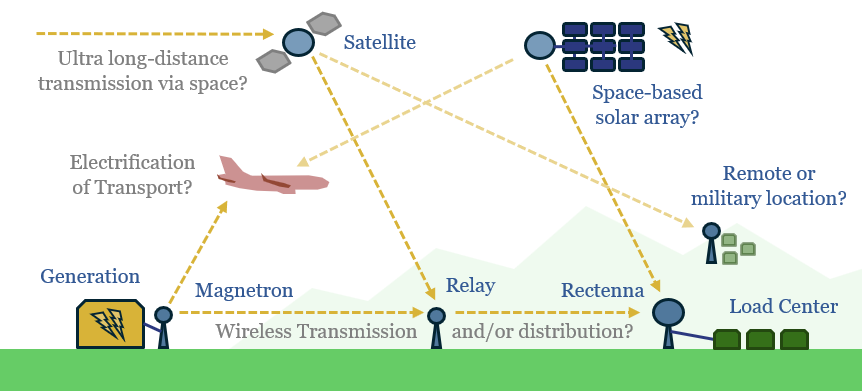
What if large quantities of power could be transmitted via the 2-6 GHz microwave spectrum, rather than across bottlenecked cables and wires? This 12-page note explores the technology, advantages, opportunities, challenges, efficiencies and costs. We still fear power grid bottlenecks.
Download
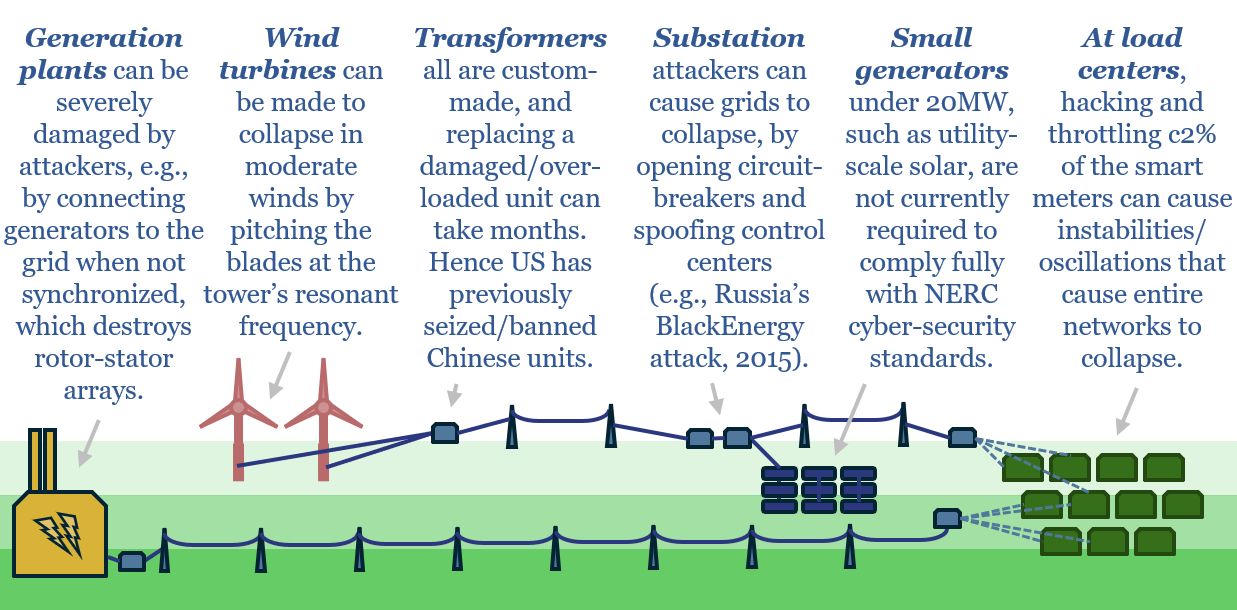
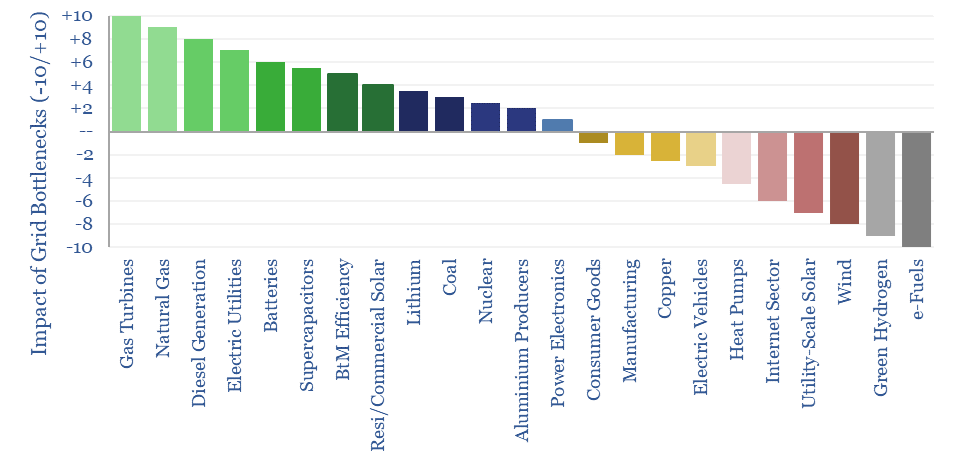
What if the world is entering an era of persistent power grid bottlenecks, with long delays to interconnect new loads? Everything changes. Hence this 16-page report looks across the energy and industrial landscape, to rank the implications across different sectors and companies.
Download
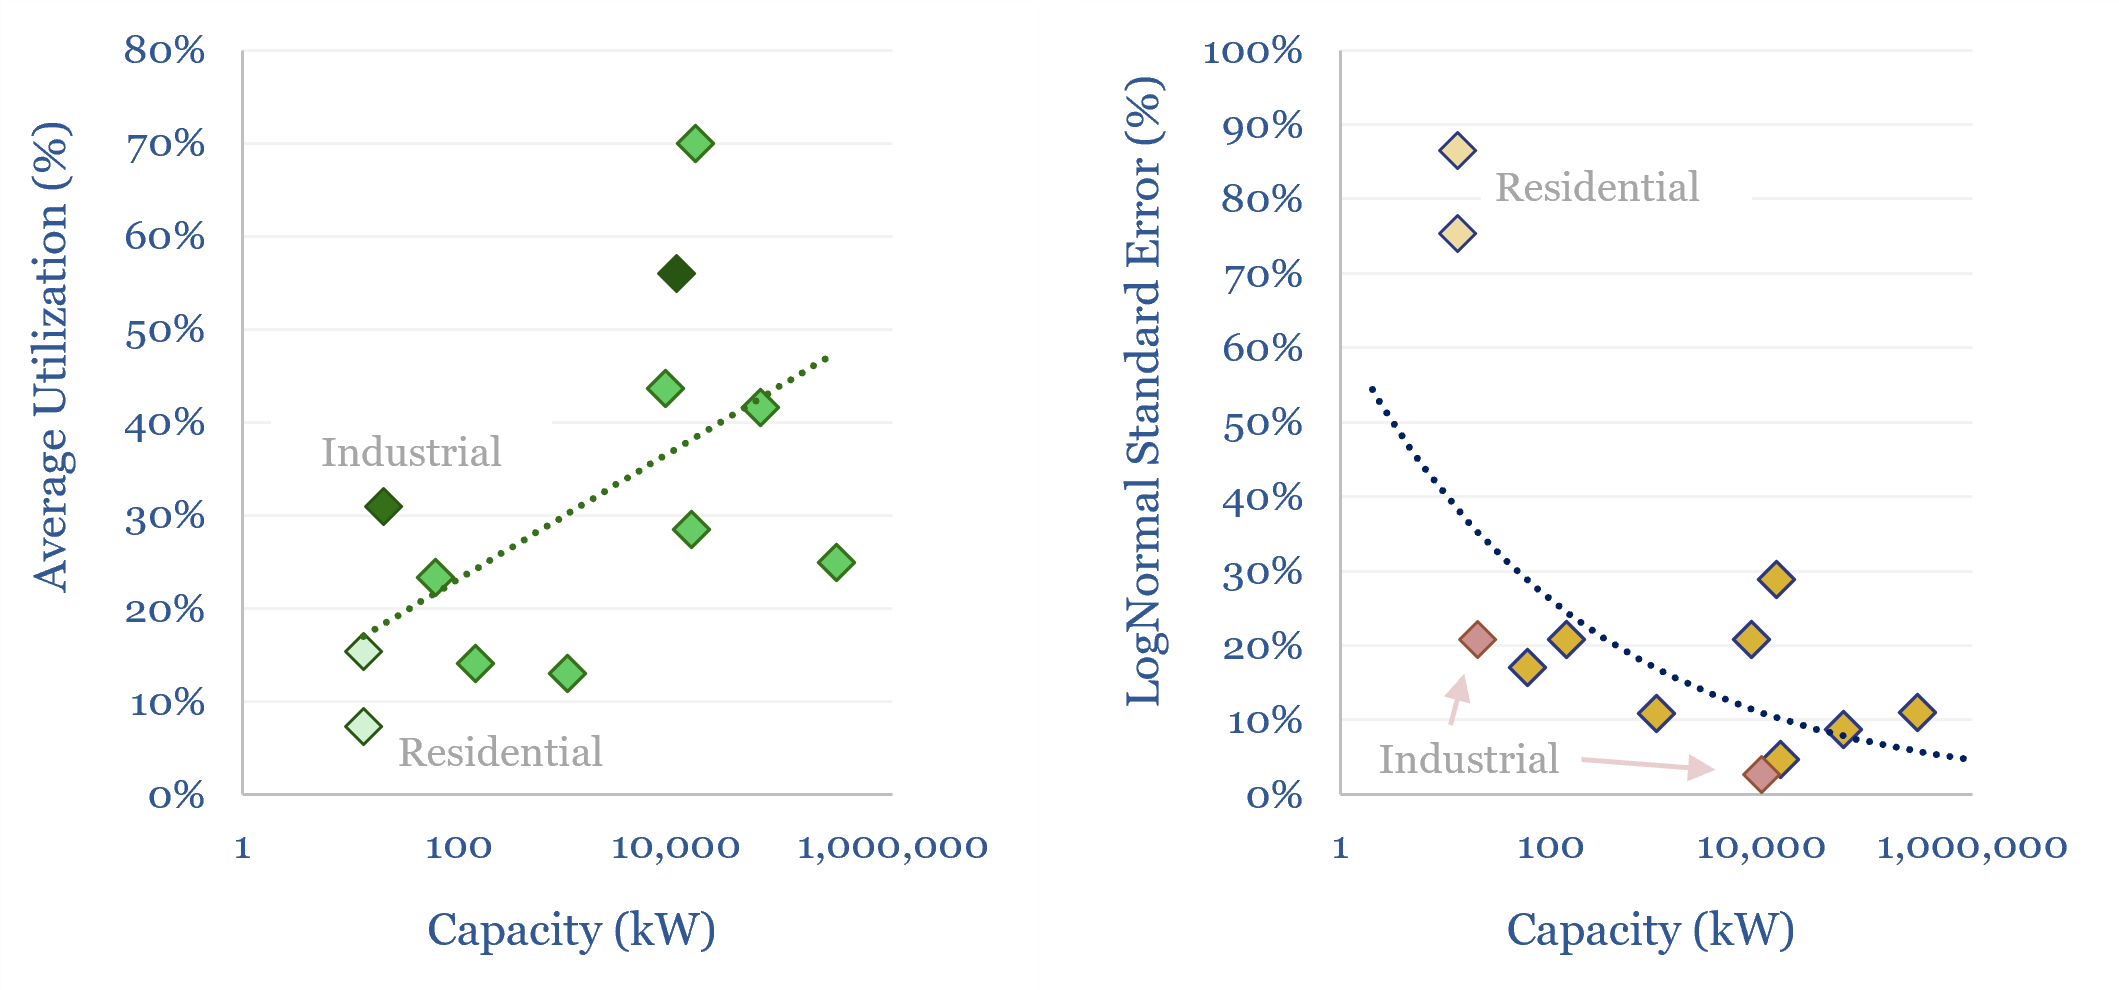
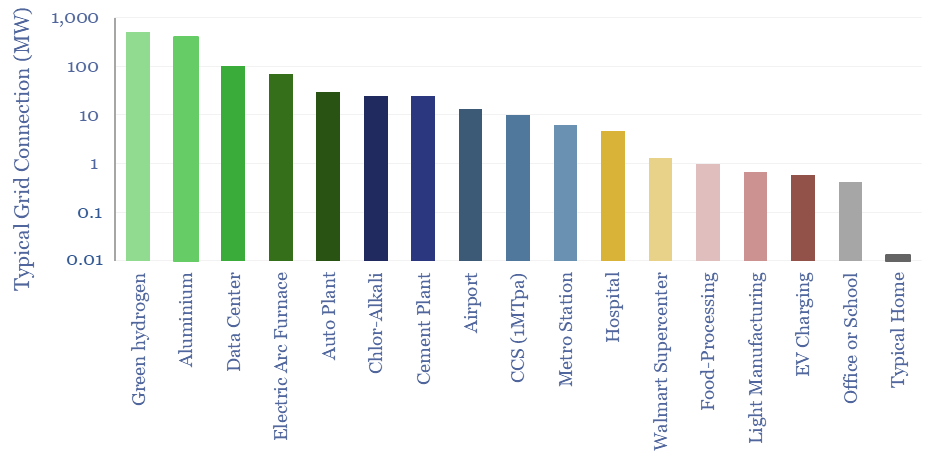
What are the typical sizes of grid connections at different residential, commercial and industrial facilities? This data-file derives aggregates estimates, from the 10kW grid connections of smaller homes to the GW-scale grid connections of large data-centers, proposed green hydrogen projects and aluminium plants.
Download
Power grids will be the biggest bottleneck in the energy transition, according to this 18-page report. Tensions have been building for a decade. They are invisible unless you are looking. And the tightness could last a decade. Further acceleration of renewables may be thwarted. And we are re-thinking grid back-ups.
Download
This data-file tracks some of the leading solar inverter companies and inverter costs, efficiency and power electronic properties. As China now supplies 85% of all global inverters, at 30-50% lower $/W pricing than Western companies, a key question explored in the data-file is around price versus quality.
Download
Hydro power generation by facility is tabulated in this data-file for the 20 largest hydro-electric plants in the US. The average facility achieves 43% availability, varying from 39% in hot-dry years to 51% in wet years; and from 33% at the seasonal trough in September-October to 53% at the seasonal peak in May-June. What implications for energy markets and renewables?
Download
This data-file screens 20 leading companies in harmonic filters, tabulating their size, geography, ownership details, patent filings and a description of their offering. Active harmonic filters reduce total harmonic distortion below 5%, with 97% efficiency, within 5 ms. Half a dozen companies stood out in our screen, including one large, listed Western capital goods company.
Download
The costs of decarbonizing by ramping up solar and wind are highly dependent on context. But our best estimate is that solar and wind can reach 40% of the global grid for a $60/ton average CO2 abatement cost. This is a relatively low cost. Yet it still raises retail electricity prices from 10c/kWh to 12c/kWh. This 7-page note explores numbers and implications.
Download
Wind and solar curtailments average around 5% across different grids that we have evaluated in 2022, and have generally been rising over time, especially in the last half-decade. The key reason is grid bottlenecks. Grid expansions are crucial for wind and solar to continue expanding.
Download
Wind and solar will most likely peak at 50-55% of power grids, without demand-shifting and batteries; more in wind-heavy grids, less in solar heavy grids. This 12-page note draws conclusions from the statistical distribution of renewablesโ generation across 100,000 x 5-minute grid intervals.
Download
This data-file aggregates the statistical distribution of total electricity demand, solar generation and wind generation, every 5-minutes, across California, for the entirety of 2022, in order to understand their volatility and curtailment rates. The data suggest that wind and solar will most likely peak at 50-55% of renewables-heavy grids.
Download
California's power grid ranges from 26-61GW of demand. Utility scale solar has almost quadrupled in the past decade, rising from 5% to almost 20% of the grid. Yet it has not displaced thermal generation, which rose from 28% to 36% of the grid. We even wonder whether wind and solar are entrenching natural gas generators as backstops.
Download
The levelized cost of partial electricity (LCOPE) is very different from the levelized cost of total electricity (LCOTE). This 21-page note explores the distinction. It suggests renewables will peak at 30-60% of power grids? And gas is well-placed as a back-up, set to surprise, by entrenching at 30-50% of renewables-heavy grids?
Download
MOSFETs are fast-acting digital switches, used to transform electricity, across new energies and digital devices. MOSFET power losses are built up from first principles in this data-file, averaging 2% per MOSFET, with a range of 1-10% depending on voltage, switching, on resistance, operating temperature and reverse recovery charge.
Download
In 2023, power grids with c20-30% solar variation tend to have intra-day spreads of 9c/kWh, between peak wholesale electricity prices at 8pm and trough prices at 10am. Unusually, night-time electricity prices are 40% higher than day-time prices. This data-file quantifies California electricity prices, on a wholesale basis, at a sample of grid nodes, looking hour by hour in August-2023.
Download
There is an economic paradox where shifting towards lower cost supply sources can cause inflation in the total costs of supply. Renewable-heavy grids are subject to this paradox, as they have high fixed costs and falling utilization. As power prices rise, there are growing incentives for self-generation. Energy transition requires a balanced, pragmatic approach.
Download
Some industries can absorb low-cost electricity when renewables are over-generating and avoid high-cost electricity when they are under-generating. The net result can lower electricity costs by 2-3c/kWh and uplift ROCEs by 5-15% in increasingly renewables-heavy grids. This 14-page note ranges over 10,000 demand shifting opportunities, to identify who can benefit most.
Download
Demand shifting flexes electrical loads in a power grid, to smooth volatility and absorb more renewables. This database scores technical potential and economical potential of different electricity-consuming processes to shift demand, across materials, manufacturing, industrial heat, transportation, utilities, residential HVAC and commercial loads.
Download
Power grid circuit kilometers need to rise 3-5x in the energy transition. This trend directly tightens global aluminium markets by over c20%, and global copper markets by c15%. Slow recent progress may lead to bottlenecks, then a boom? This 12-page note quantifies the rising demand for circuit kilometers, grid infrastructure, underlying metals and who benefits?
Download
Hydrogen Research
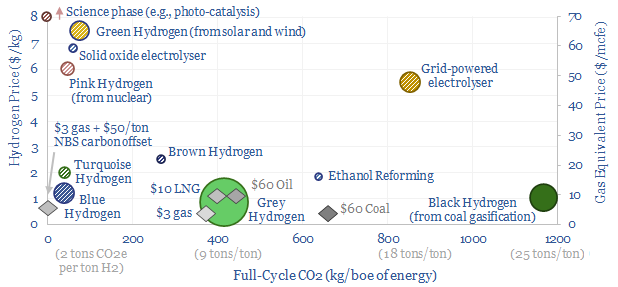
We think the best opportunities in hydrogen will be to decarbonize gas at source via blue and turquoise hydrogen, displacing 'black hydrogen' that currently comes from coal, and to produce small-scale feedstock on site via electrolysis for select industries. Others see green hydrogen as a cornerstone of the future energy system. We think there may be better options elsewhere.
Download
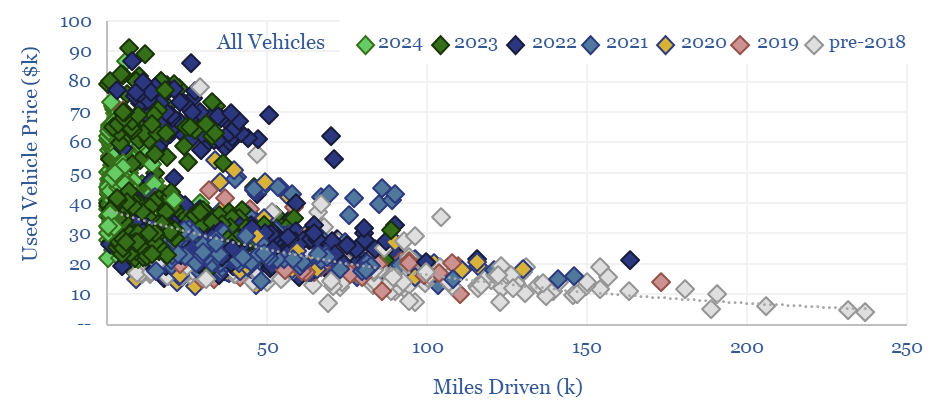
This data-file quantifies the cost per mile of vehicle ownership across different categories by correlating second hand car prices with their accumulated mileage. Hybrids and regular passenger cars are most economical. SUVs and EVs are 2x more expensive. Hydrogen vehicles depreciate fastest and will have lost over 90% of their value after 100,000 miles.
Download
Can we de-risk Air Products's ammonia cracking technology in our roadmaps to net zero, which is crucial to recovering green hydrogen in regions that import green ammonia from projects such as Saudi Arabia's NEOM. We find strong IP in Air Products's patents. However, we still see 15-35% energy penalties and $2-3/kg of costs in ammonia cracking.
Download
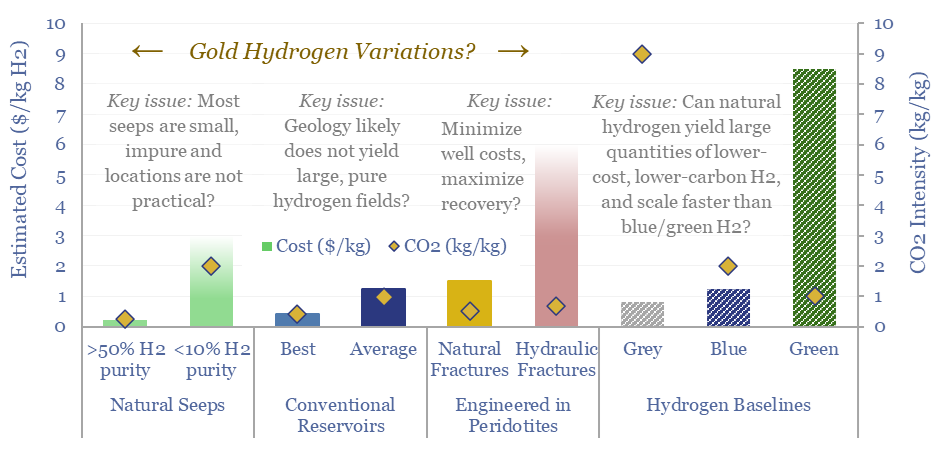
Vast quantities of hydrogen are produced in the Earthโs subsurface, via the Serpentinization of iron-containing Peridotite rocks. Gold, white and orange hydrogen variations aim to harness this hydrogen. This 19-page note explores opportunities, costs and challenges for harvesting H2 out of natural seeps, hydrogen reservoirs or fraccing/flooding Peridotites.
Download
Cemvita is a private biotech company, based in Houston, founded in 2017. It has isolated and/or engineered more than 150 microbial strains, aiming to valorize waste, convert CO2 to useful feedstocks, mine scarce metals (e.g., direct lithium extraction) and "brew" a variant of gold hydrogen from depleted hydrocarbon reservoirs. This data-file is our Cemvita Factory technology review, based on exploring its patents.
Download
Natural hydrogen could be recovered from the Earth's subsurface, with costs ranging from $0.3-10/kg, and CO2 intensities of 0.2-5.0 kg/kg. This data-file models the economic costs of gold hydrogen, and its sub-variants such as white hydrogen and orange hydrogen.
Download
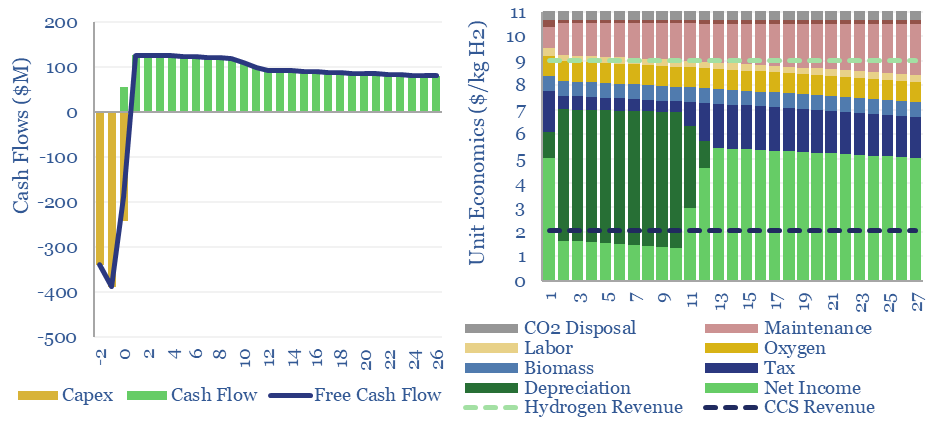
Woody biomass can be converted into clean hydrogen via gasification. If the resultant CO2 is sequestered, each ton of hydrogen may be associated with -20 tons of CO2 disposal. The economies of hydrogen from biomass gasification require $11/kg-e revenues for a 10% IRR on capex of $3,000/Tpa of biomass, or lower, with CO2 disposal incentives.
Download
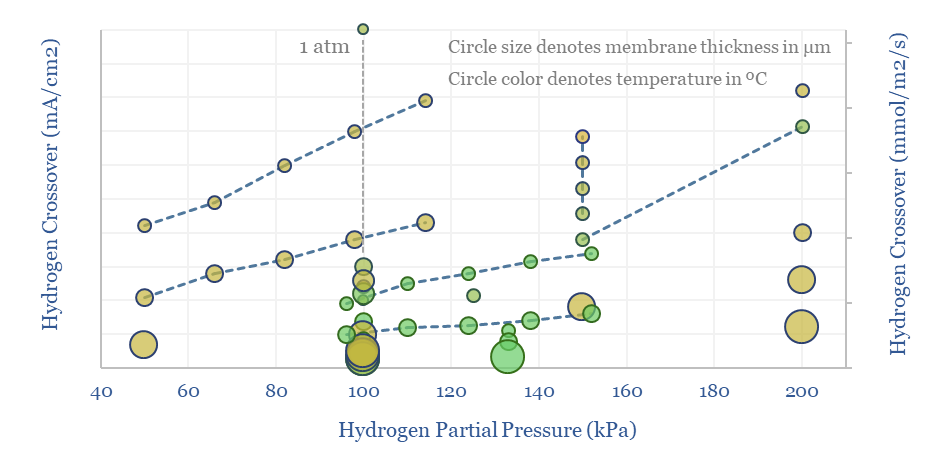
Perfluorinated sulfonate (PFSA) membranes, such as Nafion, are the crucial enabler for PEM electrolyzers, fuel cells and other industrial processes. The market is worth $750M pa. The key challenges are costs, longevity and hydrogen crossover, which are tabulated in this data-file.
Download
Batteries, electrolysers and cleaner metals/materials value chains all hinge on electrochemistry. Hence this 19-page note explains the energy economics from first principles. The physics are constructive for lithium and next-gen electrowinning, but perhaps challenge green hydrogen aspirations?
Download
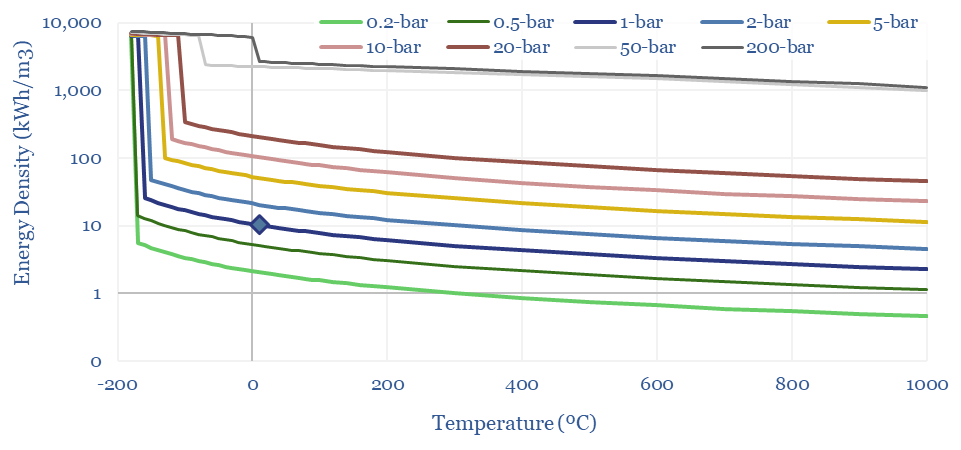
The density of gases matters in turbines, compressors, for energy transport and energy storage. Hence this data-file models the density of gases from first principles, using the Ideal Gas Equations and the Clausius-Clapeyron Equation. High energy density is shown for methane, less so for hydrogen and ammonia. CO2, nitrogen, argon and water are also captured.
Download
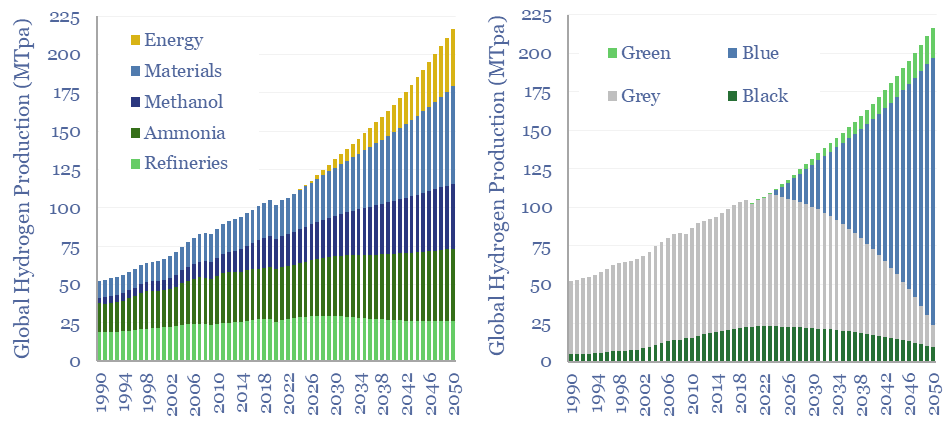
110MTpa of hydrogen is produced each year, emitting 1.3GTpa of CO2. We think the market doubles to 220MTpa by 2050. This is c60% โbelow consensusโ. Decarbonization also disrupts 80% of todayโs asset base. Our outlook varies by region. This 17-page note explores the evolution of hydrogen markets and implications for industrial gas incumbents?
Download
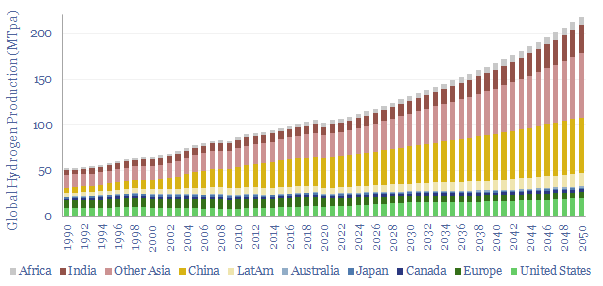
Global production of hydrogen is around 110MTpa in 2023, of which c30% is for ammonia, 25% is for refining, c20% for methanol and c25% for other metals and materials. This data-file estimates global hydrogen supply and demand, by use, by region, and over time, with projections through 2050.
Download
Our Plug Power technology review is drawn from the company's recent patent filings, which offer some of the most detailed disclosures we have ever seen into the manufacturing of PEM electrolysers and fuel cells, underlying catalyst materials, membranes and their manufacturing. One patent seems like a breakthrough. Other patents candidly presented challenges.
Download
MIRALON is an advanced material, being commercialized by Huntsman, purifying carbon nanotubes from the pyrolysis of methane and also yielding turquoise hydrogen. This data-file reviews MIRALON technology, patents, and a strong moat. Our model sees 15% IRRs if Huntsman reaches a medium-term cost target of $10/kg MIRALON and $1/kg H2.
Download
This data-file reviews Bloom Energy's solid oxide fuel cell technology. What surprised us most was a candid overview of degradation pathways of solid oxide fuel cells, a focus on improving the longevity of fuel cells, albeit this sometimes seems to be via heavy uses of Rare Earth metals, and increasing complexity. The patents do suggest a moat around Bloom Energy fuel cell technology.
Download
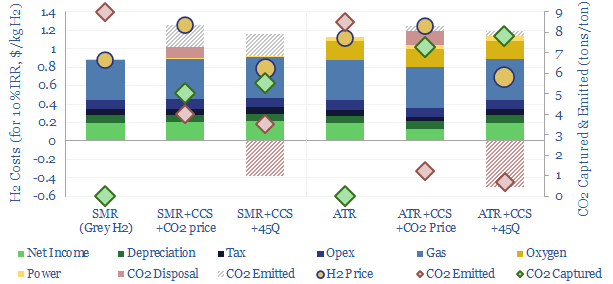
Blue hydrogen value chains are gaining momentum. Especially in the US. So this 16-page note contrasts steam-methane reforming (SMR) versus autothermal reforming (ATR). Each has merits and challenges. ATR looks excellent for clean ammonia. While the IRA creates CCS upside for todayโs SMR incumbents, across industrial gases, refining and chemicals.
Download
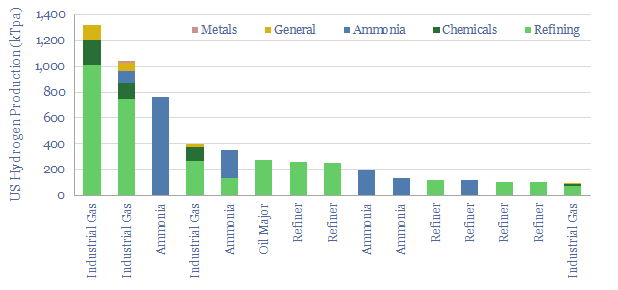
10MTpa of hydrogen is produced in the US, of which 40% is sold by industrial gas companies, 20-25% is generated on site at refineries, 20% at ammonia plants and 15-20% in chemicals/methanol. This datafile breaks down US hydrogen production by facility. Owners of existing steam methane reforming units may readily be able to capture CO2 and benefit from CO2 disposal credits under the US Inflation Reduction Act?
Download
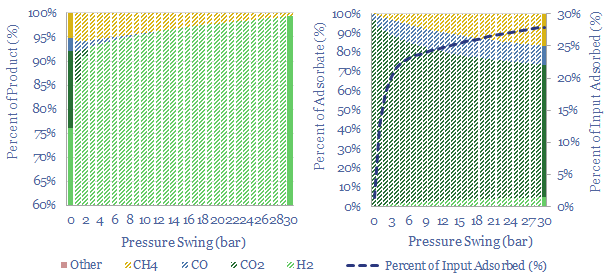
Swing Adsorption separates gases, based on their differential loading onto zeolite adsorbents at varying Pressures. The first PSA plant goes back to 1966. Today, tens of thousands of PSA plants purify hydrogen, biogas, polymers, nitrogen/oxygen and possibly in the future, can capture CO2? This 16-page note explores the technology, costs, challenges, companies.
Download
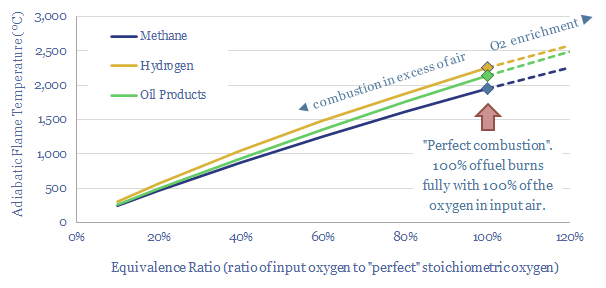
At an idealized, 100% stoichiometric ratio, the adiabatic flame temperature for natural gas is 1,960ยบC, hydrogen burns 300ยบC hotter at 2,250ยบC and oil products burn somewhere in between, at around 2,150ยบC. The calculations show why hydrogen cannot always be dropped into an existing turbine or heat engine.
Download
Topsoe autothermal reforming technology aims to maximize the uptime and reliability of blue hydrogen production, despite ultra-high combustion temperatures from the partial oxidation reaction, while achieving high energy efficiency, 90-97% CO2 capture and
Download
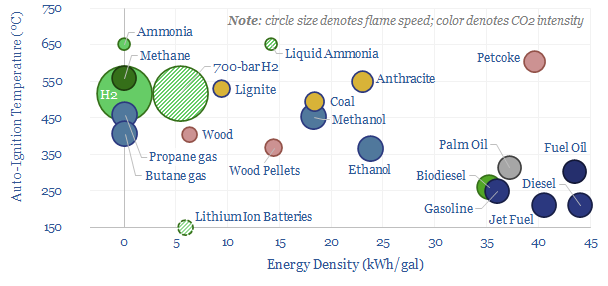
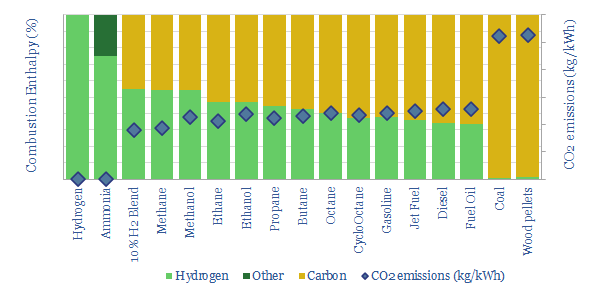
The quality of a combustion fuel comes down to its physical and chemical properties. Hence the purpose of this data-file is to aggregate data into different fuels' energy content (kg/m3), energy density (kWh/kg, kWh/gal), flash point (ยบC), auto-ignition point (ยบC) and flame speed (m/s, cm/s). Conclusions about high quality fuels follow.
Download
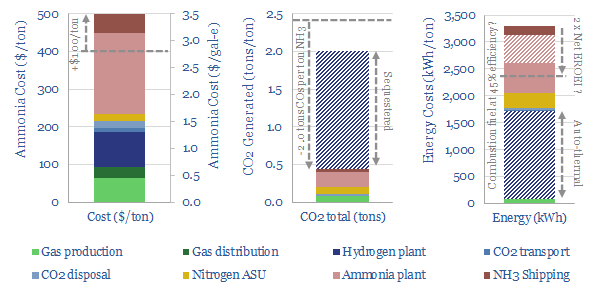
Blue ammonia can economically decarbonize the fertilizer industry, using low-cost natural gas; with options to decarbonize combustion fuels in the future. This report covers where we see the best opportunities, as reforms to the 45Q have already kick-started a 20MTpa boom of new US projects.
Download
The Sabatier process combines CO2 and hydrogen to yield synthetic natural gas using a nickel catalyst at 300-400C. A gas price of $100/mcf is needed for a 10% IRR, energy penalties exceed 75% and CO2 abatement cost is $2,000/ton?
Download
NEL is a green hydrogen technology company, headquartered in Oslo, listed on the Oslo Bรธrs since 2014, and employing 575 people. It has manufactured 3,500 electrolyser units, going back to 1927, historically weighted to alkaline electrolysers, and increasingly focused on PEMs and hydrogen fuelling stations. This NEL technology review explores its patents.
Download
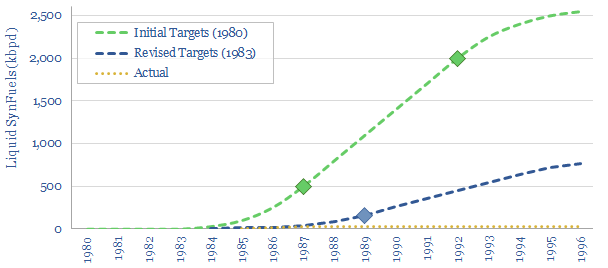
Does unprecedented policy support inherently de-risk new technology? This 10-page note is a case study. The Synthetic Fuels Corporation was created by the US Government in 1980. It was promised $88bn. But it missed its target to unleash 2Mbpd of next-generation fuels by 1992. There were four challenges. Are they worth remembering in new energies today?
Download
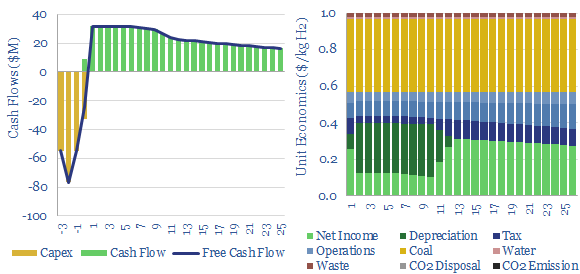
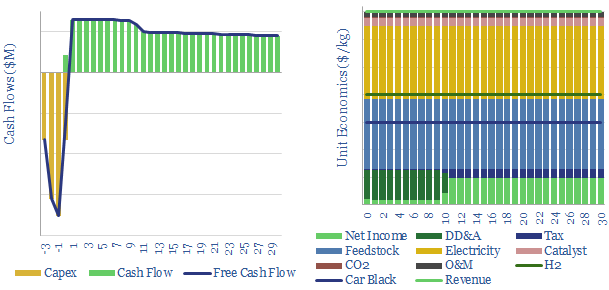
What are the costs of hydrogen from coal gasification? This model looks line-by-line, across different plant configurations, aggregating data from technical papers. Black hydrogen costs $1-2/kg. But CO2 intensity is very high, as much as 25 tons/ton. It can possibly be decarbonized resulting in semi-clean hydrogen costing c$2.5/kg.
Download
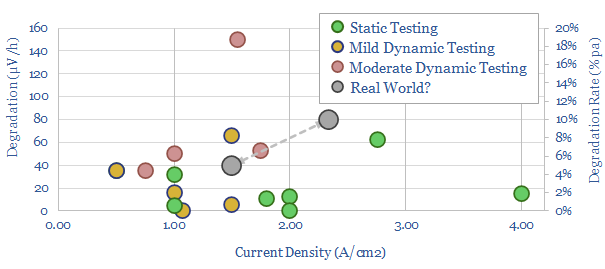
What degradation rate is expected for a green hydrogen electrolyser, if it is powered by volatile wind and solar inputs? This 15-page note reviews past projects and technical papers. 5-10% pa degradation rates would raise green hydrogen costs by $1/kg. Avoiding degradation justifies higher capex, especially on power-electronics and even batteries?
Download
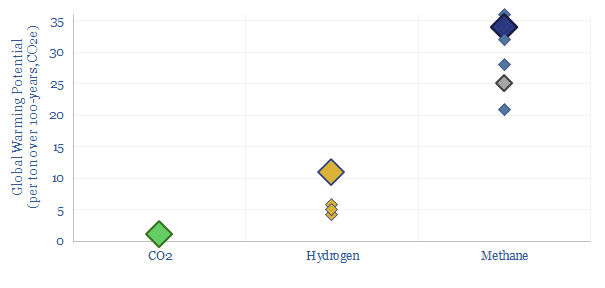
Hydrogen is an indirect GWP, as it breaks down in the atmosphere over 1-2 years, increasing the lifespan of other GHGs, such as methane. So what is hydrogen GWP versus methane? 1 ton of atmospheric H2 most likely causes 11x more warming than 1 ton of CO2 (the number for methane is 34x). Eight conclusions follow.
Download
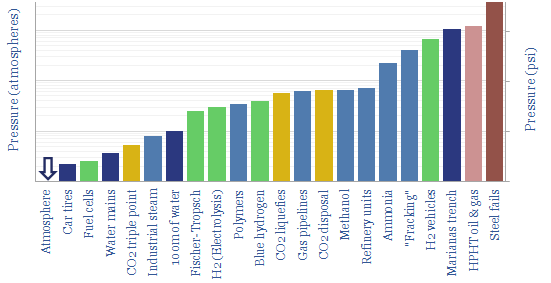
The purpose of this data-file is to chart the typical pressures of industrial processes and energy processes, as a useful reference. We are all used to 1 atmosphere of pressure, which is 1.0125 bar, 0.10125 MPa and 14.7 psi. But what pressures do industrial processes use?
Download
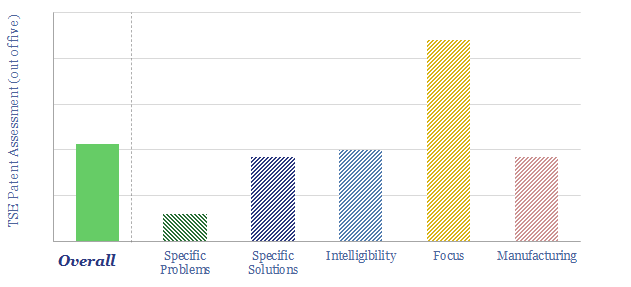
Monolith claims it is the "only producer of cost effective commercially viable clean hydrogen today" as it has developed a proprietary technology for methane pyrolysis. But overall this was not one of our most successful patent screens. Some specific question marks are noted in the data-file.ย ย
Download
Turquoise hydrogen is produced by thermal decomposition of methane at high temperatures, from 600-1,200โฆC. Costs can beat green hydrogen. This data-file quantifies the economics (in $/kg), how to generate 10% IRRs, possible capex costs, and remaining challenges for commercialization.
Download
Electro-fuels are hydrocarbons produced from renewable power, CO2 and water. They are reminiscent of the adage that โthe fastest way to become a millionaire is to start out as a billionaire then found an airlineโ. Because all you need for 1boe of these zero-carbon fuels is 2-3 boe of practically free renewable energy.
Download
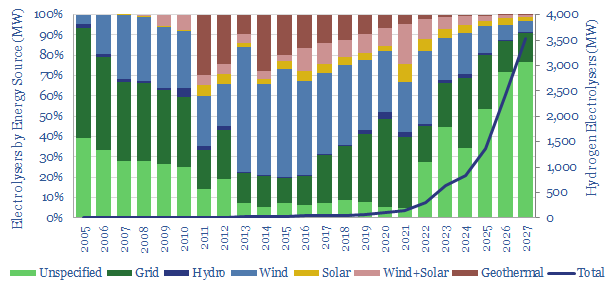
This data-file derives conclusions into green hydrogen electrolysers in Europe, based on c240 distinct projects. The market is shifting away from smaller alkaline electrolyers to super-giant PEMs and SOECs. Key controversies are visibly emerging around power sources and hydrogen uses.
Download
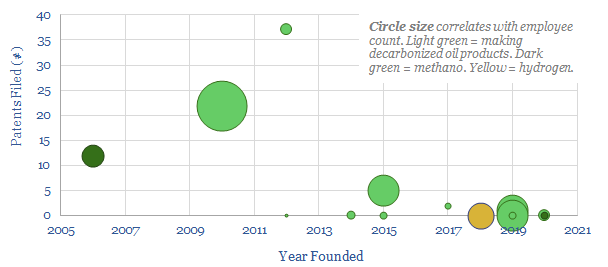
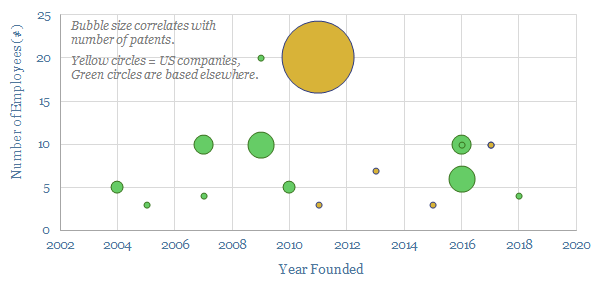
This data-file summarizes the details of c15 companies aiming to commercialise low-carbon electro-fuels, using power-to-liquids technologies, and their progress to-date. The average company was founded in 2015, with 5 patents and 15 employees. Although this is skewed towards 3-4 leaders.
Download
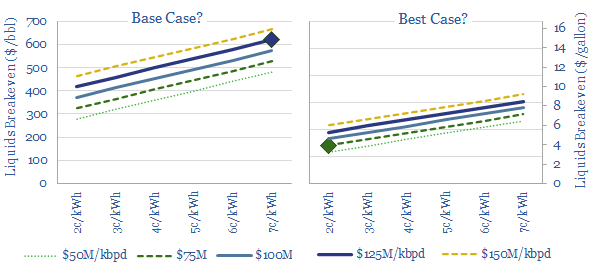
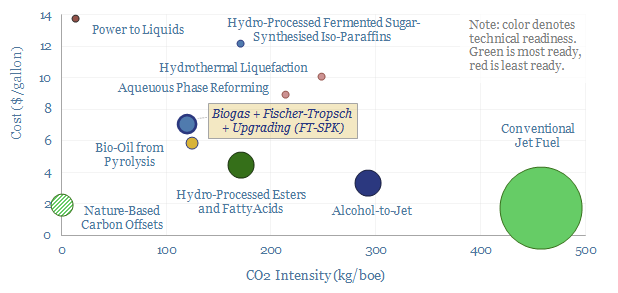
Liquid transport fuels with almost no CO2 emissions could be created from renewable energy, by electrolysing water and CO2, then combining the hydrogen and CO, e.g., via Fischer Tropsch. This simple models stress tests the economics. Our base case estimates are for costs between $400-600/bbl ($10-14/gallon).
Download
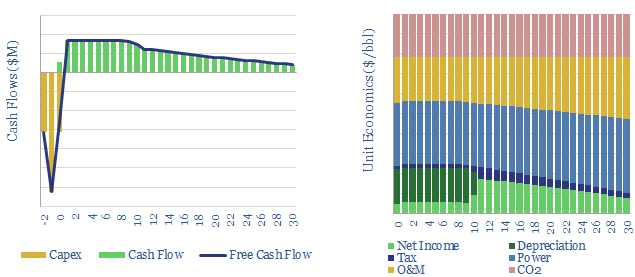
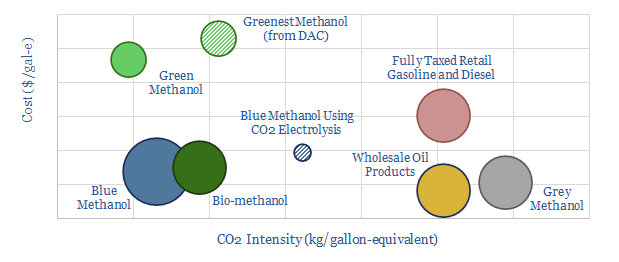
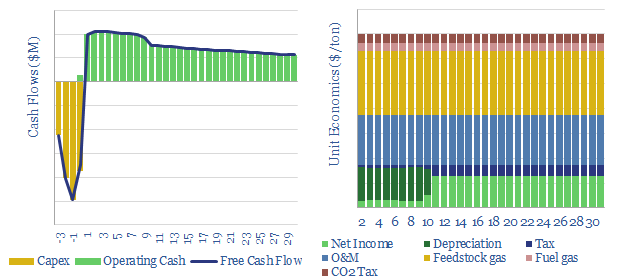
Methanol is becoming more exciting than hydrogen as a clean fuel to help decarbonize transport. Specifically, blue methanol and bio-methanol are 65-75% less CO2-intensive than oil products, while they already earn 10% IRRs at c$3/gallon prices. Unlike hydrogen, it is simple to transport and integrate methanol with pre-existing vehicles.
Download
This model captures the economics and CO2 intensity of methanol production in different chemical pathways. We find exciting potential for bio-methanol and blue methanol. These are logistically simple substitutes for oil products, but with lower carbon content. Full cost breakdowns can be stress-tested in the data-file.
Download
The purpose of this data-file is to disaggregate the energy economics of combusting different fuels, including natural gas, different oil products, NGLs, coal, hydrogen, methanol, ammonia et al. The most effective way to blend more hydrogen into the energy mix is coal-to-gas switching, followed by using lighter oil products.
Download
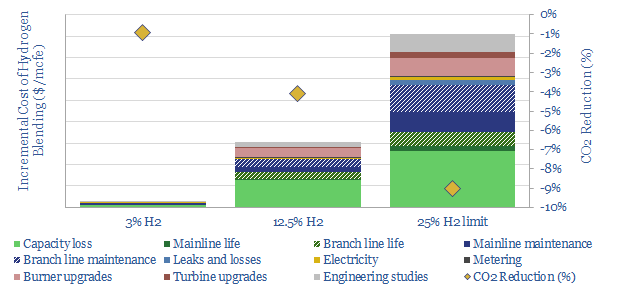
This data-file estimate the costs of blending hydrogen into pre-existing natural gas pipeline networks. Costs are relatively low per mcf of gas, but very high per ton of CO2 abated. Costs also rise exponentially, as more hydrogen is blended into the mix.
Download
This data-file reviews fifty patents into proton exchange membrane fuel cells, filed by leading companies in the space in 2020, in order to understand the key challenges the industry is striving to overcome. The key focus areas are controlling temperature, humidity and longevity, but unfortunately this will tend to increase costs.
Download
Biofuels Research
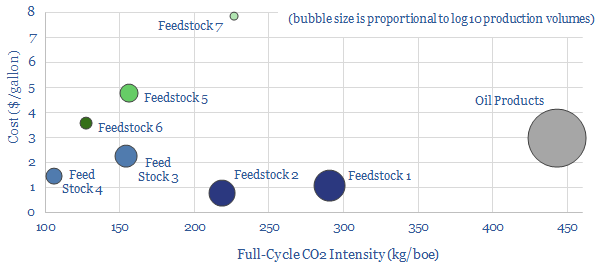
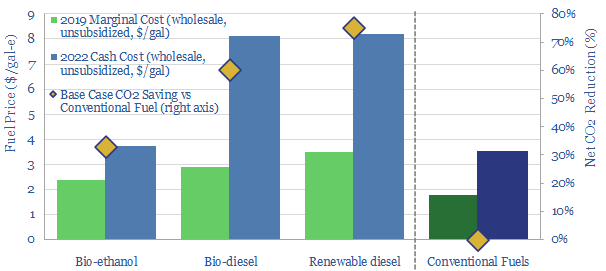
Biofuels are currently displacing 3.5Mboed of oil and gas. But they are not carbon-free, and their weighted average CO2 emissions are only c50% lower. This data-file breaks down the biofuels market across seven key feedstocks, to help identify which opportunities can scale for the lowest costs and CO2, versus others that require further technical progress.
Download
Costs of biogas upgrading into biomethane are estimated at $7/mcf off of capex cost of $400/ton, in this data-file. The largest contributor to total costs is carbon filtering, to remove siloxanes, VOCs and H2S, which we have modelled from first principles, at $2/mcfe. Underlying data into biogas compositions and impurities are also tabulated for reference.
Download
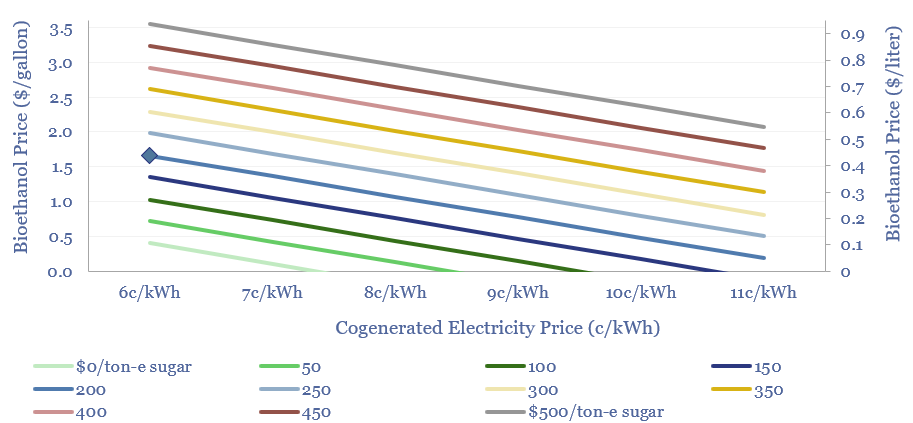
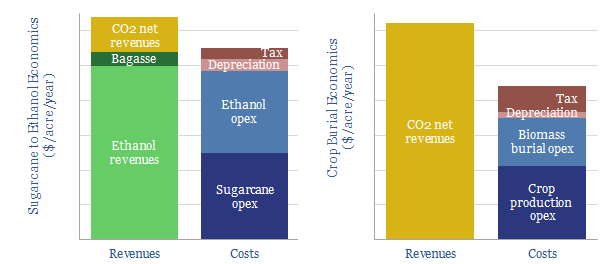
Sugar cane is an amazing energy crop, yielding 70 tons per hectare per year, of which 10-15% is sugar and 20-25% is bagasse. Crushing facilities create value from sugar, sugar-to-ethanol and cogenerated power. This 11-page note argues that more volatile electricity prices could halve ethanol costs or raise cash margins by 2-4x.
Download
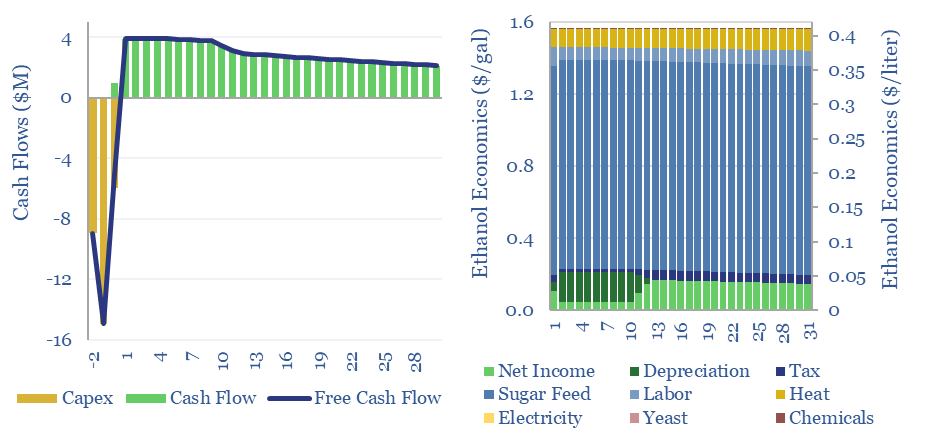
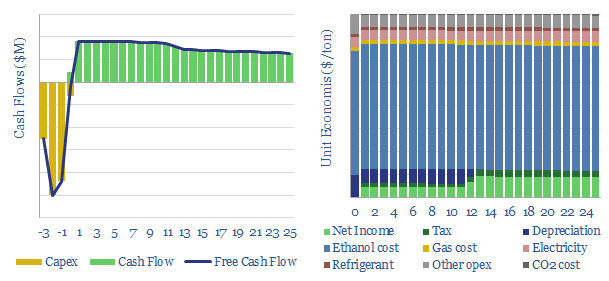
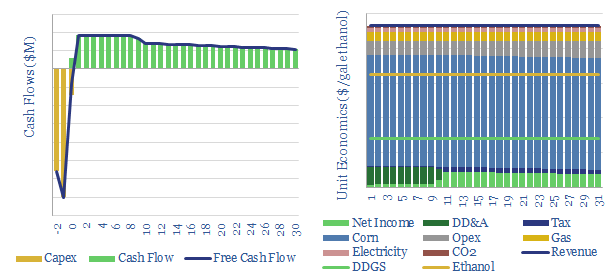
This data-file captures the economics of ethanol production, as a biofuel derived from sugar. A 10% IRR requires $1-4/gallon ethanol, equivalent to $0.25-1/liter, or $60-250/boe. Economics are most sensitive to input sugar prices. Net CO2 intensity is at least 50% lower than hydrocarbons.
Download
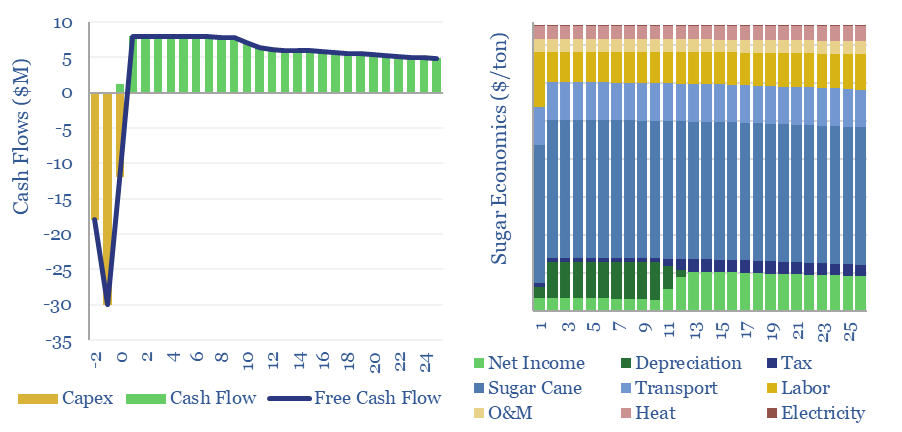
The costs of sugar production are estimated at $260/ton for a 10% IRR at a world-scale sugar refinery, in a major sugar-producing region. Higher returns are achievable at recent world sugar prices, and by valorizing waste streams such as molasses for ethanol and bagasse for cogenerated electricity.
Download
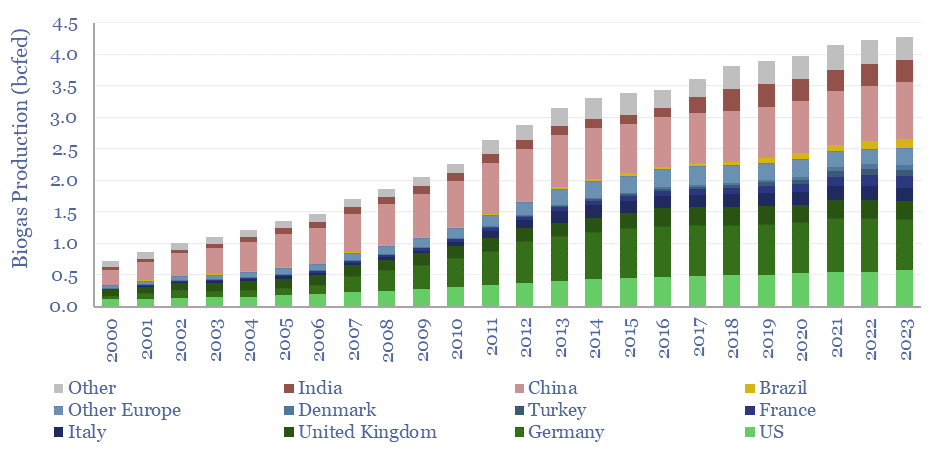
Global biogas production has risen at a 10-year CAGR of 3% to reach 4.3bcfed in 2023, equivalent to 1.1% of global gas consumption. Europe accounts for half of global biogas, helped by $4-40/mcfe subsidies. This data-file aggregates global biogas production by country, plus notes into feedstock sources, uses of biogas and biomethane.
Download
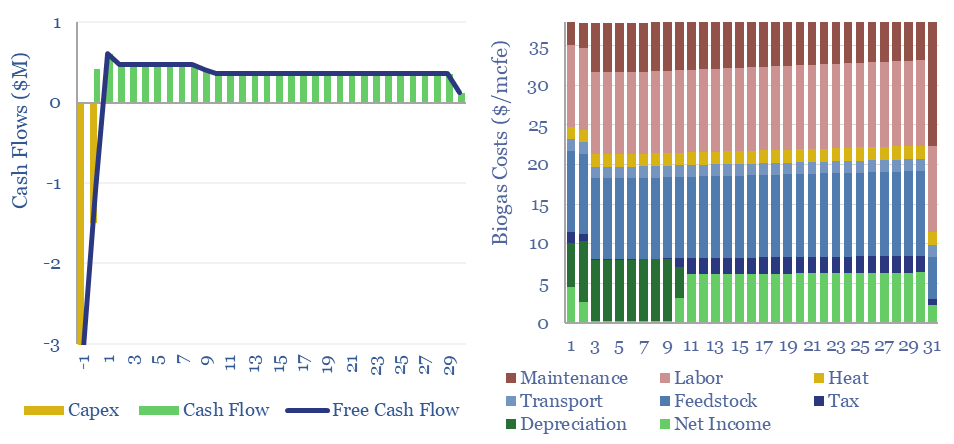
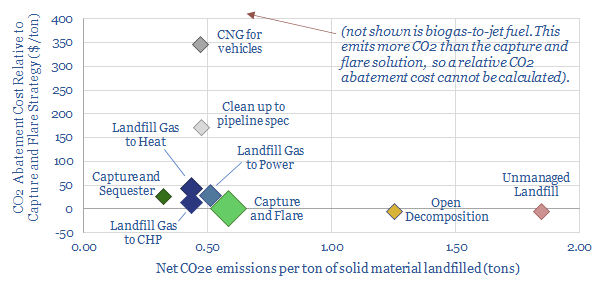
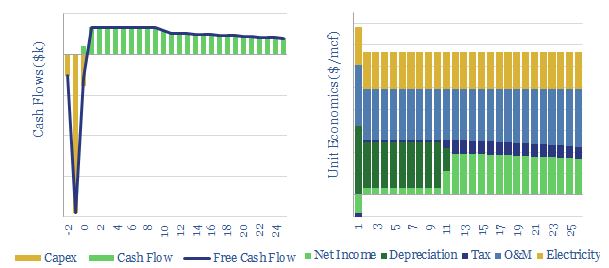
Biogas costs are broken down in this economic model, generating a 10% IRR off $180M/kboed capex, via a mixture of $16/mcfe gas sales, $60/ton waste disposal fees and $50/ton CO2 prices. High gas prices and landfill taxes can make biogas economical in select geographies. Although diseconomies of scale reward smaller projects?
Download
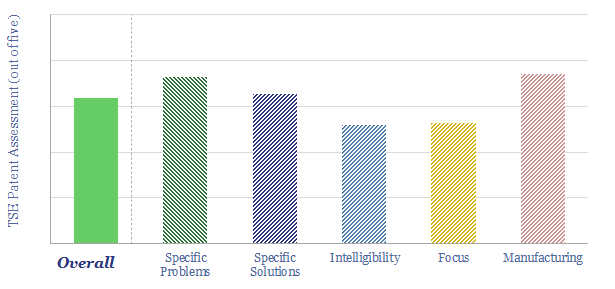
Verbio is a bio-energy company, founded in 2006, listed in Germany, producing bio-diesel, bioethanol, biogas, glycerin and fertilizers. The company has stated "we want to be in a position to convert anything that agriculture can deliver to energy". Our Verbio technology review is based on its patents. We find some fascinating innovations in cold mash ethanol, integrated with biogas production, and making biogas from lignocellulosic feedstock.
Download
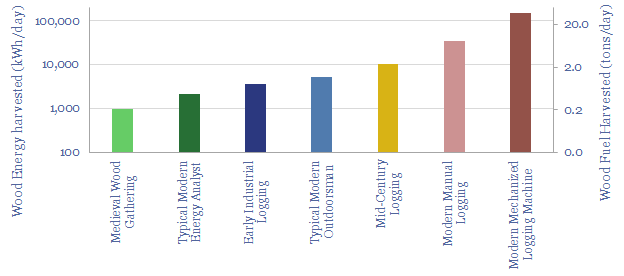
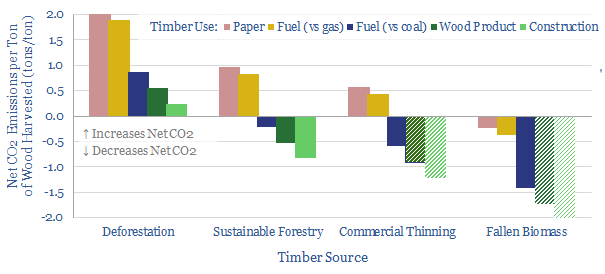
How much wood can be cut in a day? We review 500-years of industrial history. In medieval times, a manorial tenant might have gathered 250kg of fallen branches in a day. A modern feller-buncher is 150x more productive. But a modern energy analyst is little better than a medieval peasant, and harvesting wood as a heating fuel is expensive, inconvenient and risk-prone.
Download
How much does fertilizer increase crop yields? Aggregating all of the global data, a good rule of thumb is that up to 200kg of nitrogen can be applied per acre, increasing corn crop yields from 60 bushels per acre (with no fertilizer) to 160 bushels per acre (at 200 kg/acre). But the relationship is logarithmic, with diminishing returns.
Download
The CO2 intensity of producing corn averages 0.23 tons/ton, or 75kg/boe. 50% is from N2O emissions, a powerful greenhouse gas, from the breakdown of nitrogen fertilizer. Producing 1 kWh of food energy requires 9 kWh of fossil energy.
Download
Bio-coke is a substitute for coal-coke in steel-making and other smelting operations. We model it will cost c$450/ton, c50% more than coal-coke, but saves 2 - 2.5 tons/ton of CO2. Abatement costs can be as low as $70/ton. Although not always, and there are comparability issues.
Download
World food production runs at 10 bn tons per year, equivalent to 25,000 TWH of primary energy, or 7,500 calories per person per day. Of this total, 30% is fed to animals, 30% is wasted, 5% is converted to biofuels and 2% is used in consumer products. Humans eat the remaining 2,500 calories per person per day.
Download
Global palm oil production runs at 80MTpa, for food, HPC and bio-fuels. Carbon intensity is 1.2 tons CO2e per ton of crude palm oil, excluding land use impacts, and 8.0 tons/ton on a global basis including land use impacts. This means once a bio-fuel has more than c35% palm oil in its feedstock, it is likely to be higher carbon than conventional diesel.
Download
How will food and energy shortages re-shape liquid biofuels? This 11-page note explores four questions. Could the US re-consider its ethanol blending to help world food security? Could rising cash costs of bio-diesel inflate global diesel prices to $6-8/gal? Will renewable diesel expansion be dialed back? What outlook for each biofuel in the energy transition?
Download
The carbon credentials of wood are not black-and-white. They depend on context. This 13-page note draws out the numbers and five key conclusions. They count against deforestation, in favor of using waste wood, in favor of wood materials (with some debate around paper) and strongly in favor of natural gas.
Download
Methane emissions from landfills account for 2% of global CO2e. c70% of these emissions could easily be abated for c$5/ton, simply by capturing and flaring the methane. Going further, low cost uses of landfill gas in heat and power can also make good sense. But vast subsidies for landfill gas upgrading or RNG vehicles may not be cost-effective.ย
Download
We estimate that a typical landfill facility may be able to capture and abate 70% of its methane leaks for a CO2-equivalent cost of $5/ton. Other landfill gas pathways get more complex and expensive. Raw and unprocessed landfill gas can be economical to commercialize at a cost of $2-4/mcfe.
Download
Danimer Scientific is a producer of PHA, a biodegradable plastic feedstock. PHA still has commercial challenges in its processing, mechanical properties and 4-5x higher costs than conventional plastics. Yet our patent review finds Danimer has made some specific, intelligible innovations, earning a solid score of 3.5 on our technology framework.
Download
LanzaTech aspires to "take waste carbon emissions and convert them" into sustainable fuels (and bio-plastics) with a >70% CO2 reduction. We have assessed its patents but concluded we cannot yet de-risk the CO2-to-fuels pathway in our energy transition models.
Download
Origin Materials went public via SPAC in February-2021, as it was acquired by Artius Acquisition Inc at a valuation of $1.8bn. Its ambition is to use wood residues to create carbon-negative plastics, cost-competitively with petroleum products. This data-file outlines our conclusions from reviewing patents.
Download
Could new technologies reinvigorate corn-based ethanol? This 12-pageย note assesses three options. We are constructive on combining CCS or CO2-EOR with an ethanol plant, which yields a carbon-negative fuel. But costs and CO2 credentials look more challenging for bio-plastics or alcohol-to-jet fuels.ย
Download
This data-file captures the economics of producing bio-ethylene by dehydration of ethanol. We estimate an ethylene price of $1,600/Tpa is required for a 10% IRR, which is almost 2x higher than a conventional ethane cracker. In a best case scenario, costs could fall below $1,000/ton.
Download
30M acres of US croplands are used to grow corn for ethanol, with a CO2 abatement cost of $200/ton. However, if these same acres were reforested, they could absorb 2x more CO2, while farmers in the mid-West could have higher earnings. Hence could US biofuels be disrupted?
Download
This data-file captures the economics of producing ethanol from corn. Our base case requires a price of $1.6/gallon of ethanol for a 10% IRR on a new greenfield plant, equivalent to $2.4/gallon gasoline. 40% of the US corn crop is diverted into biofuels, but the rationale is marginal.
Download
This 15-page report evaluates a pathway for sustainable aviation fuels, feeding biogas into a Fischer-Tropsch reactor. Bio-GTL will likely cost 3x more than conventional jet fuel, for a 75% reduction in CO2, giving an abatement cost of $550/ton. We still prefer nature-based carbon offsets to decarbonize aviation.
Download
Biochar is a miraculous material, improving soils, enhancing agricultural yields and avoiding 1.4kg of net CO2 emissions per kg of waste biomass. IRRs surpass 20% without CO2 prices or policy support. Hence this 18-page note outlines the opportunity.
Download
Biochar is a carbon negative material, according to our accounting, locking as much as 0.5kg of CO2 into soils per kg of dry biomass inputs. It can also be highly economical, with a base case IRR of 25%. Our full model allows you to stress-test input assumptions.
Download
This screen tabulates details of almost twenty leading companies in the production and commercialization of biochar. The average company was founded in 2012, has 8 employees and 1.2 patents, showing an early-stage and competitive space.
Download
This data-file captures 17 plastic products derived from mechanical recycling, biologically-sourced feedstocks or that is bio-degradable. The 'greenest" plastics are c30% lower in CO2 than conventional plastics, but around 2x more costly.
Download
This model captures the economics and CO2 intensity of methanol production in different chemical pathways. We find exciting potential for bio-methanol and blue methanol. These are logistically simple substitutes for oil products, but with lower carbon content. Full cost breakdowns can be stress-tested in the data-file.
Download
20% of Europeโs renewable electricity currently comes from biomass, mainly wood pellets, burned in facilities such as Draxโs, 2.6GW Yorkshire plant. But what are the economics and prospects for biomass power as the energy transition evolves? This 18-page analysis leaves us cautious.
Download
This data-file captures the economics of producing wood pellets, generating electricity from biomass, and potentially also building a further CCS facility to yield 'carbon negative power' (which is nevertheless more CO2 intensive than burning gas!). Our numbers are backstopped by industry data, including 340 US biomass plants.
Download
Our base case is that a US renewable diesel facility must achieve $4.6/gallon sales revenues (which is c$200/bbl) as it commercializes a product with up to 75% lower embedded emissions than conventional diesel. Similarly, a bio-diesel facility must achieve $3.6/gallon sales on a product with 60% lower embedded emissions.
Download
The global bioethanol industry could be disrupted by a carbon price. Somewhere between $15-50/ton, it becomes more economical to bury the biofuel crop, rather than convert it into biofuels. This would remove 8x more CO2 per acre, at a lower total cost. Ethanol mills and blenders would be displaced.
Download
Greater decarbonization at a lower cost is achievable by burying biomass (such as corn or sugarcane) rather than converting it into bio-ethanol.ย This model captures the economics. Detailed costs and CO2 comparisons are shown under different iterations.ย
Download
US bioethanol plants produce 1Mbpd of liquid fuels, with an average CO2 intensity of 85kg/boe. Overall, corn-based bioethanol has c40% lower CO2 than oil products. We screened the leaders and laggards by CO2-intensity, covering Poet, Valero, Great Plains, Koch, Marathon and White Energy.
Download
This data-file tracks 5,000 patents filed into biofuels: by geography, by company and particularly in 2017-20. The pace of research activity has been waning since 2014. Sinopec screens as the technology leader. The data-file also identifies the 'Top Ten' Western companies, ranked by recent patent filings.
Download
Could the rise of reforestation initiatives erode the value of renewable diesel? This data-file calculates purchasing CO2-credits to decarbonise diesel could cost 60-90% less than purchasing renewable diesel, at current pricing. Economically justified premia for biofuels are calculated.
Download