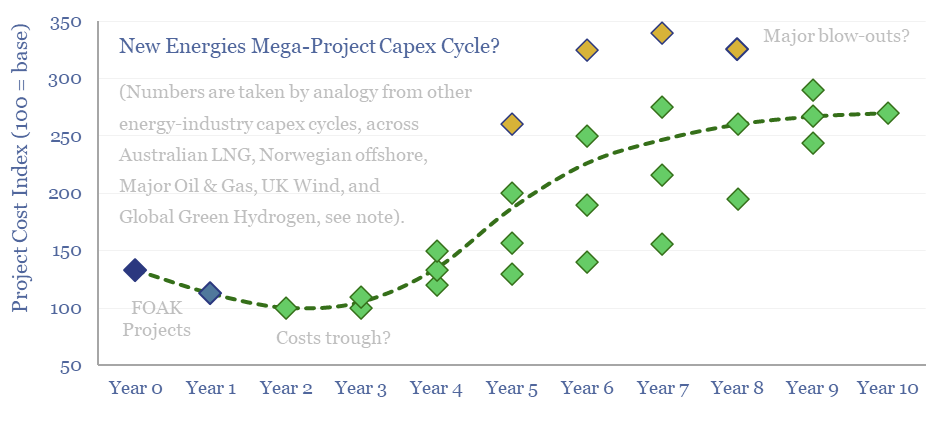
Energy transition is the largest construction project in human history. But building in boom times is associated with 2-3x cost inflation. This 10-page note reviews five case studies of prior capex booms, and argues for accelerating FIDs, even in 2024. The outlook for project developers depends on their timing? And who benefits across the supply chain?
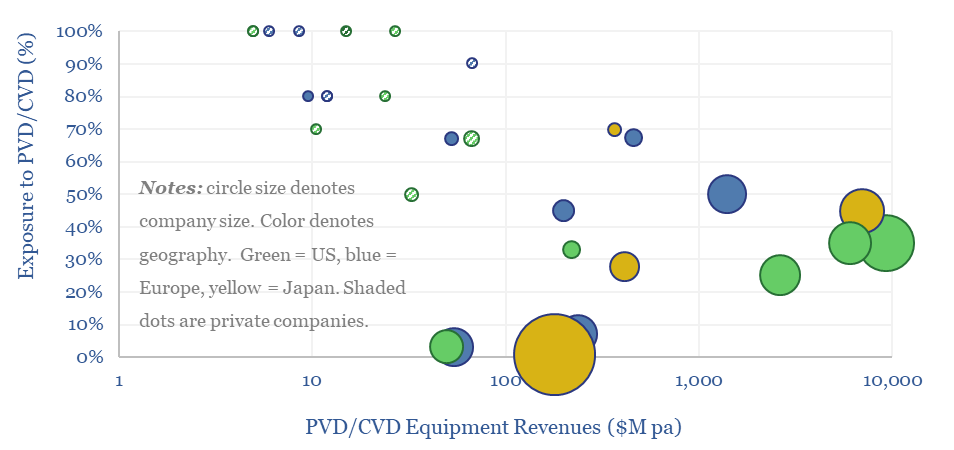
This data-file is a screen of leading companies in vapor deposition, manufacturing the key equipment for making PV silicon, solar, AI chips and LED lighting solutions. The market for vapor deposition equipment is worth $50bn pa and growing at 8% per year. Who stands out?
Vapor deposition uses 250-1,250ºC temperatures and vacuums as low as 1 millionth of an atmosphere, to deposit nm-μm thick layers of ultra-pure materials onto semiconductor and solar substrates, to make PV silicon, solar modules, computer chips, AI chips, LEDs, plus for hardened metals, cutting tools, insulated glass and aluminized food packaging.
We figured that we needed to compile this screen after reviewing LONGi‘s patents in early-2024. The technology underpinning HJTs and TOPCON modules is very clever, but it is clear from the patents, that it all relies upon vapor deposition. Hence who are the crucial shovel-makers here?
Half of the $50bn pa market is dominated by five public companies with 25-50% exposure to vapor deposition and c30% EBIT margins, based on our screen of leading companies in vapor deposition.
In overall Semiconductor Production equipment, the world leader is Applied Materials, which is based in the US, produces vapor deposition for the solar industry plus for the ‘angstrom era’ of chips, and has $170bn of market cap, more than Schlumberger, Baker Hughes and Halliburton combined.
In chemical vapor deposition for the semiconductor industry, a large Japanese company stood out, claiming 43% market share, and also the only integrated product suite covering the four sequential processes of deposition, coating/developing, etching and cleaning.
In the $700M niche of Metal Organic CVD, as used to make 70% of LEDs globally, but also for wide-bandgap semiconductors, such as SiC and GaN, the market leader is a publicly listed German specialist, with 70% market share.
In laser annealing, which can modify chemical properties over 10-100nm within nanoseconds, for making AI chips, a US-listed specialist stood out as a leader, and it also has a well-regarded ion beam deposition line, seen as a successor to PVD as it achieves larger and uniformly deposited grains.
Our experience as energy analysts has been that companies in the semiconductor supply chain are now just as relevant to the future of global energy as those in the subsea supply chain. Hence over time we will add to this screen of leading companies in vapor deposition.
Is Babcock and Wilcox’s BrightLoop technology a game-changer for producing low-carbon hydrogen from solid fuels, while also releasing a pure stream of CO2 for CCS? Conclusions and deep-dive details are covered in this data-file, allowing us to guess at BrightLoop’s energy efficiency and a moat around Babcock’s reactor designs?
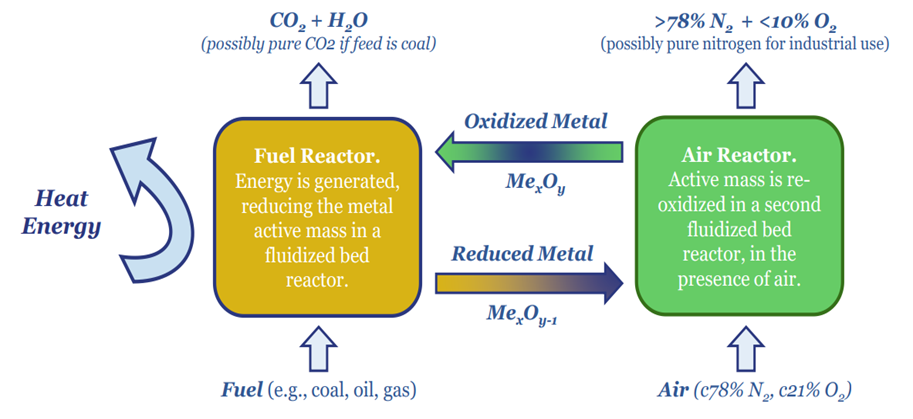
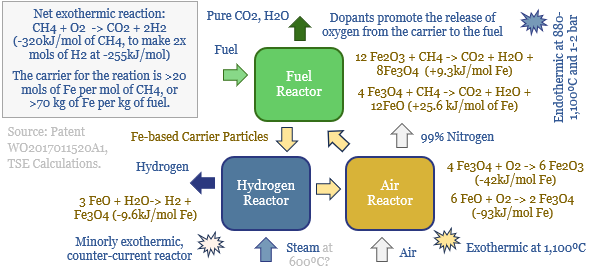
Chemical Looping Combustion harvests the energy from a fuel, while also producing a relatively pure stream of CO2, by avoiding the oxidation of the fuel in air (78% nitrogen) and instead circulating solid carrier particles through separate reactors (schematic below).
Hence what other decarbonized carbon technologies are worth watching? Since 2023, Babcock & Wilcox has been vociferously describing its BrightLoop technology, which is a Chemical Looping Combustion (CLC) technology generating clean hydrogen from hydrocarbon fuels (e.g., coal, biomass, waste or possibly gas).
Babcock & Wilcox is an American energy services company, founded in 1867, headquartered in Akron, Ohio, with 2300 employees, listed on NYSE. It has a $100M market cap at the time of writing, targeting $1bn pa of revenues in 2024 and $100-110M of EBITDA.
Could BrightLoop be a gamechanger? Babcock has said that BrightLoop “greatly reduces the amount of energy and fossil fuel required to produce hydrogen”. And its costs can be “better than current large-scale hydrogen generation technologies such as SMR”. It has been piloted in three locations since 2014. The first commercial unit is in development. And the company has said BrightLoop ultimately has the potential to generate another $1bn pa in revenues.
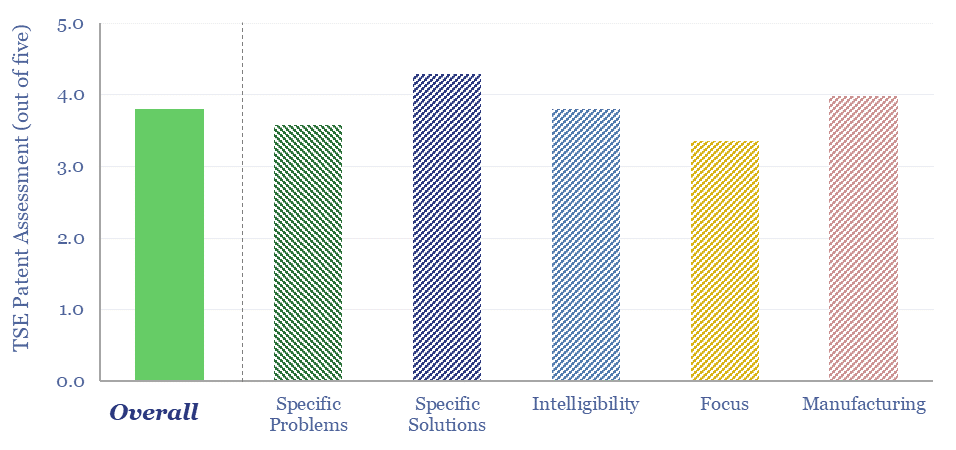
Hence how does BrightLoop technology work? We have reviewed Babcock’s BrightLoop patents in order to address this question. The image below is based on some guesswork from one of three patents in particular.
We think the patents are high-quality, enabling us to guess at the reaction conditions and energy economics of BrightLoop. Conclusions and deep-dive details are covered in this data-file. We also found many underlying components that are locked up with patents.
Future variants of BrightLoop are also suggested by the patents, which could produce both CO and H2, for clean methanol or Fischer-Tropsch fuels.
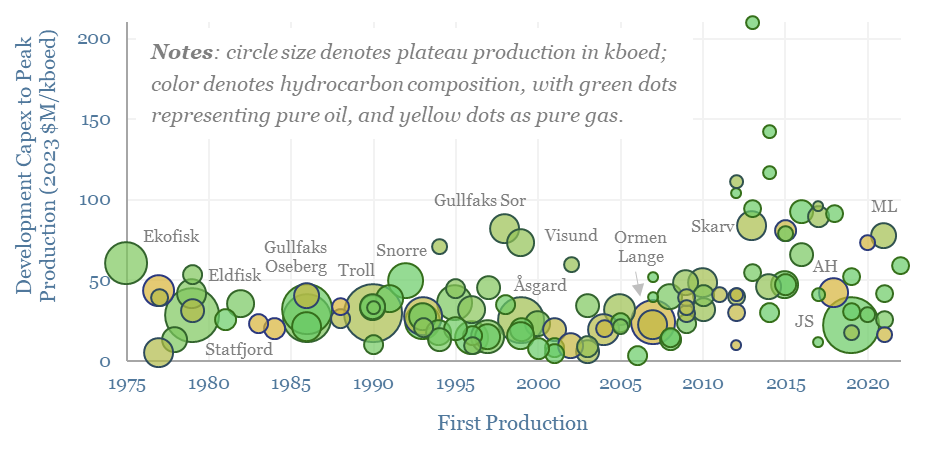
Across 130 offshore oil fields in Norway, going back to 1975, real development capex per flowing barrel of production has averaged $33M/kboed. Average costs have been 2x higher when building during a boom, when one-third of projects blew out to around $100M/kboed or higher. The data support countercyclical investment strategies in energy.
This data-file captures the development capex for 130 oilfields offshore Norway, from 1975-2023, in real 2023 USD per flowing barrel. Specifically, data on each field are publicly available from the Norwegian Offshore Directorate, in NOK, while we have cleaned the data, converted it into USD using historical exchange rates from the Bank of England and then translated the numbers in 2023$ real terms.
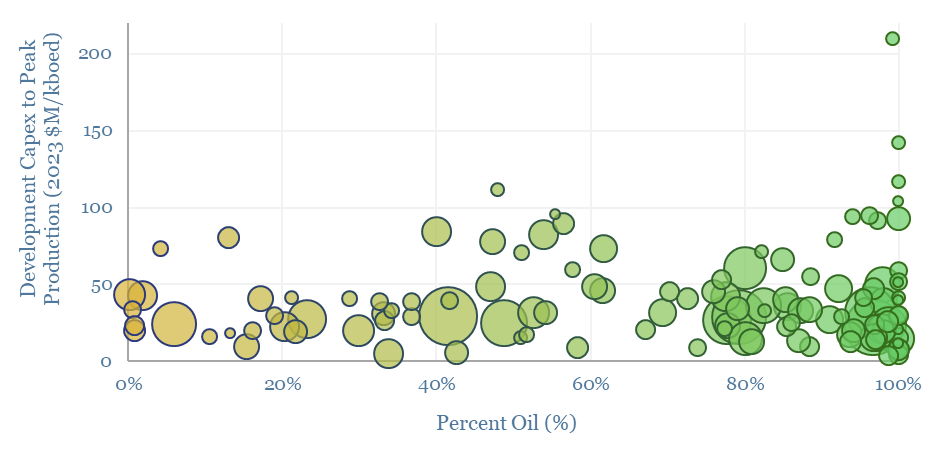
The average Norwegian offshore field cost $33M/kboed to develop, comprising $3.3bn of development capex, peaking at 100kboed of hydrocarbon production, of which two-thirds was liquids and one-third was gas. There was no material difference in the costs of oilfield or gas field developments (chart below).
Development costs can also be indexed over time, running at a relatively constant $30M/kboed in the 1980s, 1990s and early 2000s. Total development capex actually declined from 1970s levels over this time frame, in real terms, due to learning curve effects.
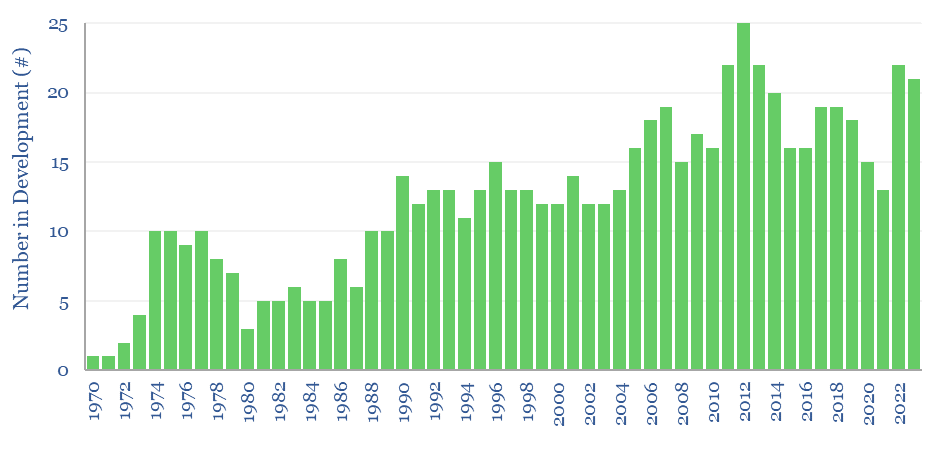
Activity levels have also varied. On average, there have been 12 fields in development across the Norwegian Continental Shelf. However, at peak, there were 20-25 fields under development in 2011-2015.
During this timeframe, the average development cost also doubled to $60-70M/kboed. The distribution of outcomes was also much wider during this timeframe of intense activity levels, with an intensified risk of ‘capex blow-outs’, as one-third of the projects exceeded $100M/kboed.
On the other side of the spectrum, low-cost developments can cost as little as $5-10M/kboed, especially using concepts such as tiebacks and unmanned platforms, and especially when the supply chain had slack capacity. A nice example is Johan Sverdrup. There was also a -16% correlation between field size and offshore development costs.
Our cleaned data-set is available for download below. Across all energy sub-sectors, there are benefits to counter-cyclical investment, whether we are considering oil, gas, LNG, nuclear, wind, solar or power grids.
Solar semiconductors have changed the world, converting light into clean electricity. Hence can thermoelectric semiconductors follow the same path, converting heat into electricity with no moving parts? This 14-page report reviews the opportunity, challenges, efficiency, costs and companies.
Thermoelectric devices convert heat directly into electricity, or conversely provide localized cooling/heating by absorbing electricity. This data-file screens leading companies in thermoelectrics, their product specifications, applications and underlying calculations for thermoelectric efficiency.
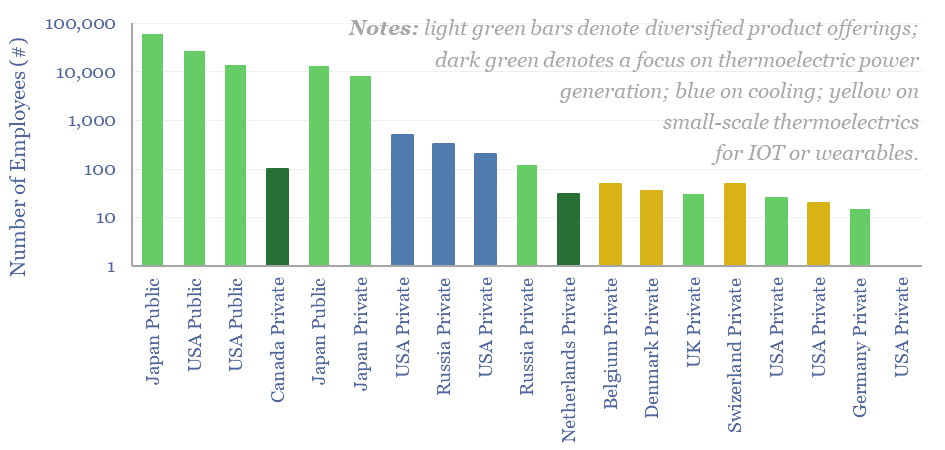
This data-file gives an overview of twenty leading companies in thermoelectrics, producing thermoelectric generators or other devices. Most of them are private with some larger names listed in the United States and Japan.
These companies manufacture thermoelectric modules, power generation systems (via the Seebeck Effect), cooling systems (via the Peltier effect) or small-scale power supplies for IOT and wearable devices.
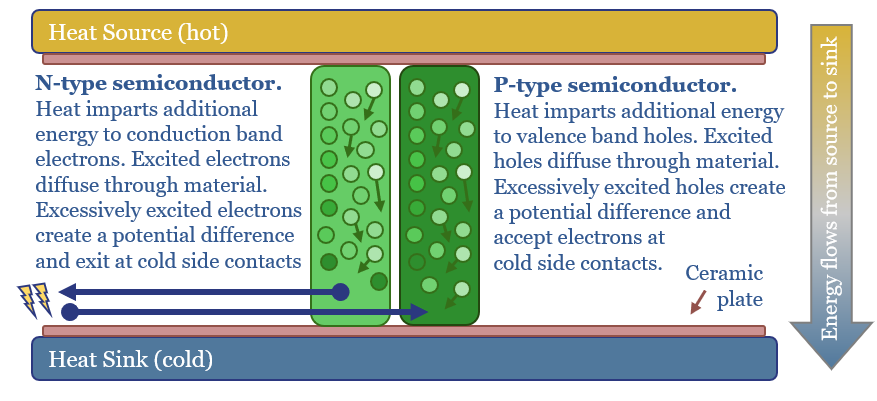
Thermoelectric generators produce power via the Seebeck effect, generating an electromotive force between parts of a conductor that are at different temperatures. The process can also be reversed: by applying voltage to a thermocouple (a junction of two different conductors) one part of it is cooled while another is heated.
Thus, thermoelectrical devices can be used as generators or as temperature regulators. Specific applications, thermoelectric products and their efficiency factors are plotted in the data-file.
Smaller thermoelectric generators are used to power wireless sensors, transmitters, actuators, and other devices among the Internet of Things. Larger generators have been used to power space probes via heat from the decay of onboard radioactive material.
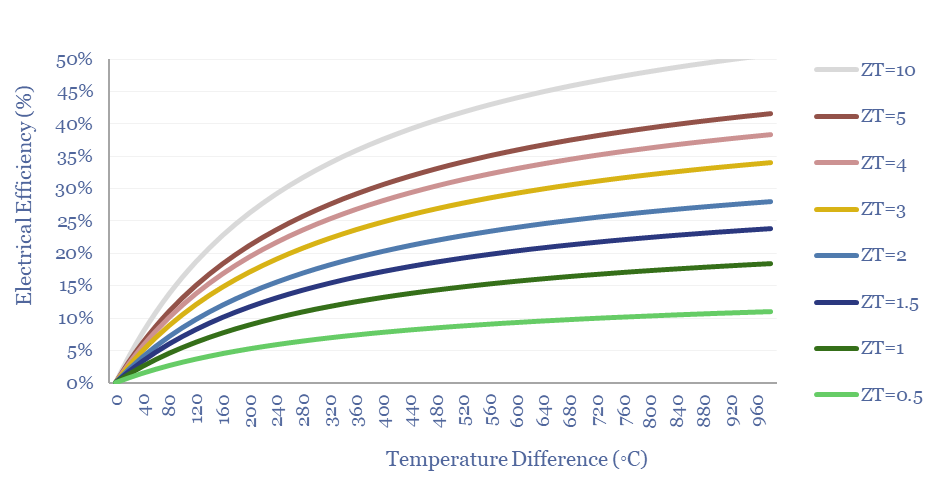
A breakdown of thermoelectric efficiency from first principles is also broken out in the data-file, as a function of the material’s Figure of Merit (aka the ZT score, chart below). ZT can be calculated from Seebeck coefficients, electrical conductivity, and thermal conductivity of mobile electrons and the underlying crystal lattice (numbers in the data-file).
Most commercial materials today have a ZT<1 and therefore have 2-7% module-level efficiencies for thermoelectric generators, through to 0.5-5x Coefficients of Performance for thermoelectric cooling.
We have attempted a detailed breakdown of global energy demand across 50 categories, to identify emerging opportunities in the energy transition, and suggesting upside to energy demand forecasts? This 12-page note sets out our conclusions and is intended as a useful reference.
This data-file is a breakdown of global energy demand by end use, drawing across our entire research library, to disaggregate the global energy system across almost 50 applications. Such as transportation, heat, electricity, materials and manufacturing. Numbers, calculations, efficiencies and heating temperatures are in the data-file.
A breakdown of global energy demand is more challenging. But we have slowly been building up a library of economic models and supply-demand models, looking theme-by-theme, material-by-material, market by market. Hence we have attempted a full granular breakdown of global energy demand by end use here.
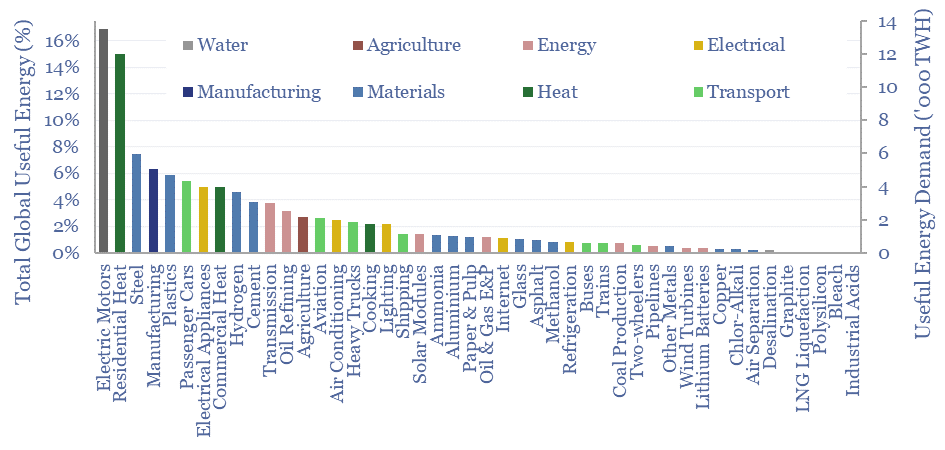
As simple rules of thumb, electricity generation absorbs almost 40% of primary energy, heat is 30%, transportation is almost 25%, and 10% is feedstocks for materials. However, some of the categories overlap. Materials and manufacturing absorb c35% of global primary energy to make 60GTpa of stuff, drawing upon electricity, heat and feedstocks.
A breakdown of primary global energy demand by category is plotted below. The largest categories are electric motors (15%), passenger cars (13%), residential heat (10%), manufacturing processes (6%) and other electrical appliances (5%). Although note that this is also because these are some of the broadest categories in the data-file.
The database of global energy demand also allows us to quantify the most and least efficient value chains. For example, passenger cars comprise c13% of global primary energy in the chart above but only c5% of global useful energy, due to the relatively low efficiency in internal combustion engines. Conversely, residential heat is highly efficient, comprising c10% of primary energy above but 13% of useful energy.
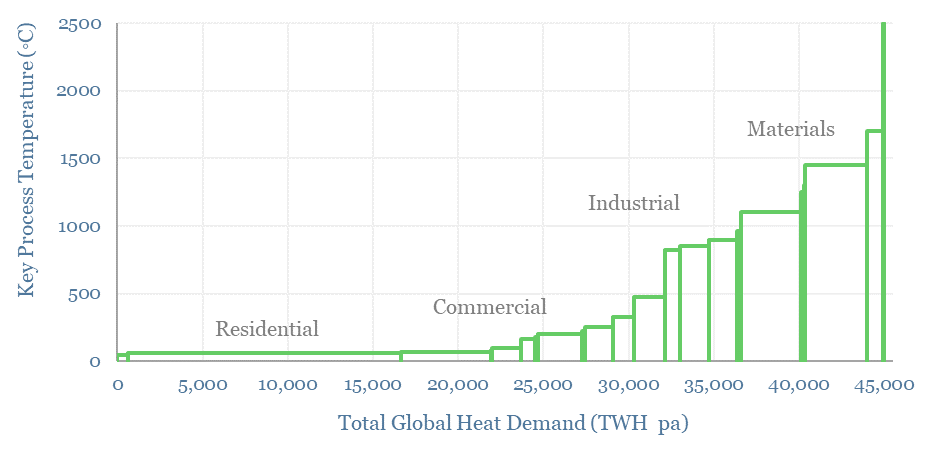
The breakdown of global energy demand by end use also allows us to disaggregate global heat, which comprises 30% of primary global energy. 50% is used residentially or commercially at temperatures below <100◦C. Conversely, at the other end of the spectrum, 20% is ultra-hot industrial heat >1,000◦C (chart below).
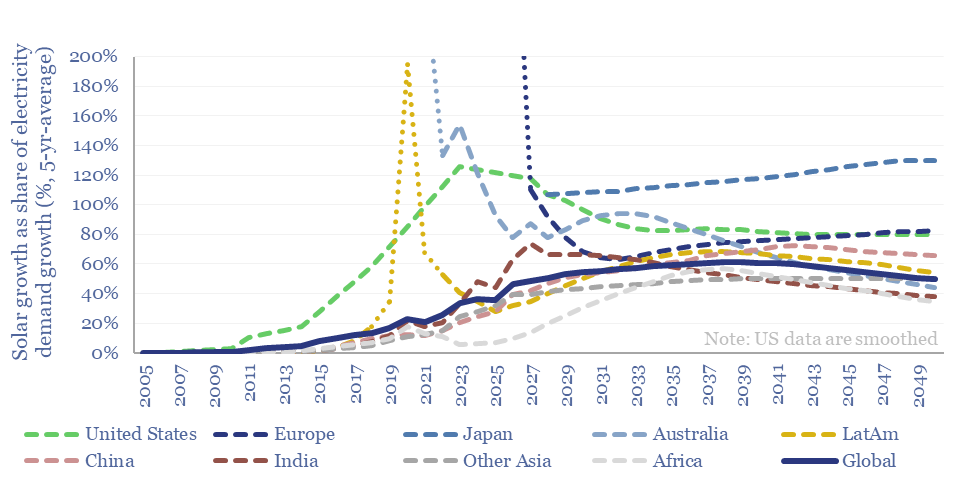
How much new solar can the world absorb in a given year? And are core markets such as the US now maturing? This 15-page note refines our solar forecasts using a new methodology. Annual solar adds will likely plateau at 50-100% of total electricity demand growth in most regions. What implications and adaptation strategies?
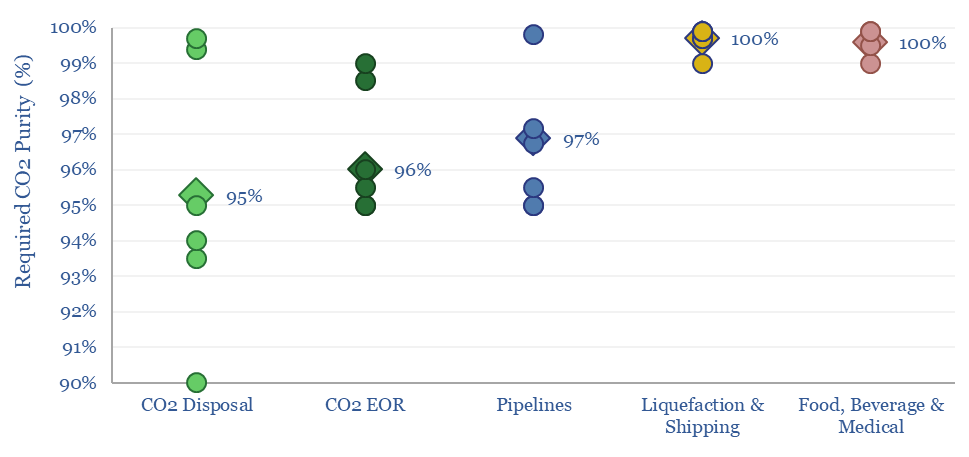
The minimum CO2 purity for CCS starts at 90%, while a typical CO2 disposal site requires 95%, CO2-EOR requires 96%, CO2 pipelines require 97% and CO2 liquefaction or shipping requires >99%. This data-file aggregates numbers from technical papers and seeks to explain CO2 purity for transport and disposal.
Energy efficiency is the first reason that CO2 purity matters. As a very simple rule of thumb, compressing a gas stream to 80-200 bar requires 90-120 kWh/ton of compression energy. If the gas stream is only 90% CO2, then the energy costs per unit of CO2 are around 10% higher.
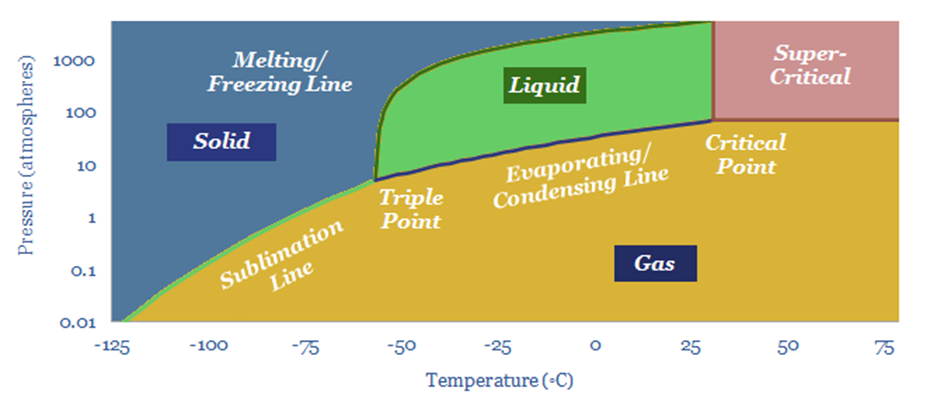
Or more. The reason it is necessary to compress CO2 to >80-bar is so that the CO2 will transition into a dense (super-critical) phase. The phase diagram below shows the critical point for pure CO2. But impurities require higher pressures before CO2 reaches supercriticality.
Larger pipelines are also required to move larger quantities of gas at higher pressures. This matters because larger pipelines with thicker walls have higher capex costs, per our data-file into gas pipeline costs.
The other key reason that CO2 purity matters for CCS is that if the gas stream has less than 100% CO2, then by definition, it must contain something else. Clearly, issues will arise is the ‘what else’ is toxic or hazardous (e.g., H2S, amine degradation products such as nitrosamines, NOx, SOx, etc). But even innocuous contaminants can have an impact.
Water is a key impurity that must be managed in a CO2 pipeline. If puddles of water precipitate out, then they will slowly start dissolving CO2, and greatly accelerate pipeline corrosion. CO2 + H2O -> H2CO3 (carbonic acid). H2CO3 -> 2H[+] + CO3[2-]. Fe(s) + 2H[+](aq) -> Fe[2+] (aq) + H2 (g). It is never good to dissolve your pipeline from the inside out. Furthermore, the H2 can cause further stress cracking.
Hence water is usually limited to <500ppm, ideally <50ppm. This is more of a convention than a hard rule (examples are tabulated in the data-file). Usually, as much as 4,450 ppm of water will be soluble in pure CO2 at 40◦C and 100-bar pressures. Even with 10% nitrogen impurities, this only reduces to 3,400 ppm. Some amine breakdown products, or NO2 can have a more “dramatic effect” on the width of the phase envelope.
But there is also always a margin of safety for cold spots, bends in the pipeline or in the case of depressurization. A pipeline operator has the prerogative to set whatever standards it deems necessary to protect the longevity and efficiency of its investment. Off-spec CO2 may be charged a materially higher transportation tariff if it is accepted at all.
CO2-EOR also requires a higher purity than straight-run CCS, in order to promote miscibility of the CO2 with oil in the subsurface, which will help to swell and mobilize it. This is less important for simple geological disposal.
CO2 purity for CCS will generally need to be above 95%, and ideally will be as high as possible. This favors CCS technologies that can create highly concentrated CO2 streams from exhaust gases of differing CO2 concentrations. But the limits are not overly strict, or likely to deter CCS, in our view. For more related research, please see our overview of CCS value chains.
Cookies?
This website uses necessary cookies. Our cookies are simply to improve your experience. We do not undertake any advertising or targeting via our cookies. By clicking 'accept' or continuing to use the website, you consent to our use of cookies.AcceptRead More
Privacy & Cookies Policy
Privacy Overview
This website uses cookies to improve your experience while you navigate through the website. Out of these, the cookies that are categorized as necessary are stored on your browser as they are essential for the working of basic functionalities of the website. We also use third-party cookies that help us analyze and understand how you use this website. These cookies will be stored in your browser only with your consent. You also have the option to opt-out of these cookies. But opting out of some of these cookies may affect your browsing experience.
Necessary cookies are absolutely essential for the website to function properly. This category only includes cookies that ensures basic functionalities and security features of the website. These cookies do not store any personal information.
Any cookies that may not be particularly necessary for the website to function and is used specifically to collect user personal data via analytics, ads, other embedded contents are termed as non-necessary cookies. It is mandatory to procure user consent prior to running these cookies on your website.