This article summarizes our conclusions into power grids and power electronics, across all of Thunder Said Energy’s research. Where are the best power grid opportunities in the energy transition?
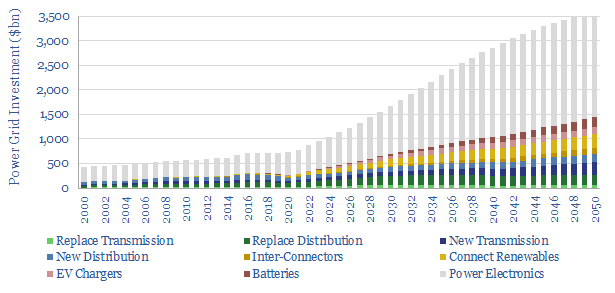
Power grids move electricity from the point of generation to the point of use, while aiming to maximize power quality, minimize costs and minimize losses. Broadly defined, global power grids and power electronics investment must step up 5x in the energy transition, from $750bn pa to over $3.5trn pa. This theme gets woefully overlooked. This also means it offers up some of the best opportunities in the energy transition.
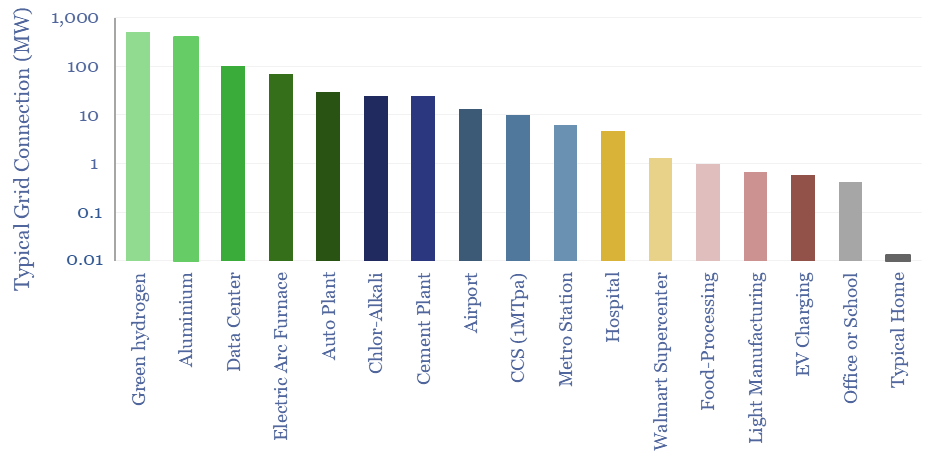
(1) Electrification is going to be a major theme in the energy transition, a mega-trend of the 21st century, as the efficiency and controllability of electrified technology is usually 3-5x higher than comparable heat engines. It is analogous to the shift from analogue to digital. 40% of the world’s useful energy is consumed as electricity today, rising to 60% by 2050 (note here — our best overview of the upside in grids) propelling the efficiency of the primary global energy system from 45% today to 60% by 2050 (note here). Power demands of a typical home will also double from 10kW to 20kW in the energy transition (data here). Electricity demands of industrial facilities are aggregated here.
(2) Electricity basics are often misunderstood? If we have one salty observation about power markets, it is that many commentators seem to love making sweeping statements without understanding much at all. It is the energy market equivalent of wandering in off the street to an operating theater, and without any medical training at all, simply picking up a scalpel. This is a little bit sad. But it also means there will be opportunities for decision makers that do understand electricity and power systems. As a place to start, our primer on power, voltage, current, AC, DC, inertia and power quality is here.
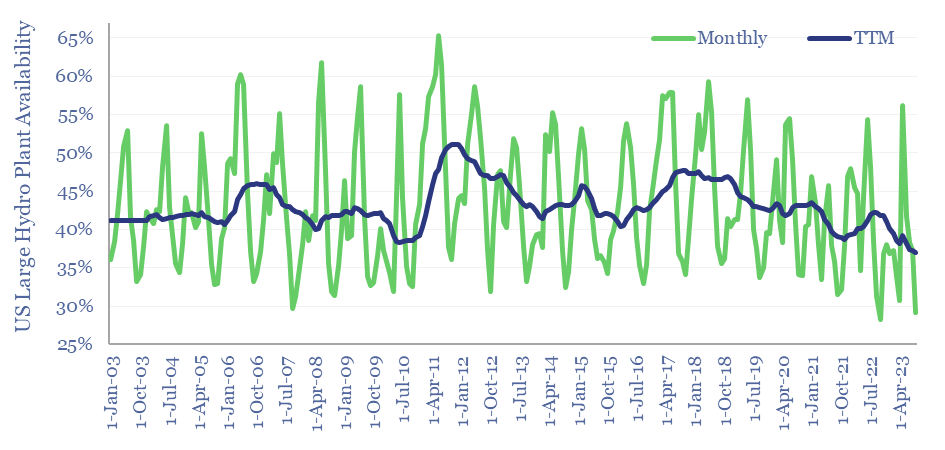
(3) Power generation costs 5-15c/kWh. But variations within each category are much wider than between categories (note here). So generation will not be a winner takes all market, where one “energy source to rule them all” pushes out all the others. This view comes from stress testing IRR models of wind, solar, hydro, nuclear, gas, coal, biomass, diesel gensets and geothermal. And from 400-years of energy history. The average sizes of power generation facilities are here, and typical ramp rates are here.
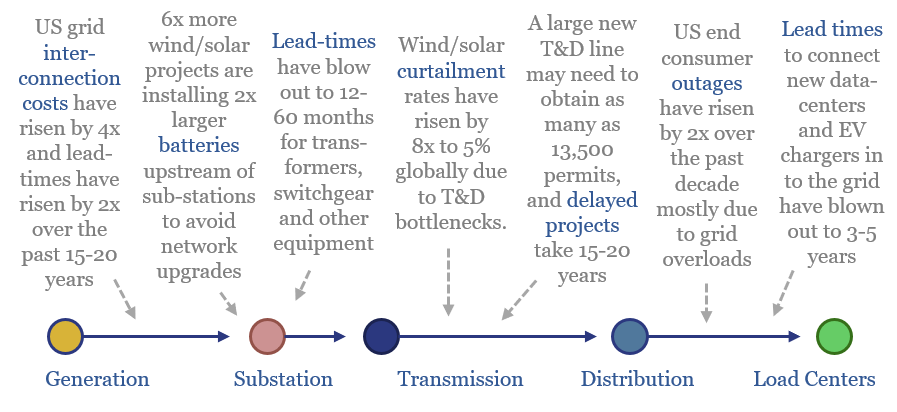
(4) Transmission is becoming the key bottleneck on renewables and electrification in the energy transition. Each TWH pa of global electricity demand is supported by 275km of power transmission and 4,000km of distribution (data here). Connecting a new project to the grid usually costs $100-300/kW over 10-70km tie-in distances (data here). But bottlenecks are growing. The approval times to connect a new power plant to the grid have already increased 2.5x since the mid-2000s, averaging 3-years, especially for wind and solar, which take 30% and 10% longer than average (data here). Avoiding these bottlenecks requires power grids to expand. Spending on power grids alone will rise from $300bn pa to over $1.2trn pa, which is actually larger than the spending on all primary energy production today (data here).
(5) Power transmission also beats batteries as a way of maximizing renewable penetration in future grids. Rather than overcoming intermittency — solar output across Europe is 60-90% inter-correlated, wind output is 50-90% inter-correlated — by moving power across time, you can solve the same challenge by moving them over a wider space. A key advantage is that a large and extensive power grid smooths all forms of renewables volatility, from a typical facility’s 100 x sub-10-second power drops per day to the +/- 6% annual variations in solar insolation reaching a particular point of the globe. By contrast, different batteries tend to be optimized for a specific time-duration, while at long durations, the economics become practically unworkable. A new transmission line usually costs 2-3c/kWh per 1,000km (model here). Additional benefits for expanded power grids accrue in power quality, reliability and resiliency against extreme weather. These benefits will be spelled out further below…
(6) Upside for transmission utilities and suppliers? Our overview of how power transmission works is here. Operating data for high voltage transmission cables are here. Leading US transmission and distribution utilities are screened here. Leading companies in HVDCs are here. Offshore cable lay vessels are screened here. We have also screened Prysmian patents here. But the opportunity space is also much broader, which becomes visible by delving into how power grids work…
(7) Cabling materials. As a general rule, overhead power lines are made of aluminium, due to its light weight and high strength. Conversely, HVDC cables and household wiring are made of copper, which is more conductive. HVDCs are also encased in specialized plastics. New power transmission lines add 3-5MTpa of demand to aluminium markets, or 5-7% upside (note here). But we are more worried about bottlenecks in copper (where total global demand trebles) and silver.
(8) Transformers and specialized switchgear are needed to step the voltage up or down to a precise and prescribed level at every inter-connection point in the grid. The US transmission network operates at a median voltage of 230kV, which keeps losses to around 7%. Energy transition could double the transformer market in capacity terms and increase it by 30x in unit count (note here, costs and companies screened here), surpassing $50bn pa by 2035. Downstream of these transformers, the power entering industrial and commercial facilities will often remain at several kV, which requires specialized switchgear to prevent arcing. We see the MV switchgear market trebling to over $100bn pa by 2035.
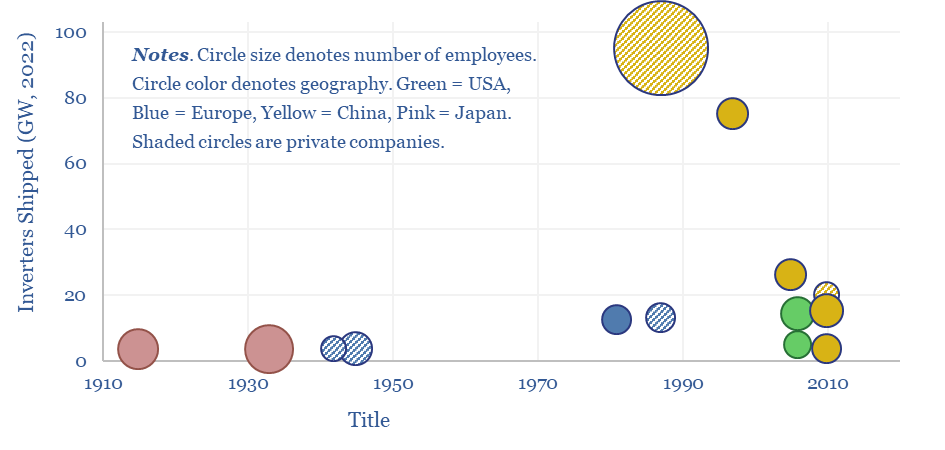
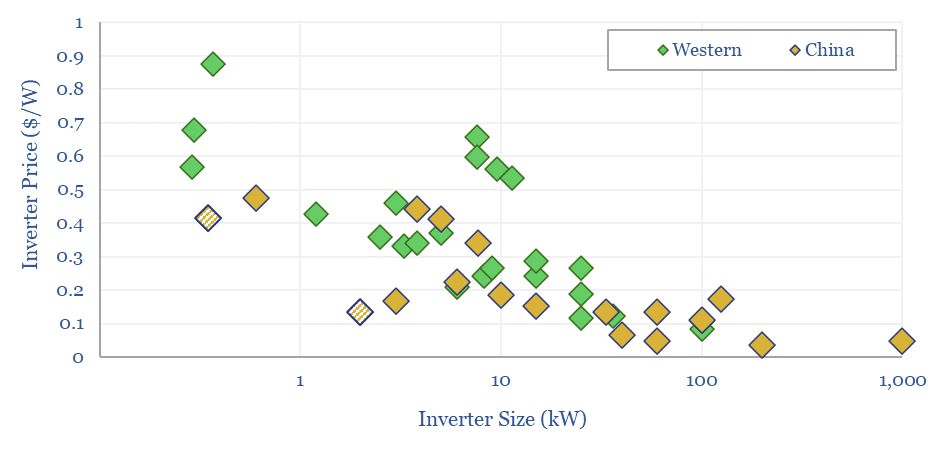
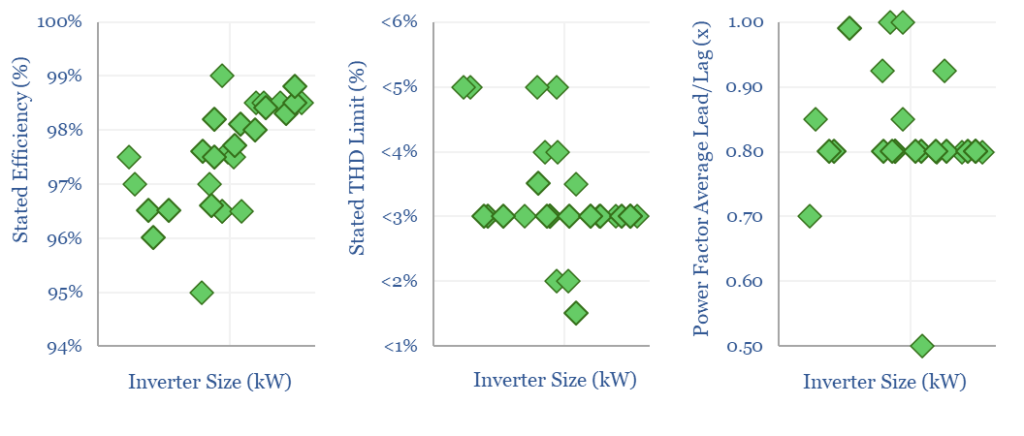
(9) AC and DC. Wind and solar inherently produce DC power, but most transmission lines are AC. Hence they must be coupled with inverters and converters. At the ultimate point of use, AC power also usually needs to be rectified back to DC and bucked/boosted to the right voltage for each machine or appliance. The same goes for EV charging and EV drive trains. DC-DC conversion, AC-DC rectification and DC-AC inversion are effectively consolidating around MOSFETs. And we think one of the most interesting incremental jolts for the energy transition is the 1-10pp higher efficiency and rising market share of SiC MOSFETs. Leading companies in SiC and MOSFETs are screened here.
(10) Inertia and frequency regulation. All of the AC power generators in the grid are running in lockstep, ‘synchronized’ at around 50 Hertz in Europe and 60 Hz in the US. But the frequency of all the power generators in the grid changes second by second. If there is a slight under-supply of power, then what prevents the grid from collapsing is that energy can be harvested from the rotational energy of massive turbines weighing up to 4,000 tons and spinning at 1,500 – 6,000 rpm, as they all slow down very slightly. This sorcery is called ‘inertia’. Wind and solar do not inherently have any inertia (no synchronized spinning). But there are ways of partially mimicking inertia or adding synthetic inertia to the grid through flywheels, supercapacitors, synchronous condensers, batteries, smart energy. Our grid models reflect growing demand for infrastructure in all of these categories.
(11) Reactive power compensation. Apparent power (in kVA) consists of two components: real power (in kW) and reactive power (in kVAR). Inductive loads consume reactive power as the creation of magnetic fields draws the current behind the voltage in an AC wave. This lowers power factor in the grid, amplifies the current that must flow per unit of real power, and thus amplifies I2R losses. Large spinning generators have historically provided reactive power to energize transmission lines and compensate for inductive loads. Again, wind and solar do not inherently provide reactive power compensation and have historically leaned on the rotating generators. Renewable heavy grids will need to add reactive power compensation, expanding this market by a factor of 30x. The best opportunities are in STATCOMs and SVCs (leading companies screened here), capacitor banks at industrial facilities and Volt-VAR optimization at the grid edge.
(12) Electric vehicle charging: find the shovel-makers? Each 1,000 EVs will likely require 40 Level 2 chargers (30-40kW) and 3 Level 3 fast-chargers (100-200kW), so our numbers ultimately have $100bn pa being spent on EV charging in 2025-50. But we wonder whether EV chargers will ultimately become over-built, and the best opportunities will be in supplying components and materials to these chargers, rather than owning the infrastructure itself. Our best single note on this topic is here. Economics of EV charging stations and conventional fuel retail stations make a nice comparison.
(13) Motor drivers are another huge efficiency opportunity. There are 50bn electric motors in the world, consuming half of all global electricity. But most motors are inefficient, rotating at fixed speeds determined by the frequency of the AC power grid, rotating faster than they need to, which matters as power consumption is a cube function of rotating speed. One of the best efficiency opportunities in the grid expands the role of variable frequency drives to optimize motors (note here). Economics are screened here and leading companies are covered here. All of our work into electric motor efficiency and reliability is linked here.
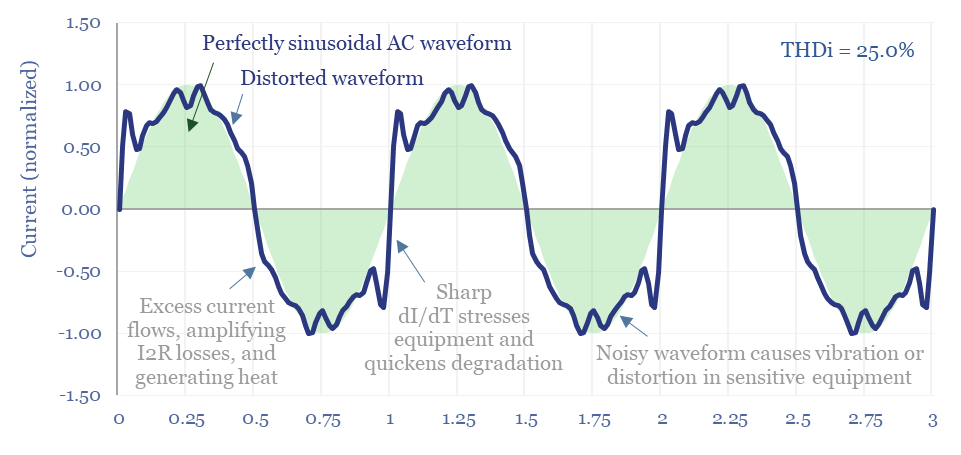
(14) Without reliable and high-quality power grids, frankly, things will break. This is a statement made in patents and technical papers, again and again, discussing how lagging power quality enhances maintenance and breakage costs of expensive equipment. Fundamentally, this is why we think that commercial and industrial power consumers will increasingly invest more in power electronics, and there are so many hidden power grid opportunities in the energy transition.
(15) Power electronics is the broad category of capital goods that encompasses effectively everything discussed on this page. And this summary has hardly even scratched the surface. We think pure power electronics spending trebles from $300bn pa to $1trn pa by 2035 (model here). It is the same group of companies coming up again and again in this space (best note here). For example, we have attempted to break down Eaton’s revenues across 10,000 SKUs in 200 different categories here. We do think that the complexity in power grids and power electronics creates opportunity for decision makers that can grasp it.
All of our research — PDF research reports, data-files, economic models and company screens — into power grid opportunities in the energy transition is summarized below, in chronological order of publication.

