Global energy: supply-demand model?

global energy supply-demand

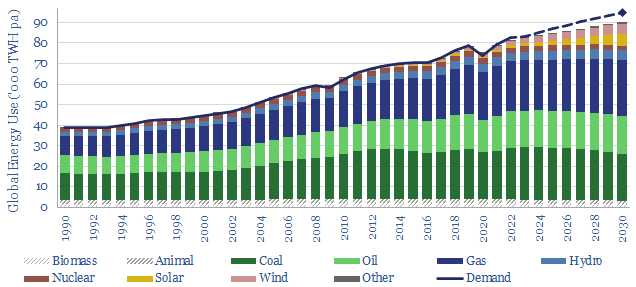
This global energy supply-demand model combines our supply outlooks for coal, oil, gas, LNG, wind and solar, nuclear and hydro, into a build-up of useful global energy balances in 2023-30. We fear chronic under-supply if the world decarbonizes, rising to 5% shortages in 2030. Another scenario is that emerging world countries bridge the gap by ramping coal. Numbers can be stress-tested in the model.


Useful global energy demand grew at a CAGR of +2.5% per year since 1990, and +3.0% per year since 2000. Demand would ‘want’ to grow by +2% per year through 2030, due to rising populations and rising living standards (model here). We have pencilled in +1.75% pa growth to this model to be conservative.

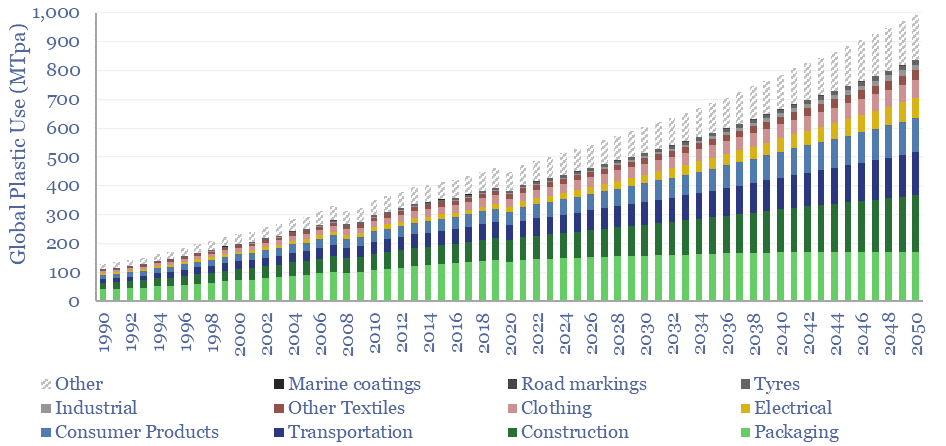
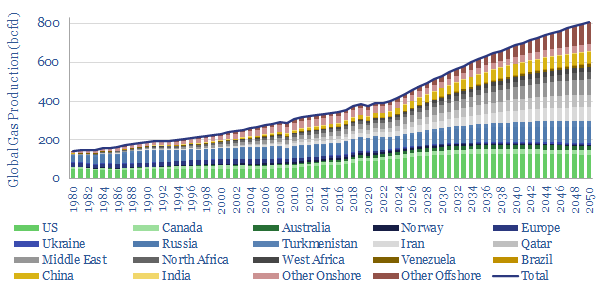
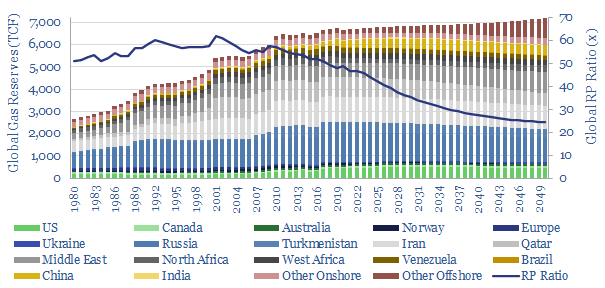
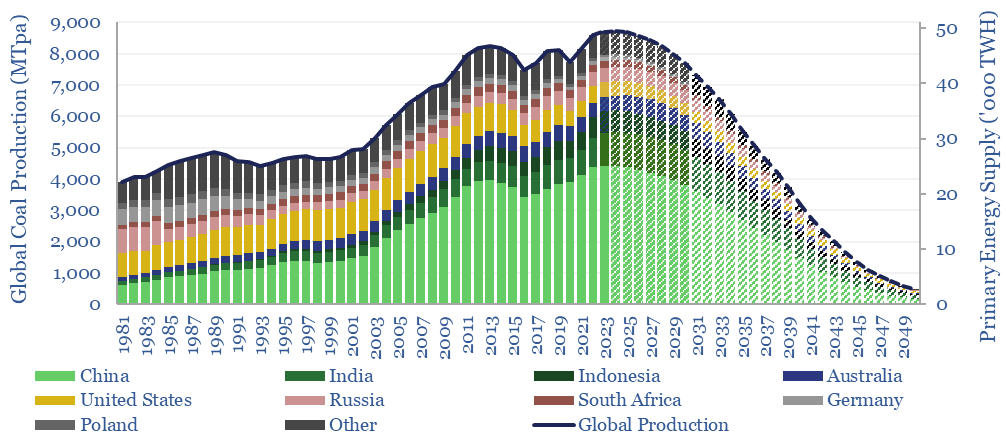
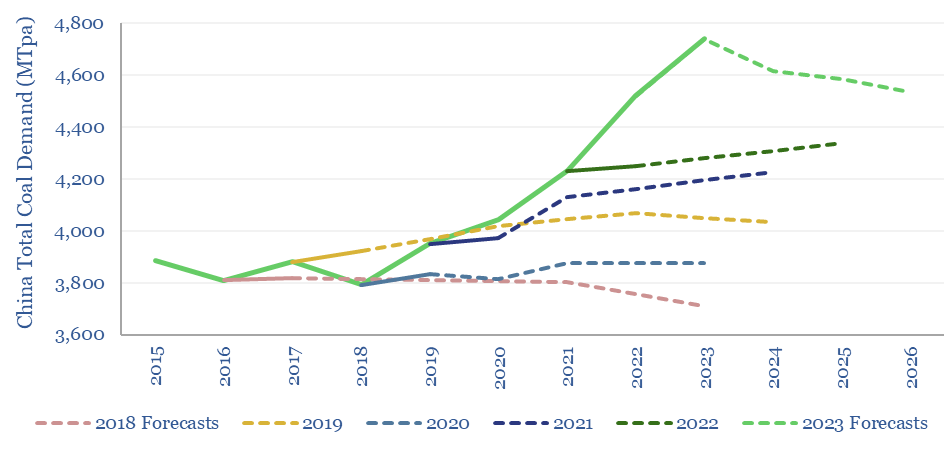
Combustion energy is seen flat-lining in our net zero scenario. This includes global coal use peaking at 8.4GTpa in 2024 then gently easing to 2010 levels by 2030 (model here). It includes oil demand, rising to 102Mbpd in 2024 (data here), then plateauing (model here) as OPEC and US shale (model here) offset the decline rate impacts of conventional under-investment. It includes risked LNG supplies rising +70% from 400MTpa in 2022 to almost 700MTpa by 2030 (model here). While our roadmap to net zero would need to see global gas growing at +2.5% per year through 2050 (model here), this data-file has pencilled in flat production in 2022->30, as we think that latter scenario currently looks more likely to transpire.

Renewable energy is exploding. Our model of wind and solar capacity additions is linked here and discussed here. In our roadmap to net zero, solar more than doubles from c220GW of new adds in 2022 to 500GW by 2030, while wind rises from c100GW of new adds in 2022 to 150GW by 2030.

Other variables in the model include rising energy efficiency (note here), the need for a nuclear renaissance (note here) and other variables that can be flexed.

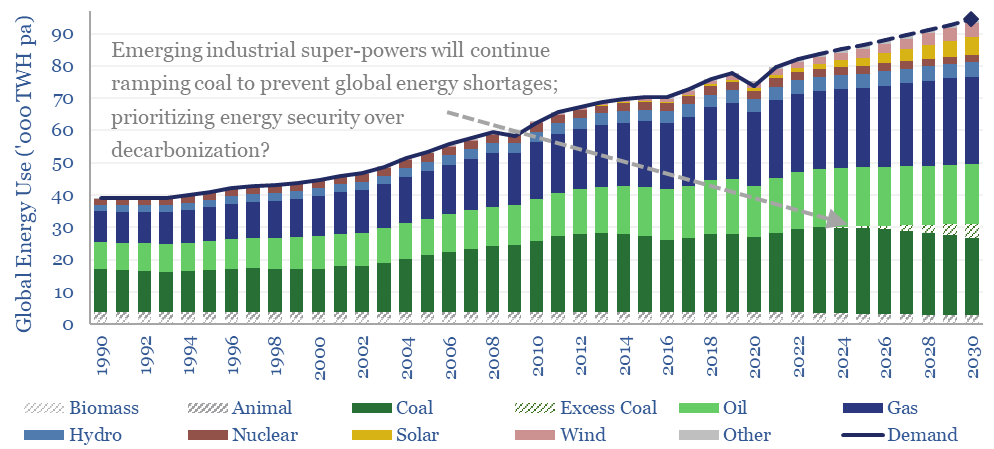
What is wrong with this balance is that it does not balance. The assumptions pencilled into the model see an under-supply of global energy of about 3% in 2025, rising to 5% in 2030. I.e., by 2030, the world will be “half a Europe” short of energy. The first law of thermodynamics dictates that energy demand cannot exceed supplies. So what would it take to restore the balance? Well, pick your poison…

(1) Slower demand growth could re-balance the model. Very high energy prices might mute demand growth to only +1.25% per year, although this would be the slowest pace of demand growth since the Great Depression, lower even than during the oil shocks (useful data here). Unfortunately, our view is that pricing people out of the global energy system in this way is in itself an ESG catastrophe.

(2) Ramping renewables faster could re-balance the model, although it would require an average of 1 TW pa of wind and solar capacity additions each year in 2024-30, and over 2 TW pa of wind and solar additions by 2030 itself, which is 3x higher than in our roadmap to net zero (discussion here). For perspective, this +2TWpa solution requires primary energy investment to quadruple from $1trn pa to at least $4trn pa, which all needs to be financed in a world of rising rates. It means that global wind and solar projects will consume over 200MTpa of steel, which is 2x total US steel production, and yet steel would not even qualify as a ‘top ten’ bottleneck, in our wind bill of materials or solar bill of materials. This scenario also requires a 3x faster expansion of power grids and power electronics than our base case estimates (see the links). Is any of this remotely possible?

(3) Continue ramping coal? The main source of global energy demand growth is the emerging world. The emerging world is more likely to favor cheap, dirty coal. Or worse, deforestation for firewood. Thus another way to ameliorate under-supply in our global energy supply-demand balance is if global coal continues growing, reaching a new peak of 9GTpa in 2030. Unfortunately, this scenario also sees global CO2 hitting a new peak of 54GTpa in 2030.

(4) Pragmatic gas? Another means of re-balancing the global energy system is if global gas production rises at 2.5% per year, which is the number required, and that is possible, on the TSE roadmap to net zero (model here). This scenario does see global CO2 falling by 2030. The main problem here is that pragmatic natural gas investment has become stranded in no man’s land, within a Manichean duality of fantasies and crises.

(5) Some combination? The world is complex. It is unlikely that a single lever will be pulled to resolve under-supply in our global energy supply-demand balance. In 2023, we think economic weakness will mask energy under-supply, mute energy prices, and lure many decision makers into looking at spot pricing and thinking “everything is fine”. Please download the model to stress-test the numbers, and different re-balancing solutions…

Market concentration by industry in the energy transition?

Market concentration by industry

What is the market concentration by industry in energy, mining, materials, semiconductors, capital goods and other sectors that matter in the energy transition? The top five firms tend to control 45% of their respective markets, yielding a ‘Herfindahl Hirschman Index’ (HHI) of 700.


This data-file compiles market concentration data across 30 company screens that we have built to-date, across our energy transition research. Specifically, we know the market share of different companies based on these screens.

A useful rule of thumb across the data-set is that the top five firms tend to control 45% of their respective markets, ranging from 20% in the least concentrated industries to 100% in the most concentrated.

The average ‘Herfindahl Hirschman Index (HHI) of energy, materials and manufacturing sectors is 700, varying from 200 in the least concentrated industries to 4,000 in the most concentrated ones.

Does market concentration determine profitability? 50% correlations are found between concentration and operating margins over the cycle within these industries.

Energy sectors covered in the database of market concentration by industry include global LNG, US E&P, US refining, Western coal, LNG shipping. Mining sectors covered include aluminium, copper, cobalt, lithium, nickel, uranium, silica and silver.

Market concentration by industry
Correlation between market concentration and operating margins in energy and mining

Materials and manufacturing sectors covered in the data-file include ASUs, autos, battery binders, carbon fiber, gas turbines, glass fiber, hydrogen, methanol, mining equipment, polyurethanes, vacuum pumps, VFDs, wind turbines, and different grades of semiconductors.

Market concentration by industry
Correlation between market concentration and operating margins in materials, manufacturing and semiconductors

Energy and mining are less concentrated than materials, capital goods and semi-conductors, in-line with the idea they are ‘commodities’.  

The data-file also covers market size, which itself correlates both with market concentrations and profitability structures. Although we also maintain a larger database for market sizing in the energy transition.

Market concentration matters for decision makers in the energy transition. Hence we have written a research report spelling out seven useful rules of thumb that are based on this data-file. We will continue expanding the data-file over time for TSE clients.

Nature-based CO2 removals: a summary?

Overview of nature-based CO2 removal

This data-file is an overview of nature-based CO2 removal projects that we have been supporting at Thunder Said Energy. Our research ‘scores’ different nature-based projects on a 100-point scale, using criteria to check whether they are real, incremental, measurable, permanent and bio-diverse. The average project supported so far scores 70/100 and sells CO2 offsets at $5-50/ton.


In 2022, we spent $8,000 to support five projects, which have most likely ‘credited’ 480 tons of CO2, for an average cost of $16/ton. Projects span across Costa Rica, Nicaragua, Kenya, Uganda, Indonesia and Madagascar.

The average nature-based reforestation initiative that we supported in 2022 scored 70/100 on our framework for assessing nature-based CO2 removal projects, and was priced at $17/ton of CO2.

Two of the projects scored over 80/100. Whereas three of the projects were given lower scores, due to question marks around whether they were fully incremental, fully measurable, or fully bio-diverse.

Overall we were least concerned about whether the projects were real, as most of them were issuing CO2 offsets that had been certified by Verra or Gold Standard, independently audited and with detailed documentation.

Overall we were most concerned about whether the projects were permanent, in turn a good reason to consider complementary solutions such as CCS and DAC projects?

Statistical distributions are also explored in this data-file, as there are clearly going to be ‘uncertainties’ in natural remediation projects: both implementing the projects over 40-year timeframes and quantifying the CO2 benefits.

The statistical distributions of nature-based CO2 removals are not normally distributed. We estimate our own probability distributions in the data-file. More on CO2 measurement in our allometry research.

A Monte Carlo approach can be used to quantify nature-based CO2 removals across a portfolio. Overall, we are 75% confident that the projects we supported in 2022 have offset over 400 tons of CO2, and 90% confident they have offset over 300 tons of CO2.

You can download this data-file for an overview of nature-based CO2 removal projects we have supported to-date. Or see our nature-based CO2 removals category for full details on the underlying projects.

Commodity prices: metals, materials and chemicals?

Annual commodity prices are tabulated in this database for 70 material commodities, as a useful reference file; covering steel prices, other metal prices, chemicals prices, polymer prices, with data going back to 2012, all compared in $/ton. 2022 was a record year for commodities. We have updated the data-file for 2023 data in March-2024.


Material commodity prices flow into the costs of producing substantively everything consumed by human civilization, and increasingly consumed as part of the energy transition. Hence this database of annual commodity prices is intended as a useful reference file. Note it only covers metals, materials and chemicals. Energy commodities and agricultural commodities are covered in other TSE data-files.

Source and methodology. The underlying source for this commodity price database is the UN’s Comtrade. This useful resource covers trade between all UN member countries, across thousands of categories, in both value terms ($) and mass terms (kg). Dividing values (in $) by masses (in kg) yields an effective price (in $/kg or $/ton). We have then aggregated, cleaned and averaged the data for 70 materials commodities.

The median commodity in the data-file costs $2,500/ton on an unweighted basis. Although this ranges from $20/ton for aggregates to $75M per ton for palladium metal.

2022 was a record year for material commodity prices. The average material commodity priced 25% above its 10-year average and 40 of the 70 commodities in the database made 10-year highs.

Steel prices reached ten-year highs in 2022, averaging $2,000/ton across the different steel grades that are assessed in the data-file. This matters as 2GTpa of steel form one of the most important underpinnings in all global construction. Our steel research is aggregated here.

Commodity prices
Steel Price by year by steel grade in $ per ton

Base metal prices averaged 40% above their ten-year averages in 2022, as internationally traded prices rose sharply for nickel, rose modestly for aluminium and zinc, and remained high for copper (chart below).

Commodity prices
Base metal prices by year and over time for zinc, aluminium, copper, and nickel in $ per ton

Battery metals and materials prices rose most explosively in 2022, due to bottlenecks in lithium, cobalt, nickel and graphite. This is motivating a shift in battery chemistries, both for vehicles and for energy storage. It also means that the average battery material in our data-file was higher priced than the average Rare Earth metal in the data-file (which is unusual, but not the first time).

Commodity prices
Battery material prices over time $ per ton for lithium, cobalt, manganese, nickel, LiPF6 and lithium carbonate in $ per ton

Commodity chemicals all rose in 2022 across every category tracked in our chart below. These chemicals matter as intermediates. On average, sodium hydroxide prices reached $665/ton in 2022, sulphuric acid prices reached $140/ton and nitric acid prices reached $440/ton.

Commodity prices
Industrial Acids and Caustic Soda Prices over time. NaH, H2O2, HCl, H2SO4 Sulfuric Acid, HNO3 Nitric Acid, H3PO4 Phosphoric Acid, HCN and HF in $ per ton

500MTpa of global plastics and polymers demand is covered in our plastics demand database. Both finished polymer prices (first chart) and underlying olefins and aromatics (as produced by naphtha crackers, second chart) prices rose sharply in 2022. Our recent research has wondered whether terms of trade are likely to become particularly constructive for polyurethanes.

Commodity prices
Polymer prices by year LDPE HDPE PET EVA Polyurethanes Paints and Adhesives in $ per ton
Commodity prices
Olefins and Aromatics Prices over time

Silicon prices matter as they feed in to the costs of solar, and traded silicon prices also reached ten year highs in 2022, before correcting sharply in 2023. Silica prices surpassed $70/ton, silicon metal prices reached $4,000/ton and polysilicon prices surpassed $30/kg (charts below).

Commodity prices
Silica price, silicon price and polysilicon price in $ per ton

The full database captures 70 globally traded materials commodities and their annual prices over time in $/ton, year by year, from 2012-2022. These are: Acrylonitrile prices, Adhesives prices, Aggregates prices, Aluminium prices, Ammonia prices, Battery Graphite prices, Benzene prices, Butadiene prices, Carbon Fiber prices, Cement prices, Cobalt prices, Cobalt Oxide prices, Cold Rolled Steel prices, Concrete prices, Copper prices, Copper Wire prices, Cumene prices, Electric Motor and Generator prices, Electrical Transformer prices, Epoxide prices, Ethanol prices, Ethylene prices, Ethylene Oxide prices, EVA prices, Formaldehyde prices, Glass Fiber prices, Gold prices, Graphite Anode prices, Graphite paste prices, HCl prices, HDPE prices, HF prices, Hot Rolled Steel prices, Hydrogen Peroxide prices, Integrated Circuit prices, LDPE prices, LiPF6 prices, Lithium Carbonate prices, Lithium Metal prices, Manganese prices, Manganese Oxide prices, Methanol prices, NaCN prices, Nickel prices, Nitric Acid prices, Paint prices, Palladium prices, PET prices, Phosphoric Acid prices, Platinum prices, Polyethylene prices, Polysilicon prices, Polyurethane prices, Propylene prices, Propylene Oxide prices, PTFE prices, Rare Earth Magnet prices, Scandium & Yttrium prices, Silica prices, Silicon Metal prices, Silver prices, Sodium Hydroxide prices, Stainless Steel prices, Steel Alloy prices, Sulfuric Acid prices, Toluene prices, Tubular Steel prices, Urea prices, Vehicle prices, Xylene prices, Zinc prices.

Oscar Wilde noted that the cynic is the man who knows the price of everything, but the value of nothing. To avoid falling into this trap, we also have economic models for most of the commodities in this commodity price database.

We will continue adding to this commodity price database amidst our ongoing research. You may find our template useful for running Comtrade queries of your own. Or alternatively, if you are a TSE subscription client and we can help you to use this useful resource, then please do email us any time.

Global plastic demand: breakdown by product, region and use?

Global plastic is estimated at 470MTpa in 2022, rising to 1,000MTpa by 2050. This data-file is a breakdown of global plastic demand, by product, by region and by end use, with historical data back to 1990 and our forecasts out to 2050. Our top conclusions for plastic in the energy transition are summarized below.


Global plastic demand is estimated at 470MTpa in 2022. For perspective, the 100Mbpd global oil market equates to around 5bn tons per year of crude oil, showing that plastics comprise almost 10% of total global oil demand.

Our outlook in the energy transition sees increasing demand for polymers, most likely to 1,000MTpa by 2050. Many polymers are crucial inputs for new energies. Others are used for high-grade insulation, both thermal and electrical. Others for light-weight composites, which lower the energy consumption of transportation technologies.

Global plastic demand by region. The top billion people in the developed world comprise 12% of the world’s population, but 40% of the world’s plastic demand. We see developed world plastics demand running sideways through 2050, while emerging world demand doubles from 300MTpa to 700MTpa (charts below).

Global plastic demand CAGR? Our numbers are not aggressive and include a continued deceleration in the total global demand CAGR, from 7.5% pa growth in the twenty years ending in 1980, to 6% pa in the twenty years ended 2000, to 3.3% pa in the twenty years ended 2022 and around 2.5% pa in the period ending 2050.

Global plastic consumption per capita. Our numbers include an enormous policy push against waste in the developed world, where consumption today is around 170 kg of plastics per person per year. Conversely, plastic demand in the emerging world is 75% lower and averages 40 kg pp pa today, seen rising to 90 kg pp pa by 2050.

Upside to plastics demand? What worries us about these numbers is that they require historical trends to slow down. Historically, each $k pp pa of GDP is associated with 4kg pp pa of plastic demand. But our numbers assume slowing demand in the developed world and slowing demand in the emerging world (chart below).

Please download the model to stress-test your own variations. Underlying inputs are drawn from technical papers, OECD databases and Plastics Europe. The forecasts are our own.

Plastic demand by end use is broken down in the chart below. 35% of today’s plastics are used as packaging materials, 17% as construction materials and c10% for textiles.

The strongest growth outlook is in electrical products (currently 7-9%) and light-weighting transportation. There are few alternatives to plastics in these applications. Conversely, for packaging materials, we see more muted growth, and more substitution towards bioplastics and cellulose-based products from companies such as Stora Enso.

Upside for plastics in the energy transition is especially important, with plastics used in important components of the energy transition, from EVA encapsulants in solar panels, to the resins in wind turbine blades, to strong and light-weight components in more efficient vehicles, to polyurethane insulating materials surrounding substantively all electric components, batteries and vehicles. Of particular note are fluorinated polymers, where the C-F bond is highly inert, and helps resist degradation in electric vehicle batteries.

Plastic demand by material is broken down in the chart below. Today’s market is c20% polypropylene, c15% LDPE, and other large categories with >5% shares include HDPE, PVC, PET, Polyurethanes and Polystyrenes. We think the strongest growth will be in more recyclable plastics, materials linked to the energy transition, and next-gen materials that underpin new technologies such as additive manufacturing.

Feedstock deflation is likely to be a defining theme in the energy transition, as many polymers draw inputs from the catalytic reforming of naphtha. Today, 70% of BTX reformate is blended into gasoline, but we see this being displaced by the rise of electric vehicles, with particular upside for the polyurethane value chain.

Decarbonizing plastic production is also a topic in our research. As a starting point, our ethane cracker model is linked here, and our economic model for converting olefins into polymers is here. CO2 intensity of different plastics from different facilities is tabulated here.

Plastic recycling. We also see potential for plastic-recycling technologies to displace 8-15Mbpd of potential oil demand growth (i.e., naphtha, LPGs and ethane) by 2060, compared to a business-as-usual scenario of demand growth. All of our plastic recycling research is linked here. After a challenging pathway to de-risking this technology, we see front-runners emerging, such as Agilyx, Alterra and Plastic Energy.

Global gas: is there enough gas for energy transition?

Global gas production is forecasted to double from 400bcfd in 2023 to 800bcfd in 2050.

Our roadmap to ‘Net Zero’ requires doubling global gas production from 400bcfd to 800bcfd, as a complement to wind, solar, nuclear and other low-carbon energy. This data-file quantifies global gas production forecasts by country, what do you have to believe about global gas reserves, and is there enough gas?


Global gas production already doubled in the c30 years from 1990-2019, rising at a 2.5% CAGR, which is the same trajectory that needs to be sustained to 2050 on our long-term energy market supply-demand balances.

Amazingly, from 1990-2019, global gas reserves increased from 4,000 TCF to 7,000 TCF, for a reserve replacement ratio of 190%, although the numbers have been cyclical and have fallen below 100% in recent years (chart below).

Another fascinating feature of gas markets is their flexibility, which is shown by plotting monthly gas production by country and over time (chart below). Across the Northern Hemisphere, production runs 6% higher than the annual average in December-January and 6% lower than average in June-August, as producers consciously flex their output to meet fluctuations in demand. Gas output does not show volatility, but voluntarity!

Global gas production by month is typically 15-20bcfd higher than average in Northern Hemisphere winter months and 15-20bcfd lower in Northern Hemisphere summer months, due to variations in heating demand

On our numbers through 2050, as part of the energy transition, a reserve replacement ratio of 107% is needed, while the ‘reserve life’ (RP ratio) will likely also decline from around 50-years today to 25-years in 2050. Please download the data-file for reserve numbers and production numbers by country.

Onshore resource extensions are seen primarily coming from shale, with continued upside in the US, and vast new potential in the Middle East, North Africa and possibly even European shale as a way of replacing Russian gas.

Another offshore cycle is also seen to be necessary, discovering and developing an average of 45 TCF of offshore resources each year in 2023-2050. These are big numbers, equivalent to discovering a large new gas basin (e.g., an “entire Mozambique of gas”) every 3-5 years.

Our best guesses for how a doubling of global gas production might unfold is captured in this model of global gas production forecasts by country/region and global gas reserves. On the other hand, there is no guarantee that coal-to-gas switching will occur on the needed scale for global decarbonization, especially as 2023/24 has seen emerging world countries (India, China) ramping coal instead for energy security reasons.

Biofuel technologies: an overview?

Biofuel technologies overview

This data-file provides an overview of the 3.5Mbpd global biofuels industry, across its main components: corn ethanol, sugarcane ethanol, vegetable oils, palm oil, waste oils (renewable diesel), cellulosic biomass, algal biofuels, biogas and landfill gas.


For each biofuel technology, we describe the production process, advantages and drawbacks; plus we quantify the market size, typical costs, CO2 intensities and yields per acre.

While biofuels can be lower carbon than fossil fuels, they are not zero-carbon, hence continued progress is needed to improve both their economics and their process-efficiencies.

Our long-term estimate is that the total biofuels market could reach 20Mboed (chart below), however this would require another 100M acres of land and oil prices would need to rise to $125/bbl to justify this switch.

The data-file also contains an overview of sustainable aviation fuels, summarizing the opportunity set, then estimating the costs and CO2 intensities of different options.

Vehicles: energy transition conclusions?

Vehicles energy transition research

Vehicles transport people and freight around the world, explaining 70% of global oil demand, 30% of global energy use, 20% of global CO2e emissions. This overview summarizes all of our research into vehicles, and key conclusions for the energy transition.

Electrification is a revolution for small vehicles, a mega-trend of the 21st century. We also believe that large and long-range transportation will remain predominantly combustion-fueled due to unrivalled energy density and practicality. It is most cost-effectively decarbonized via promoting efficiency gains, lower-carbon fuels and CO2 removals.


(1) Electrification is a game changer for light-vehicles, with 3-5x greater fuel economy than combustion vehicles (database here), due to inexorable thermodynamic differences between electric motors and heat engines (overview note here).

(2) Electric vehicle technology continues to improve, in an early innings, with multi-decade running room, which makes it an interesting area for decision makers to explore. We have profiled axial flux motors, which promise 2-3x higher power densities, even versus Tesla’s world-leading PMSRMs while surpassing 96% efficiencies (note here). And SiC power electronics that unlock faster and more efficient switching in the power MOSFETs underlying EV traction inverters.

(3) New and world-changing vehicle types will also be unlocked by electric motors’ greater compactness, simplicity and controllability. e-mobility provides an example with the lowest energy costs per passenger on our chart above. Albeit futuristic, we have also written on opportunities in aerial vehicles, drones and droids, robotics, airships, military technologies, inspection technologies.

(4) EV Charging. Each 1,000 EVs will ultimately require 40 Level 2 (30-40kW) and 3.5 Level 3 (100+ kW) chargers (NREL estimates). But we wonder if EV charging infrastructures will ultimately get overbuilt (for reasons in our note here). Is there a moat in the patents of EV charging specialists, such as Chargepoint? Or Nio? As a result, we are particularly excited by the shovel-makers, the suppliers of materials and electronic components, that will feed into chargers, especially fast chargers. Granular costs of EV chargers are modelled here, and can be compared with the 17c/gallon net margins of conventional fuel retail stations here. An amazing statistic is that a conventional fuel pump dispenses 100x more fuel per minute than a 150kW fast-charger, and we wonder if fast-chargers will stoke demand for CHPs (note here).

(5) Large vehicles that cover large distances face different constraints. For example, once the battery in a heavy truck surpasses 8 tons, yielding c50% of the range of a diesel truck, then additional battery weight starts eating into cargo capacity (data here). And the range of a purely battery powered plane is currently around 90km (data here).

(5a) For trucks, an excellent data-file comparing diesel, LNG, CNG, LPG and H2 fuelling is here. There may be some niche deployments of electric trucks and hydrogen trucks. But we think the majority of long distance, inter-continental trucking will remain powered by liquid fuels, i.e., oil products. Although they may improve efficiency by hybridizing (energy saving data here), including using super-capacitors (note here).

(6) Economies of scale. Larger vessels, which carry more passengers and more freight are inherently more energy efficient. This is visible in the title chart. And we have modelled the economics of container ships, bulk carriers, LNG shipping, commercial aviation, mine trucks, electric railways, pipelines and other offshore vessels.

(7) Light-weighting also improves fuel economy, as energy consumption is a linear function of mass, and replacing 10% of a vehicle’s steel with carbon fiber can improve fuel economy by 16% (vehicle masses are built up here). Polymers research here. This can be compared with typical vehicle manufacturing costs.

(8) Automating vehicles can also make them 15-35% more efficient (note here), although we also wonder whether the improved convenience would also result in more demand for long-distance road travel…

(9) Changing demand patterns? Autos are c95% of <500-mile trips today, planes are c90% of >1,000-mile trips; while long distance travel is c50% leisure and visiting friends (data here). Travel demand correlates with income across all categories (data here). Travel speeds have also improved by over 100x since pre-industrial times (excellent data here, breaking down travel by purpose, vehicle and demographics). We estimate the distribution chain for the typical US consumer costs 1.5bbls of fuel, 600kg of CO2 and $1,000 per annum, across container ships, railways, trucks, delivery vans and cars (data here). But displacing travel demand delivers the deepest reductions of all, in the energy intensity of transportation. Thus we would also consider remote work (note here), digitization (category here), traffic optimization and recycling (here) together with vehicle efficiency technologies. They are all related. But as always, there are good debates to be had about future energy demand and fears over Jevons Paradox.

(10) Hydrogen vehicles. Despite looking for opportunities in hydrogen vehicles and e-fuels, we think there may be more exciting decarbonization opportunities elsewhere: due to higher costs, high energy penalties and challenging practicalities. This follows notes into hydrogen trucks; and data-files into Goldilocks-like fuel cells and hydrogen fuelling stations. A summary of all of our hydrogen research is linked here.

The data-file linked below summarizes all of our research to-date into vehicles, which follows below in chronological order. Note that we have generally shown energy use on a wagon-to-wheel basis and assume 2.0 passengers per passenger vehicle. You can stress test all of the different inputs ($/gal fuel, c/kWh electricity, $/kg hydrogen) in the data-file. Other excellent comparison files are here (EVs vs ICEs, ICEs vs H2 vehicles, diesel vs LNG vs H2 trucks). We have also published similar overviews for our research into batteries, electrification, battery metals and other important materials in the energy transition.

Carbon capture and storage: research conclusions?

Carbon capture and storage (CCS) prevents CO2 from entering the atmosphere. Options include the amine process, blue hydrogen, novel combustion technologies and cutting edge sorbents and membranes. Total CCS costs range from $80-130/ton, while blue value chains seem to be accelerating rapidly in the US. This article summarizes the top conclusions from our carbon capture and storage research.


What is carbon capture and storage? CO2 is a greenhouse gas. But it is also an inevitable product of many energy-releasing reactions, from biology, to materials, to industrial energy, because of the high enthalpy of the C=O bond, at 1,072 kJ/mol. Carbon capture and storage technologies therefore aim to capture unavoidable CO2, purify it, transport it, and sequester it, to prevent it from contributing to climate change.

What are the costs of carbon capture and storage? 10-20% of all decarbonization in our roadmap to net zero will come from CCS, with the limit set by economic costs, ranging from $80-130/ton on today’s technologies, which is towards the upper end of what is affordable. Costs vary by CO2 concentration, by industry, by process unit, but will hopefully be deflated by emerging technologies.

Amines are the incumbent technology among 40MTpa of past carbon capture and storage projects, bubbling CO2-containing exhaust gases through an absorber column of lean amines, which react with CO2 to form rich amines. The CO2 can later be re-released and concentrated by steam-treating the amines in a regenerator. Base case costs are $40-50/ton to absorb the CO2 (model here). Energy costs range from 2.5-3.7GJ/ton. Energy penalties are 15-45% (note here). But a possible operational show-stopper is the emissions of amines and toxic degradation products (note here), with MEA breaking down at 1.75 kg/ton into a nasty soup (data here). Avoiding amine degradation is crucial and usually requires treatment of exhaust gases, to remove dusts, SO2, NOXs, a post-wash and limits on the ramp rates of power plants. This all adds costs.

Leading amines for CCS, which have been de-risked by use in multiple world-scale projects are MHI KS-1/KS-21 and Shell CANSOLV. We have also screened novel amines developed by Aker Carbon Capture (JustCatch), Advantage Energy (Entropy) and Carbon Clean. And alternatives to amines such as potassium carbonates. In our view, this space holds exciting potential, although decision-makers should consider the correct baselines, hidden costs and technology risks.

Blue hydrogen is an alternative to post-combustion CCS, directly converting the methane molecule (CH4) into relatively pure streams of H2, as an energy carrier or feedstock, and CO2 as a waste product for disposal. The two gases are separated via swing adsorption. The technology is mature, there are no issues with toxic emissions, and the world already produces 110MTpa of grey hydrogen, including 10MTpa in the US (data here), mostly via SMRs, emitting 9 tons of CO2 per ton of H2. 60% of the CO2 from an SMR is highly concentrated, and can readily be captured. An adapted design, ATR, can capture over 90% of the CO2 and is also technically mature (note here). Our economic model for blue hydrogen is here. An ATR technology leader is Topsoe.

Blue materials. The US seems to be leading in CCS, over 500MTpa of projects could proceed in the next decade (note here), and 45Q reforms under the Inflation Reduction Act are already kickstarting a boom in blue value chains, from blue ammonia, to blue steel, to blue chemicals. This exciting theme is gathering momentum at a fast pace and could even disrupt global gas balances and LNG exports (note here).

Novel combustion technologies are also maturing rapidly, which may facilitate CCS without amines. NET Power has developed a breakthrough power generation technology, combusting natural gas and pure oxygen in an atmosphere of pure CO2. Thus the combustion products are a pure mix of CO2 and H2O. The CO2 can easily be sequestered, yielding CO2 intensity of 0.04-0.08 kg/kWh, 98-99% below the current US power grid. Costs are 6-8c/kWh (note here, model here). We have also explored similar concepts ranging from chemical looping combustion to molten carbonate fuel cells and solid oxide fuel cells.

Transporting CO2 usually costs $4/ton/100km in a pipeline (model here). But CO2 is a strange gas to compress (note here). CO2 pipelines run above 100-bar, where CO2 becomes super-critical and behaves more like a liquid (e.g., it can be pumped). CO2 can also be liquefied 80% more easily than other gases, for a cost of $15/ton, merely by pressurizing it above 5.2-bar then chilling to -40C (model here). This opens up the possibility of trucking small-scale CO2 for c$17/ton per 100-miles (note here, model here). Similarly, seaborne transport of CO2 costs $8/ton/1,000-miles (model here), and this also opens up a possibility for the LNG industry to ship LNG out, CO2 back (note here). Ships could also capture their own CO2 with onboard CCS for $100/ton (note here).

CO2 disposal requires injecting CO2 into disposal wells at 60-120 bar of pressure. Our base case cost is $20/ton, but can vary from $5-50/ton (model here) and there can be risks (data here). CO2-EOR can re-coup costs of sequestration with an oil price around $50/bbl (note here, model here) and in the past we had hoped this would also drive a subsequent wave of low-carbon production via shale-EOR (note here).

CO2 utilization aims to make valuable use of the CO2 molecules rather than simply pumping them into the ground. Enhancing the concentration of CO2 in greenhouses can improve agricultural yields by c30% (note here). Some chemical pathways use CO2 directly, making methanol, formaldehyde and polyurethanes. The CO2 molecule can also be electrolysed to produce other feedstocks, but costs are c$800/ton (model here). CO2 utilization for curing cement industry is being explored by Solidia and CarbonCure. Other CO2 utilization companies are screened here. The challenge in all of these niches is scaling up to absorb GTpa-scale CO2 within MTpa-scale supply chains.

Direct air capture is a frontier for CCS that aims to absorb CO2, not from an exhaust gas with 4-40% concentration, but from the atmosphere, with 0.04% concentration. On the one hand, this is obviously more thermodynamically demanding, as dictated by the entropy of mixing, but on the other hand, the minimum theoretical energy for DAC is only 140kWh/ton, and the world has simply not invented a process yet that is more than 5-10% thermodynamically efficient. We have modeled solutions from Carbon Engineering at c$300/ton and from Climeworks at c$1,000/ton. Our DAC cost model is here.

Membranes. Next-generation membranes could separate 95% of the CO2 in a flue gas, into 95% pure permeate, for a cost of $20/ton and an energy penalty below 10%, which exceeds the best amines (note here). But today’s costs are higher, especially for pipeline grade CO2 at 99% purity (model here). A CCS membrane leader is MTR (screened here).

Metal organic frameworks are a novel class of materials with high porosity and exceptional tunability, which could become a CCS game-changer, but cannot yet be de-risked (note here). We have screened companies such as Svante in our work.

Cryogenics. The costs to separate the 20% oxygen fraction from air in a cryogenic air separation unit average $100/ton using 300kWh/ton of electricity (model here). If you have a concentrated CO2 stream (e.g., 10-40%) then cryogenics may be an option.

Some summary charts, workings and data-points from our carbon capture and storage research are aggregated in this data-file. All of our broader CCS research is summarized on our CCS category pages.


Global coal production: supply outlook in energy transition?

Global coal production likely hit a new all-time peak of 8.7GTpa in 2023, of which 7.5GTpa is thermal coal and 1.2GTpa is metallurgical. The largest countries are China (4.4GTpa), India (1GTpa), other Asia (0.7GTpa), Europe (0.5GTpa) and the US (0.5GTpa). This model explores what is required to meet our energy transition aspirations.


Coal can be the cheapest thermal energy source on the planet. In normal times, coal costs $60/ton (coal mining model here) and contains 6,250 kWh/ton of thermal energy, implying a cost of 1c/kWh-th.

Coal-fired power can thus cost 2-4c/kWh (model here) and an existing coal plant is cheaper than other levelized costs of power.

Coal is the highest-carbon fossil fuel, with an average CO2 intensity of 0.37 kg/kWh-th (data here), which is 2x more than gas (note here).

The CO2 disparity is amplified further when considering coal’s Scope 1+2 emissions, as often coal mining leaks more methane than gas itself. And Rankine steam cycles fueled by coal have efficiency drawbacks (note here) and also relatively low flexibility (data here).

Hence our Roadmap to Net Zero would need to see coal consumption flat-lining from 2022, then declining at 8% pa in the 2030s and 17% pa in the 2040s, to well below 500MTpa (which in turn is abated by CCS or nature-based solutions).

This is sheer fantasy, unless wind, solar and natural gas ramp up enormously, especially in China, India and other parts of the Emerging World. Coal-to-gas switching economics are profiled here.

Some encouraging precedent come from the US, where coal production peaked at 1GTpa in the 2010s, before shale gas ramped to 80bcfd. Thus US coal declined to 500MTpa in 2021. Although questions about the continued phase-back of US coal are now being raised, due to pipeline bottlenecks from the Marcellus, and energy crisis in Europe, requiring a substitution of Russian energy supplies (oil, coal and gas).

There is always a danger of drawing lines on charts, which simply reflect aspirations, blindly projected out to 2050. The real world may not follow a straight line of pragmatic progress, but instead fluctuate between fantasy and crisis.

During times of energy crisis, such as 2022, international coal prices have spiked to $340/ton. Remarkably, this took thermal coal prices above metallurgical coal, and even above oil on a per-btu basis. Western coal producers are screened here.

Metallurgical coal may be particularly challenging to substitute. We have reviewed the costs of green steel here. We have seen some interesting but smaller-scale options in bio-coke. We have been less excited by hydrogen or syngas from gasification of coal.

Around 1GTpa of new coal projects are in planning or under construction, of which half are in China. Chinese coal production is something of a ‘wildcard’, explored in our short note here, and often defying expectations to the upside, despite rising renewables (chart below). Helping China to decarbonize might require 300bcfd of gas (roadmap here).

India’s coal use has also doubled since 2007, rising at 6% pa. It remains “the engine of global coal demand”, according to the IEA, rising +70MTpa, to 1.1GTpa in 2022, 1.3GTpa in 2023 and 1.4GTpa in 2026.

Please download the data-file to stress-test assumptions around coal mine additions, decline rates, phase-downs and coal-to-gas switching.

Copyright: Thunder Said Energy, 2019-2024.